SPY/QQQ Customizable Price ConverterThis is a minimalist utility tool designed for Index traders (SPX, NDX, RUT). It allows you to monitor the price of a reference asset (like SPY, QQQ) directly on your main chart without cluttering your screen.
Key Features:
1.🖱️ Crosshair Sync for Historical Data (Highlight): Unlike simple info tables that only show the latest price, this script allows for historical inspection.
· How it works: Simply move your mouse crosshair over ANY historical candle on your chart.
· The script will instantly display the closing price of the reference asset (e.g., SPY) for that specific time in the Status Line (top-left) or the Data Window. Perfect for backtesting and reviewing price action.
2.🔄 Fully Customizable Ticker: Default is set to SPY, but you can change it to anything in the settings.
e.g.
· Trading NDX Change it to QQQ.
· Trading RUT Change it to IWM.
3.📊 Clean Real-Time Dashboard:
· A floating table displays the current real-time price of your reference asset.
· Color-coded text (Green/Red) indicates price movement.
· Fully customizable size, position, and colors to fit your layout.
Cari dalam skrip untuk "backtesting"

15m ORB Breakout NAS100 (5m Mgmt) v6 - OptimizedOpening Range Breakout Strategy
Buy and sell signals are given upon break of market session opening range. Best utilized for 30 minute NY opening range, managed on 5 min timeframe on NAS100. Tweak the settings for higher win rate on backtesting dashboard before implementing strategy.

Delta Signals NO REPINTA (FINAL)📢 New Indicator: Delta Signals NO REPAINT 🔥
Introducing my new indicator based on Order Flow Delta, designed to provide buy and sell signals with absolutely NO repainting — perfect for scalping, day trading, or swing trading.
This tool combines two powerful components:
✅ Order Flow Delta — Measures the real strength between buyers and sellers
✅ Smart Trend Filter — Only shows signals in the direction of the dominant trend
Together, they deliver cleaner, more accurate and more reliable signals, with clear entry markers on the chart and a delta histogram revealing real market pressure.
🚀 What’s Included?
🔹 Buy/Sell signals with NO repaint
🔹 Intelligent delta calculation
🔹 Trend filter using moving average
🔹 Clear labels on entry points
🔹 Visual delta histogram
🔹 Works great on Crypto, Forex, Indices & Stocks
🔹 Very lightweight and fast on TradingView
🎯 Why is it powerful?
Because it doesn't rely on lagging indicators — it reads the actual imbalance between buyers and sellers, often detecting strong moves before traditional indicators do.
This type of analysis is used by professional order flow traders, but now you have it on your TradingView chart in a simple, visual format.
🔥 Perfect for:
Scalpers who need precision
Day traders working breakouts and pullbacks
Swing traders seeking strong confirmations
Traders who want clean, NO-repaint signals
If you want a version with automatic TP/SL, alerts, or full backtesting, I can publish that as well.
Just let me know. 🚀📈

BybitMinOrderSizeBybit Order Quantity Compliance Library
This library provides all utility functions required for TradingView strategies
that execute orders on Bybit via webhooks.
Problem:
Bybit enforces two strict rules on every order submitted:
Minimum Order Size – each symbol has its own minimum quantity.
Quantity Precision – each symbol requires rounding to the correct number of decimals.
TradingView does not expose this metadata, so strategies can easily submit
quantities that Bybit rejects as invalid.
Solution (This Library):
This library embeds full Bybit contract metadata, including:
A complete mapping of Bybit symbols → minimum order size
A complete mapping of Bybit symbols → allowed precision (decimal places)
A helper to normalize tickers (removing `.P` suffix for Bybit perpetuals)
It also exposes utility functions to automatically make your quantities valid:
`normalizeTicker()` — removes `.P` for consistent lookup
`getMinOrderSize()` — returns the correct minimum order size
`getPrecisionForTicker()` — returns required quantity precision
`floorQty()` — floors quantities to valid minimum increments
`roundQty()` — rounds quantities to valid decimal precision
Use Cases:
Ensuring webhook strategies never send too-small orders
Rounding limit/market orders correctly before execution
Making Pine strategies execution-accurate for Bybit
Avoiding "order rejected: qty too small / invalid precision" errors
This library is recommended for:
Live trading via TradingView → Bybit webhooks
Backtesting strategies that simulate real Bybit constraints
Source: www.bybit.com
Updated: 2025-11-25 — Bybit contract metadata
normalizeTicker(symbol)
Normalizes Bybit perpetual tickers by removing the ".P" suffix.
precisionFromMinOrder(minOrder)
Derives precision (decimal places) from minimum order size.
getMinOrderSize(symbol)
Retrieves the minimum order size for the current or given symbol.
getPrecisionForTicker(symbol)
Retrieves the required quantity precision (decimal places) for a given Bybit symbol.
floorQty(qty, symbol)
Rounds a quantity down to the nearest valid minimum order size for a given symbol.
roundQty(qty, symbol)
Rounds a quantity to the valid precision for the specified symbol.

Marcaj Ore 07:00 și 18:00 (Stabil v2)For backtesting and remember times that you can be active in the market.

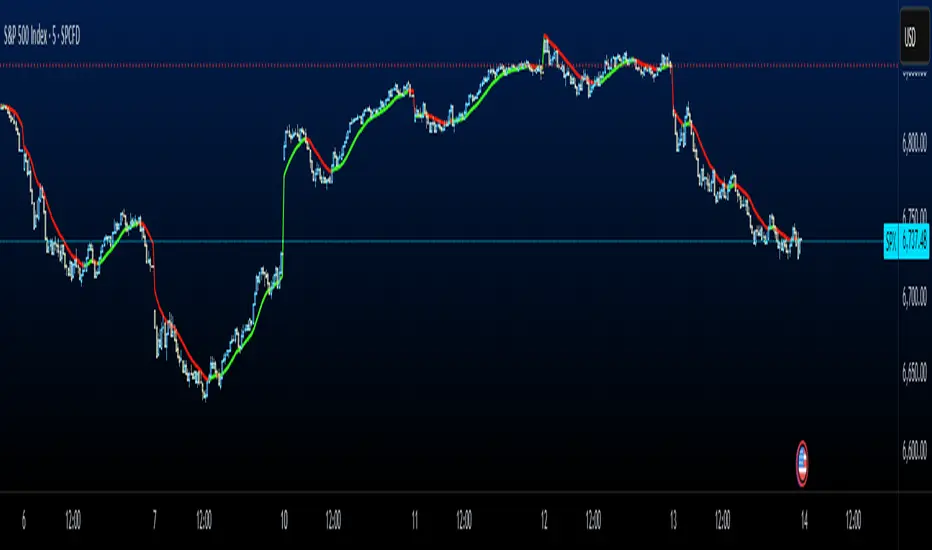
Simple Line📌 Understanding the Basic Concept
The trend reverses only when the price moves up or down by a fixed filter size.
It ignores normal volatility and noise, recognizing a trend change only when price moves beyond a specified threshold.
Trend direction is visually intuitive through line colors (green: uptrend, red: downtrend).
⚙️ Explanation of Settings
Auto Brick Size: Automatically determines the brick/filter size.
Fixed Brick Size: Manually set the size (e.g., 15, 30, 50, 100, etc.).
Volatility Length: The lookback period used for calculations (default: 14).
📈 Example of Identifying Buy Timing
When the line changes from gray or red to green, it signals the start of an uptrend.
This indicates that the price has moved upward by more than the required threshold.
📉 Example of Identifying Sell Timing
When the line changes from green to red, it suggests a possible downtrend reversal.
At this point, consider closing long positions or evaluating short entries.
🧪 Recommended Use Cases
Use as a trend filter to enhance the accuracy of existing strategies.
Can be used alone as a clean directional indicator without complex oscillators.
Works synergistically with trend-following strategies, breakout strategies, and more.
🔒 Notes & Cautions
More suitable for medium- to long-term trend trading than for fast scalping.
If the brick size is too small, the indicator may react to noise.
Sensitivity varies greatly depending on the selected brick size, so backtesting is essential to determine optimal values.
❗ The Trend Simple Line focuses solely on direction—remove the noise and focus purely on the trend.
초대 전용 스크립트
이 스크립트에 대한 접근이 제한되어 있습니다. 사용자는 즐겨찾기에 추가할 수 있지만 사용하려면 사용자의 권한이 필요합니다. 연락처 정보를 포함하여 액세스 요청에 대한 명확한 지침을 제공해 주세요.
이 비공개 초대 전용 스크립트는 스크립트 모더레이터의 검토를 거치지 않았으며, 하우스 룰 준수 여부는 확인되지 않았습니다. 트레이딩뷰는 스크립트의 작동 방식을 충분히 이해하고 작성자를 완전히 신뢰하지 않는 이상, 해당 스크립트에 비용을 지불하거나 사용하는 것을 권장하지 않습니다. 커뮤니티 스크립트에서 무료 오픈소스 대안을 찾아보실 수도 있습니다.
작성자 지시 사항
.
c9indicator
면책사항
해당 정보와 게시물은 금융, 투자, 트레이딩 또는 기타 유형의 조언이나 권장 사항으로 간주되지 않으며, 트레이딩뷰에서 제공하거나 보증하는 것이 아닙니

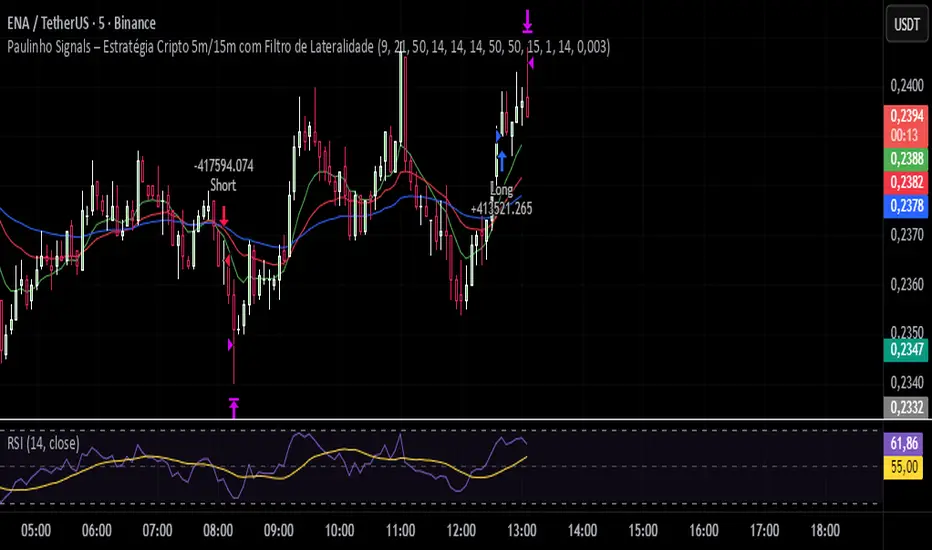
Paulinho Signals – Cripto 5m/15m com Filtro de LateralidadeThis script is an automated Pine Script v6 strategy designed for short-term cryptocurrency trading, especially on 5-minute and 15-minute timeframes. It combines moving average crossovers, trend strength (ADX), volatility (ATR), and candlestick patterns to generate buy and sell signals with a fixed risk/reward management system.
How to Use:
- Apply to cryptocurrency charts on 5m or 15m timeframes.
- Adjust parameters to fit your preferences (EMA, RSI, ADX, ATR).
- Use for backtesting or as a decision-support tool.
Disclaimer:
This script is for educational purposes only and does not constitute financial advice. Always test on demo accounts before applying to live trading.
Multi Timeframe Bollinger Bands Spectrum [Ata]Multi-Timeframe Bollinger Bands Spectrum
Technical Overview
This script integrates multi-timeframe volatility analysis with volume-derived order flow estimation. By combining Bollinger Bands (statistical deviation) with internal candle volume logic, the indicator qualifies price movements to differentiate between sustained trends, reversals, and exhaustion events.
The system is designed to provide a structural context for price action, visualizing market regimes through a dual-zone spectrum and filtering signals based on the interaction between price location and specific volume thresholds.
Core Logic & Calculation
1. Volume Decomposition Algorithm
Instead of using total volume, the script estimates Buying Pressure vs. Selling Pressure based on the close position relative to the candle's High/Low range:
- Buying Volume (vb): Increases as the close approaches the High.
- Selling Volume (vs): Increases as the close approaches the Low.
This logic allows the detection of directional flow even within standard volume bars.
2. Statistical Spectrum
The indicator renders deviations from the Basis (SMA) as two distinct zones:
- Bullish Zone (Blue): Price positioning between the Basis and Upper Band.
- Bearish Zone (Red): Price positioning between the Basis and Lower Band.
This structure is applied across multiple timeframes (overlay) to visualize the macro trend context without noise.
3. Non-Repainting Execution
To ensure historical accuracy and reliability for backtesting, all higher-timeframe data is requested using "lookahead_off". Signals are confirmed only upon the closure of the respective timeframe's candle.
Signal Definitions
Signals are generated only when specific Volatility and Volume conditions intersect:
Reversal Setups (Reaction to Liquidity)
- WALL: Triggered when price rejects the Upper Band accompanied by Extreme Selling Volume (vs > Limit). This suggests active limit sell orders absorbing the rally.
- FLOOR: Triggered when price rejects the Lower Band accompanied by Extreme Buying Volume (vb > Limit). This suggests active limit buy orders absorbing the drop.
- ABSORP: Identifies absorption near the lower bands where selling pressure is met with passive buying (indicated by lower wicks and relative buy volume).
Momentum Setups (Trend Continuation)
- POWER: Validates a breakout above the Upper Band only if supported by Dominant Buying Volume and a strong candle body.
- PANIC: Validates a breakdown below the Lower Band only if supported by Dominant Selling Volume.
- TRAP: Marks failed breakouts where price exits the bands but volume analysis contradicts the move (e.g., low directional volume).
Exhaustion Setups (Statistical Extremes)
- CLIMAX/CRASH: Identifies anomalies where price deviates significantly from the mean (Extreme Deviation) or when volume reaches unsustainable levels relative to the average, often preceding a mean reversion.
Input Parameters
- Bollinger Logic: Configuration for Length and Standard Deviation Multiplier.
- Volume Thresholds: Adjustable factors for Minimum Volume (Trend) and Extreme Volume (Reversal/Climax).
- Timeframe Layers: Toggle visibility for up to 5 higher timeframes.
- Theme: Adjusts label contrast for Dark/Light backgrounds.
Disclaimer
This indicator is strictly for analytical purposes. It provides a visualization of past market data based on statistical and volumetric formulas. Users should apply their own risk management protocols.

MTF Scalper - alemicihanMulti-Timeframe Scalper Strategy: Aligning the Big Picture for Quick Gains
This article presents a robust futures trading strategy designed for high-frequency scalping in the crypto market. It’s built on the principle of minimizing risk by ensuring that short-term entries are always aligned with the dominant, higher-timeframe trend.
The Core Concept: Alignment is Key
A Balanced Trend Follower approach, now refined for rapid scalping, uses a Multi-Timeframe (MTF) confirmation system to filter out market noise and increase the probability of a successful trade.
The strategy operates on a Low Timeframe (LTF) chart (e.g., 3m, 5m, or 15m) but only executes trades if the direction is validated by three Higher Timeframes (HTF).
ComponentPurposeFunctionHTF (D, 4h, 1h) EMA => Trend Confirmation =>Checks if the current price is above/below all three Exponential Moving Averages (EMA 20). This provides a strong directional bias.
LTF (5m) Stochastic RSI => Momentum Entry => Generates the actual buy/sell signal by spotting a swift crossover, indicating fresh momentum in the direction of the confirmed HTF trend.
How The Signal Is Generated
Trend Alignment: The system first confirms the trend. If the price is trading above the Daily, 4-Hour, and 1-Hour EMAs, the market is deemed to be in a Strong LONG Trend. Only LONG signals are permitted.
Momentum Trigger: Once the trend is confirmed, a Long Signal is generated only when the Stochastic K-Line crosses above the D-Line, indicating a momentum shift (a pullback ending) towards the main trend direction.
Short Signal: The inverse logic applies to the Short Trend confirmation and entry signal.
Mandatory Risk Management: ATR-Based Exit
Given the high leverage nature of futures and scalping, static Stop-Loss (SL) and Take-Profit (TP) levels are inefficient. This strategy uses the Average True Range (ATR) indicator to dynamically set profit and loss targets based on current market volatility.
Stop Loss (SL): Set dynamically at 1.5 x ATR below (for long) or above (for short) the entry price. This gives the trade enough room to breathe without risking excessive capital.
Take Profit (TP): Set dynamically at 3.0 x ATR, establishing a robust Risk-to-Reward Ratio of 1:2.
Final Thoughts on Testing
This sophisticated approach combines the reliability of MTF analysis with the speed of momentum indicators. However, data analysis is key. Backtesting these parameters (EMA, ATR Multipliers, RSI/Stochastic lengths) on your chosen asset (like BTC/USDT or ETH/USDT) and timeframe is crucial to achieving optimal performance.

Multi-Timeframe TTM Squeeze Pro with alerts and screenersBased of John Carters TTM Squeeze. Must open the settings and select wether you want to match the timeframe in your chart. This must be done in the pinescreener as well otherwise results will not be correct.
---
# **Squeeze Momentum Pro – Enhanced Screener + EMA Cross Alerts**
This custom version of the Squeeze Momentum indicator expands the standard TTM-style squeeze with screening and automated alert logic so you can quickly find high-quality setups across many tickers.
---
## **What This Script Does**
This indicator plots a three-level squeeze visual similar to TTM Squeeze:
Dot meanings in this indicator
Orange dot:
Strongest squeeze – Bollinger Bands are inside the tightest Keltner level (highest volatility compression).
Red dot:
Medium squeeze – still compressed, but not as tight as orange.
Black dot:
Weak squeeze / lowest level of volatility compression.
Price is coiling, but not as tight as the higher levels.
Green dot (“Fired”):
Squeeze has released — Bollinger Bands have expanded out of the channels and momentum is moving.
A momentum histogram is plotted to show directional pressure during the squeeze.
---
## **Major Improvements Added**
### **① Screenable Conditions for Stock Scanners**
This version includes multiple `alertcondition()` flags so the script can be used as a **Pine Screener inside TradingView**.
Currently it can screen for:
✔ Price closing above the 50-SMA
✔ Presence of an **orange (strong) squeeze dot**
✔ 6/20 EMA crossover signals inside a squeeze
These can be used inside the TradingView Screener or in watchlists to automatically highlight qualifying tickers.
---
### **② 6/20 EMA Trend Signals (Filtered by Squeeze)**
A crossover system was added:
* **Bullish Signal:** 6 EMA crosses above 20 EMA
* **Bearish Signal:** 6 EMA crosses below 20 EMA
But **these signals only trigger if the market is in a red or orange squeeze**, which helps remove noise and focus on valid setups.
---
### **③ Visual Markers Under the Histogram**
Whenever an EMA crossover occurs during a squeeze:
* A **green up-triangle** is plotted for a bullish cross
* A **red down-triangle** for a bearish cross
These markers are drawn **below the histogram**, keeping the display clean while still providing quick visual cues.
---
### **④ Fully Non-Repainting Logic**
All signals and squeeze calculations are based on standard fully-resolved `ta.*` functions, making the results stable both in backtesting and real-time.
---
## **Who This Script Helps**
This version is ideal for:
* Traders who use TradingView’s screener and want automated breakout/continuation filtering
* Traders who scan large watchlists for squeeze setups
* Users who want trend confirmation during volatility compression
---
## **How to Use It**
1. Add the script to your chart
2. Open TradingView Alerts or Screener
3. Select the conditions you want, for example:
* *“Orange Squeeze Detected”*
* *“Squeeze Fire after 3 squeeze dots*
* *“4 REd Dots in a row.”*
* *“Buy Alert”*
* *“EMA 6/20 Bullish Crossover (Squeeze Only)”*
* *“Close Above 50 SMA”*
Once active, TradingView will automatically flag symbols that meet the criteria.
---
## **Summary**
This enhanced Squeeze Momentum indicator turns the standard TTM-style visual into a **true screening and alert system** by adding:
* Multi-level squeezes
* EMA trend signals
* Screener-compatible alert conditions
* Clean visual signals
* Non-repainting logic
It helps traders quickly locate high-probability setups across any watchlist or market.

Hash Momentum IndicatorHash Momentum Indicator
Overview
The Hash Momentum Indicator provides real-time momentum-based trading signals with visual entry/exit markers and automatic risk management levels. This is the indicator version of the popular Hash Momentum Strategy, designed for traders who want signal alerts without backtesting functionality.
Perfect for: Live trading, automation via alerts, multi-indicator setups, and clean chart visualization.
What Makes This Indicator Special
1. Pure Momentum-Based Signals
Captures price acceleration in real-time - not lagging moving average crossovers. Enters when momentum exceeds a dynamic ATR-based threshold, catching moves as they begin accelerating.
2. Automatic Risk Management Visualization
Every signal automatically displays:
Entry level (white dashed line)
Stop loss level (red line)
Take profit target (green line)
Partial TP levels (dotted green lines)
3. Smart Trade Management
Trade Cooldown: Prevents overtrading by enforcing waiting period between signals
EMA Trend Filter: Only trades with the trend (optional)
Session Filters: Trade only during Tokyo/London/New York sessions (optional)
Weekend Toggle: Avoid low-liquidity weekend periods (optional)
4. Clean Visual Design
🟢 Tiny green dot = Long entry signal
🔴 Tiny red dot = Short entry signal
🔵 Blue X = Long exit
🟠 Orange X = Short exit
No cluttered labels or dashboard - just clean signals
5. Professional Alerts Ready
Set up TradingView alerts for:
Long signals
Short signals
Long exits
Short exits
How It Works
Step 1: Calculate Momentum
Momentum = Current Price - Price
Normalized by standard deviation for consistency
Must exceed ATR × Threshold to trigger
Step 2: Confirm Acceleration
Momentum must be increasing (positive momentum change)
Price must be moving in signal direction
Step 3: Apply Filters
EMA Filter: Long only above EMA, short only below EMA (if enabled)
Session Filter: Check if in allowed trading session (if enabled)
Weekend Filter: Block signals on Sat/Sun (if enabled)
Cooldown: Ensure minimum bars passed since last signal
Step 4: Generate Signal
All conditions met = Entry signal fires
Lines automatically drawn for entry, stop, and targets
Step 5: Exit Detection
Opposite momentum detected = Exit signal
Stop loss or take profit hit = Exit signal
Lines removed from chart
⚙️ Settings Guide
Core Strategy
Momentum Length (Default: 13)
Number of bars for momentum calculation. Higher values = stronger signals but fewer trades.
Aggressive: 10
Balanced: 13
Conservative: 18-24
Momentum Threshold (Default: 2.25)
ATR multiplier for signal generation. Higher values = only trade the biggest momentum moves.
Aggressive: 2.0
Balanced: 2.25
Conservative: 2.5-3.0
Risk:Reward Ratio (Default: 2.5)
Your target profit as a multiple of your risk. With 2.2% stop and 2.5 R:R, your target is 5.5% profit.
Conservative: 3.0+ (need 25% win rate to profit)
Balanced: 2.5 (need 29% win rate to profit)
Aggressive: 2.0 (need 33% win rate to profit)

Macketings 1min ScalpingThis is a hyper-reactive scalping strategy designed for the 1-minute chart. It utilizes a strict four-EMA hierarchy (80/90/340/500) to ensure trades are only taken in the strongest aligned market trend. The strategy is built to be extremely tight on risk and focuses on capturing the immediate, high-momentum swing that follows a confirmed EMA retest or breakout.
Key Mechanics (How it Works):
Strict Trend Alignment: Entry is only permitted when the faster EMA band (80/90) and the price action are correctly aligned with the slow trend (340/500).
Long: EMA 80/90 must be above EMA 340/500, AND EMA 340 must be above EMA 500. (And vice-versa for Short.)
Expanded Retest Entry: The strategy waits for the price to retest or briefly enter the 80/90 band, then immediately enters upon the confirmed momentum breakout from that band.
Dynamic Risk Management (Tight Ride): The strategy is engineered to ride the wave aggressively while protecting capital immediately:
Extremely Tight Initial Stop Loss (0.2% default): Limits initial risk instantly.
Break-Even Security: Once profit hits 0.3%, the Stop Loss is automatically trailed to secure 0.2% profit (a risk-free trade).
Aggressive Exit Logic: Positions are closed not only upon hitting the Take Profit target (2.5%) but also immediately if the 80/90 EMA band crosses the 340 EMA, signaling a critical loss of momentum.
Disclaimer:
This strategy requires high-liquidity instruments and is best used on low timeframes (1-minute) due to its dependency on fast momentum shifts and tight stops. Backtesting and forward testing are crucial before deployment.

90D High % Pullback Lines (Hybrid 10 Lines)90D High % Pullback Lines (Hybrid 10 Lines) visualizes drawdown levels from the 90-day high, with up to 10 fully customizable percentage-based lines.
This tool makes it easy to identify pullbacks, dip-buy zones, trend continuation points, and discount regions in any market.
🔍 Features
✅ Up to 10 customizable pullback levels
Each line has its own % drop setting
Turn any line ON/OFF individually
Example presets: −10%, −20%, −30%, … −95%
✅ Two rendering modes
1. Hybrid Fixed Line Mode (Stable / Anti-Shift)
Prevents line drift caused by chart updates
Keeps horizontal levels synchronized on every bar
Best stability for intraday & real-time use
2. Lightweight plot (stepline) Mode
Ideal for backtesting
Fully compatible with alerts
Clean and fast rendering
✅ Supports daily-based 90-day high
Even on lower timeframes, the indicator can use the daily 90-day high
Ideal for MTF (multi-timeframe) analysis
🎯 Use Cases
Instantly see how far price has pulled back (%) from the 90-day high
Build systematic dip-buy / trend-follow setups
Identify discount zones during volatility
Monitor recovery signals after strong sell-offs
Works great for crypto, FX, indices, and stocks
🚨 Alerts Included
Alerts trigger when closing price crosses any selected pullback line
Useful for automated dip-buy alerts, breakout alerts, etc.
📌 Notes
Due to internal TradingView behavior, public indicators may behave slightly differently from real-time script editing mode.
The Hybrid Line Mode is designed to provide the most stable and drift-free line display.

14:30 New York OpenRed dotted line at NY open. Shows new traders where NY opens. Helpful for backtesting and when trading that session where it starts very quickly

Any Strategy BacktestA simple script for backtesting your strategies with TP and SL settings. For this to work, your indicators must have sources for long and short conditions.

Nadaraya-Watson: Rational Quadratic Kernel (Opening Gap Shift)What we did to fix it: We didn't throw out the old data (that made it too jumpy early in the day).
Instead, we "tricked" the kernel by shifting all the previous day's prices up or down by the exact gap amount (e.g., if it gapped up 50 points, add 50 to every old price point). This makes the history "line up" with the new day's starting level.
Created so with a fresh session the Nadaraya-Watson Regression Kernel is relevant from the get go - no catch up on opening gaps.
All credit to jdehorty his full description is below.
What is Nadaraya–Watson Regression?
Nadaraya–Watson Regression is a type of Kernel Regression, which is a non-parametric method for estimating the curve of best fit for a dataset. Unlike Linear Regression or Polynomial Regression, Kernel Regression does not assume any underlying distribution of the data. For estimation, it uses a kernel function, which is a weighting function that assigns a weight to each data point based on how close it is to the current point. The computed weights are then used to calculate the weighted average of the data points.
How is this different from using a Moving Average?
A Simple Moving Average is actually a special type of Kernel Regression that uses a Uniform (Retangular) Kernel function. This means that all data points in the specified lookback window are weighted equally. In contrast, the Rational Quadratic Kernel function used in this indicator assigns a higher weight to data points that are closer to the current point. This means that the indicator will react more quickly to changes in the data.
Why use the Rational Quadratic Kernel over the Gaussian Kernel?
The Gaussian Kernel is one of the most commonly used Kernel functions and is used extensively in many Machine Learning algorithms due to its general applicability across a wide variety of datasets. The Rational Quadratic Kernel can be thought of as a Gaussian Kernel on steroids; it is equivalent to adding together many Gaussian Kernels of differing length scales. This allows the user even more freedom to tune the indicator to their specific needs.
The formula for the Rational Quadratic function is:
K(x, x') = (1 + ||x - x'||^2 / (2 * alpha * h^2))^(-alpha)
where x and x' data are points, alpha is a hyperparameter that controls the smoothness (i.e. overall "wiggle") of the curve, and h is the band length of the kernel.
Does this Indicator Repaint?
No, this indicator has been intentionally designed to NOT repaint. This means that once a bar has closed, the indicator will never change the values in its plot. This is useful for backtesting and for trading strategies that require a non-repainting indicator.
Settings:
Bandwidth. This is the number of bars that the indicator will use as a lookback window.
Relative Weighting Parameter. The alpha parameter for the Rational Quadratic Kernel function. This is a hyperparameter that controls the smoothness of the curve. A lower value of alpha will result in a smoother, more stretched-out curve, while a lower value will result in a more wiggly curve with a tighter fit to the data. As this parameter approaches 0, the longer time frames will exert more influence on the estimation, and as it approaches infinity, the curve will become identical to the one produced by the Gaussian Kernel.
Color Smoothing. Toggles the mechanism for coloring the estimation plot between rate of change and cross over modes.
Range Oscillator Strategy + Stoch Confirm🔹 Short summary
This is a free, educational long-only strategy built on top of the public “Range Oscillator” by Zeiierman (used under CC BY-NC-SA 4.0), combined with a Stochastic timing filter, an EMA-based exit filter and an optional risk-management layer (SL/TP and R-multiple exits). It is NOT financial advice and it is NOT a magic money machine. It’s a structured framework to study how range-expansion + momentum + trend slope can be combined into one rule-based system, often with intentionally RARE trades.
────────────────────────
0. Legal / risk disclaimer
────────────────────────
• This script is FREE and public. I do not charge any fee for it.
• It is for EDUCATIONAL PURPOSES ONLY.
• It is NOT financial advice and does NOT guarantee profits.
• Backtest results can be very different from live results.
• Markets change over time; past performance is NOT indicative of future performance.
• You are fully responsible for your own trades and risk.
Please DO NOT use this script with money you cannot afford to lose. Always start in a demo / paper trading environment and make sure you understand what the logic does before you risk any capital.
────────────────────────
1. About default settings and risk (very important)
────────────────────────
The script is configured with the following defaults in the `strategy()` declaration:
• `initial_capital = 10000`
→ This is only an EXAMPLE account size.
• `default_qty_type = strategy.percent_of_equity`
• `default_qty_value = 100`
→ This means 100% of equity per trade in the default properties.
→ This is AGGRESSIVE and should be treated as a STRESS TEST of the logic, not as a realistic way to trade.
TradingView’s House Rules recommend risking only a small part of equity per trade (often 1–2%, max 5–10% in most cases). To align with these recommendations and to get more realistic backtest results, I STRONGLY RECOMMEND you to:
1. Open **Strategy Settings → Properties**.
2. Set:
• Order size: **Percent of equity**
• Order size (percent): e.g. **1–2%** per trade
3. Make sure **commission** and **slippage** match your own broker conditions.
• By default this script uses `commission_value = 0.1` (0.1%) and `slippage = 3`, which are reasonable example values for many crypto markets.
If you choose to run the strategy with 100% of equity per trade, please treat it ONLY as a stress-test of the logic. It is NOT a sustainable risk model for live trading.
────────────────────────
2. What this strategy tries to do (conceptual overview)
────────────────────────
This is a LONG-ONLY strategy designed to explore the combination of:
1. **Range Oscillator (Zeiierman-based)**
- Measures how far price has moved away from an adaptive mean.
- Uses an ATR-based range to normalize deviation.
- High positive oscillator values indicate strong price expansion away from the mean in a bullish direction.
2. **Stochastic as a timing filter**
- A classic Stochastic (%K and %D) is used.
- The logic requires %K to be below a user-defined level and then crossing above %D.
- This is intended to catch moments when momentum turns up again, rather than chasing every extreme.
3. **EMA Exit Filter (trend slope)**
- An EMA with configurable length (default 70) is calculated.
- The slope of the EMA is monitored: when the slope turns negative while in a long position, and the filter is enabled, it triggers an exit condition.
- This acts as a trend-protection exit: if the medium-term trend starts to weaken, the strategy exits even if the oscillator has not yet fully reverted.
4. **Optional risk-management layer**
- Percentage-based Stop Loss and Take Profit (SL/TP).
- Risk/Reward (R-multiple) exit based on the distance from entry to SL.
- Implemented as OCO orders that work *on top* of the logical exits.
The goal is not to create a “holy grail” system but to serve as a transparent, configurable framework for studying how these concepts behave together on different markets and timeframes.
────────────────────────
3. Components and how they work together
────────────────────────
(1) Range Oscillator (based on “Range Oscillator (Zeiierman)”)
• The script computes a weighted mean price and then measures how far price deviates from that mean.
• Deviation is normalized by an ATR-based range and expressed as an oscillator.
• When the oscillator is above the **entry threshold** (default 100), it signals a strong move away from the mean in the bullish direction.
• When it later drops below the **exit threshold** (default 30), it can trigger an exit (if enabled).
(2) Stochastic confirmation
• Classic Stochastic (%K and %D) is calculated.
• An entry requires:
- %K to be below a user-defined “Cross Level”, and
- then %K to cross above %D.
• This is a momentum confirmation: the strategy tries to enter when momentum turns up from a pullback rather than at any random point.
(3) EMA Exit Filter
• The EMA length is configurable via `emaLength` (default 70).
• The script monitors the EMA slope: it computes the relative change between the current EMA and the previous EMA.
• If the slope turns negative while the strategy holds a long position and the filter is enabled, it triggers an exit condition.
• This is meant to help protect profits or cut losses when the medium-term trend starts to roll over, even if the oscillator conditions are not (yet) signalling exit.
(4) Risk management (optional)
• Stop Loss (SL) and Take Profit (TP):
- Defined as percentages relative to average entry price.
- Both are disabled by default, but you can enable them in the Inputs.
• Risk/Reward Exit:
- Uses the distance from entry to SL to project a profit target at a configurable R-multiple.
- Also optional and disabled by default.
These exits are implemented as `strategy.exit()` OCO orders and can close trades independently of oscillator/EMA conditions if hit first.
────────────────────────
4. Entry & Exit logic (high level)
────────────────────────
A) Time filter
• You can choose a **Start Year** in the Inputs.
• Only candles between the selected start date and 31 Dec 2069 are used for backtesting (`timeCondition`).
• This prevents accidental use of tiny cherry-picked windows and makes tests more honest.
B) Entry condition (long-only)
A long entry is allowed when ALL the following are true:
1. `timeCondition` is true (inside the backtest window).
2. If `useOscEntry` is true:
- Range Oscillator value must be above `entryLevel`.
3. If `useStochEntry` is true:
- Stochastic condition (`stochCondition`) must be true:
- %K < `crossLevel`, then %K crosses above %D.
If these filters agree, the strategy calls `strategy.entry("Long", strategy.long)`.
C) Exit condition (logical exits)
A position can be closed when:
1. `timeCondition` is true AND a long position is open, AND
2. At least one of the following is true:
- If `useOscExit` is true: Oscillator is below `exitLevel`.
- If `useMagicExit` (EMA Exit Filter) is true: EMA slope is negative (`isDown = true`).
In that case, `strategy.close("Long")` is called.
D) Risk-management exits
While a position is open:
• If SL or TP is enabled:
- `strategy.exit("Long Risk", ...)` places an OCO stop/limit order based on the SL/TP percentages.
• If Risk/Reward exit is enabled:
- `strategy.exit("RR Exit", ...)` places an OCO order using a projected R-multiple (`rrMult`) of the SL distance.
These risk-based exits can trigger before the logical oscillator/EMA exits if price hits those levels.
────────────────────────
5. Recommended backtest configuration (to avoid misleading results)
────────────────────────
To align with TradingView House Rules and avoid misleading backtests:
1. **Initial capital**
- 10 000 (or any value you personally want to work with).
2. **Order size**
- Type: **Percent of equity**
- Size: **1–2%** per trade is a reasonable starting point.
- Avoid risking more than 5–10% per trade if you want results that could be sustainable in practice.
3. **Commission & slippage**
- Commission: around 0.1% if that matches your broker.
- Slippage: a few ticks (e.g. 3) to account for real fills.
4. **Timeframe & markets**
- Volatile symbols (e.g. crypto like BTCUSDT, or major indices).
- Timeframes: 1H / 4H / **1D (Daily)** are typical starting points.
- I strongly recommend trying the strategy on **different timeframes**, for example 1D, to see how the behaviour changes between intraday and higher timeframes.
5. **No “caution warning”**
- Make sure your chosen symbol + timeframe + settings do not trigger TradingView’s caution messages.
- If you see warnings (e.g. “too few trades”), adjust timeframe/symbol or the backtest period.
────────────────────────
5a. About low trade count and rare signals
────────────────────────
This strategy is intentionally designed to trade RARELY:
• It is **long-only**.
• It uses strict filters (Range Oscillator threshold + Stochastic confirmation + optional EMA Exit Filter).
• On higher timeframes (especially **1D / Daily**) this can result in a **low total number of trades**, sometimes WELL BELOW 100 trades over the whole backtest.
TradingView’s House Rules mention 100+ trades as a guideline for more robust statistics. In this specific case:
• The **low trade count is a conscious design choice**, not an attempt to cherry-pick a tiny, ultra-profitable window.
• The goal is to study a **small number of high-conviction long entries** on higher timeframes, not to generate frequent intraday signals.
• Because of the low trade count, results should NOT be interpreted as statistically strong or “proven” – they are only one sample of how this logic would have behaved on past data.
Please keep this in mind when you look at the equity curve and performance metrics. A beautiful curve with only a handful of trades is still just a small sample.
────────────────────────
6. How to use this strategy (step-by-step)
────────────────────────
1. Add the script to your chart.
2. Open the **Inputs** tab:
- Set the backtest start year.
- Decide whether to use Oscillator-based entry/exit, Stochastic confirmation, and EMA Exit Filter.
- Optionally enable SL, TP, and Risk/Reward exits.
3. Open the **Properties** tab:
- Set a realistic account size if you want.
- Set order size to a realistic % of equity (e.g. 1–2%).
- Confirm that commission and slippage are realistic for your broker.
4. Run the backtest:
- Look at Net Profit, Max Drawdown, number of trades, and equity curve.
- Remember that a low trade count means the statistics are not very strong.
5. Experiment:
- Tweak thresholds (`entryLevel`, `exitLevel`), Stochastic settings, EMA length, and risk params.
- See how the metrics and trade frequency change.
6. Forward-test:
- Before using any idea in live trading, forward-test on a demo account and observe behaviour in real time.
────────────────────────
7. Originality and usefulness (why this is more than a mashup)
────────────────────────
This script is not intended to be a random visual mashup of indicators. It is designed as a coherent, testable strategy with clear roles for each component:
• Range Oscillator:
- Handles mean vs. range-expansion states via an adaptive, ATR-normalized metric.
• Stochastic:
- Acts as a timing filter to avoid entering purely on extremes and instead waits for momentum to turn.
• EMA Exit Filter:
- Trend-slope-based safety net to exit when the medium-term direction changes against the position.
• Risk module:
- Provides practical, rule-based exits: SL, TP, and R-multiple exit, which are useful for structuring risk even if you modify the core logic.
It aims to give traders a ready-made **framework to study and modify**, not a black box or “signals” product.
────────────────────────
8. Limitations and good practices
────────────────────────
• No single strategy works on all markets or in all regimes.
• This script is long-only; it does not short the market.
• Performance can degrade when market structure changes.
• Overfitting (curve fitting) is a real risk if you endlessly tweak parameters to maximise historical profit.
Good practices:
- Test on multiple symbols and timeframes.
- Focus on stability and drawdown, not only on how high the profit line goes.
- View this as a learning tool and a basis for your own research.
────────────────────────
9. Licensing and credits
────────────────────────
• Core oscillator idea & base code:
- “Range Oscillator (Zeiierman)”
- © Zeiierman, licensed under CC BY-NC-SA 4.0.
• Strategy logic, Stochastic confirmation, EMA Exit Filter, and risk-management layer:
- Modifications by jokiniemi.
Please respect both the original license and TradingView House Rules if you fork or republish any part of this script.
────────────────────────
10. No payments / no vendor pitch
────────────────────────
• This script is completely FREE to use on TradingView.
• There is no paid subscription, no external payment link, and no private signals group attached to it.
• If you have questions, please use TradingView’s comment system or private messages instead of expecting financial advice.
Use this script as a tool to learn, experiment, and build your own understanding of markets.
────────────────────────
11. Example backtest settings used in screenshots
────────────────────────
To avoid any confusion about how the results shown in screenshots were produced, here is one concrete example configuration:
• Symbol: BTCUSDT (or similar major BTC pair)
• Timeframe: 1D (Daily)
• Backtest period: from 2018 to the most recent data
• Initial capital: 10 000
• Order size type: Percent of equity
• Order size: 2% per trade
• Commission: 0.1%
• Slippage: 3 ticks
• Risk settings: Stop Loss and Take Profit disabled by default, Risk/Reward exit disabled by default
• Filters: Range Oscillator entry/exit enabled, Stochastic confirmation enabled, EMA Exit Filter enabled
If you change any of these settings (symbol, timeframe, risk per trade, commission, slippage, filters, etc.), your results will look different. Please always adapt the configuration to your own risk tolerance, market, and trading style.

MA SMART Angle
### 📊 WHAT IS MA SMART ANGLE?
**MA SMART Angle** is an advanced momentum and trend detection indicator that analyzes the angles (slopes) of multiple moving averages to generate clear, non-repainting BUY and SELL signals.
**Original Concept Credit:** This indicator builds upon the "MA Angles" concept originally created by **JD** (also known as Duyck). The core angle calculation methodology and Jurik Moving Average (JMA) implementation by **Everget** are preserved from the original open-source work. The angle calculation formula was contributed by **KyJ**. This enhanced version is published with respect to the open-source nature of the original indicator.
Original indicator reference: "ma angles - JD" by Duyck
---
## 🎯 ORIGINALITY & VALUE PROPOSITION
### **What Makes This Different from the Original:**
While the original "MA Angles" by **JD** provided excellent angle visualization, it lacked actionable entry signals. **MA SMART Angle** addresses this by adding:
**1. Clear Entry/Exit Signals**
- Explicit BUY/SELL arrows based on angle crossovers, momentum confirmation, and MA alignment
- No guessing when to enter trades - the indicator tells you exactly when conditions align
**2. Non-Repainting Logic**
- All signals use confirmed historical data (shifted by 2 bars minimum)
- Critical for backtesting reliability and live trading confidence
- Original indicator could repaint signals on current bar
**3. Dual Signal System**
- **Simple Mode:** More frequent signals based on angle crossovers + momentum (for active traders)
- **Strict Mode:** Requires full multi-MA alignment + momentum confirmation (for conservative traders)
- Adaptable to different trading styles and risk tolerances
**4. Smart Signal Filtering**
- **Anti-spam cooldown:** Prevents duplicate signals within configurable bar count
- **No-trade zone detection:** Filters out low-conviction sideways markets automatically
- **Multi-timeframe MA alignment:** Ensures all moving averages agree on direction before signaling
**5. Enhanced Visualization**
- Large, clear BUY/SELL arrows with descriptive labels
- Color-coded backgrounds for market states (trending vs. ranging)
- Momentum histogram showing acceleration/deceleration in real-time
- Live status table displaying trend strength, angle value, momentum, and MA alignment
**6. Professional Alert System**
- Four distinct alert conditions: BUY Signal, SELL Signal, Strong BUY, Strong SELL
- Enables automated trade notifications and strategy integration
**7. Modified MA Periods**
- Original used EMA(27), EMA(83), EMA(278)
- Enhanced version uses faster EMA(3), EMA(8), EMA(13) for more responsive signals
- Better suited for modern volatile markets and shorter timeframes
---
## 📐 HOW IT WORKS - TECHNICAL EXPLANATION
### **Core Methodology:**
The indicator calculates angles (slopes) for five key moving averages:
- **JMA (Jurik Moving Average)** - Smooth, lag-reduced trend line (original implementation by **Everget**)
- **JMA Fast** - Responsive momentum indicator with higher power parameter
- **MA27 (EMA 3)** - Primary fast-moving average for signal generation
- **MA83 (EMA 8)** - Medium-term trend confirmation
- **MA278 (EMA 13)** - Slower trend filter
### **Angle Calculation Formula (by KyJ):**
```
angle = arctan((MA - MA ) / ATR(14)) × (180 / π)
```
**Why ATR normalization?**
- Makes angles comparable across different instruments (forex, stocks, crypto)
- Makes angles comparable across different timeframes
- Accounts for volatility - a 10-point move in different assets has different significance
**Angle Interpretation:**
- **> 15°** = Strong trend (momentum accelerating)
- **0° to 15°** = Weak trend (momentum present but moderate)
- **-2° to +2°** = No-trade zone (sideways/choppy market)
- **< -15°** = Strong downtrend
### **Signal Generation Logic:**
#### **BUY Signal Conditions:**
1. MA27 angle crosses above 0° (upward momentum initiates)
2. All three EMAs (3, 8, 13) pointing upward (trend alignment confirmed)
3. Momentum is positive for 2+ bars (acceleration, not deceleration)
4. Angle exceeds minimum threshold (not in no-trade zone)
5. Cooldown period passed (prevents signal spam)
#### **SELL Signal Conditions:**
1. MA27 angle crosses below 0° (downward momentum initiates)
2. All three EMAs pointing downward (downtrend alignment)
3. Momentum is negative for 2+ bars
4. Angle below negative threshold (not in no-trade zone)
5. Cooldown period passed
#### **Strong BUY+ / SELL+ Signals:**
Additional entry opportunities when JMA Fast crosses JMA Slow while maintaining strong directional angle - indicates momentum acceleration within established trend.
---
## 🔧 HOW TO USE
### **Recommended Settings by Trading Style:**
**Scalpers / Day Traders:**
- Signal Type: **Simple**
- Minimum Angle: **3-5°**
- Cooldown Bars: **3-5 bars**
- Timeframes: 1m, 5m, 15m
**Swing Traders:**
- Signal Type: **Strict**
- Minimum Angle: **7-10°**
- Cooldown Bars: **8-12 bars**
- Timeframes: 1H, 4H, Daily
**Position Traders:**
- Signal Type: **Strict**
- Minimum Angle: **10-15°**
- Cooldown Bars: **15-20 bars**
- Timeframes: Daily, Weekly
### **Parameter Descriptions:**
**1. Source** (default: OHLC4)
- Price data used for MA calculations
- OHLC4 provides smoothest angles
- Close is more responsive but noisier
**2. Threshold for No-Trade Zones** (default: 2°)
- Angles below this are considered sideways/ranging
- Increase for stricter filtering of choppy markets
- Decrease to allow signals in quieter trending periods
**3. Signal Type** (Simple vs. Strict)
- **Simple:** Angle crossover OR (trend + momentum)
- **Strict:** Angle crossover AND all MAs aligned AND momentum confirmed
- Start with Simple, switch to Strict if too many false signals
**4. Minimum Angle for Signal** (default: 5°)
- Only generate signals when angle exceeds this threshold
- Higher values = stronger trends required
- Lower values = more sensitive to momentum changes
**5. Cooldown Bars** (default: 5)
- Minimum bars between consecutive signals
- Prevents spam during volatile chop
- Scale with your timeframe (higher TF = more bars)
**6. Color Bars** (default: true)
- Colors chart bars based on signal state
- Green = bullish conditions, Red = bearish conditions
- Can disable if you prefer clean price bars
**7. Background Colors**
- **Yellow background** = No-trade zone (low angle, ranging market)
- **Green flash** = BUY signal generated
- **Red flash** = SELL signal generated
- All customizable or can be disabled
---
## 📊 INTERPRETING THE INDICATOR
### **Visual Elements:**
**Main Chart Window:**
- **Thick Lime/Fuchsia Line** = MA27 angle (primary signal line)
- **Medium Green/Red Line** = MA83 angle (trend confirmation)
- **Thin Green/Red Line** = MA278 angle (slow trend filter)
- **Aqua/Orange Line** = JMA Fast (momentum detector)
- **Green/Red Area** = JMA slope (overall trend context)
- **Blue/Purple Histogram** = Momentum (angle acceleration/deceleration)
**Signal Arrows:**
- **Large Green ▲ "BUY"** = Primary buy signal (all conditions met)
- **Small Green ▲ "BUY+"** = Strong momentum buy (JMA fast cross)
- **Large Red ▼ "SELL"** = Primary sell signal (all conditions met)
- **Small Red ▼ "SELL+"** = Strong momentum sell (JMA fast cross)
**Status Table (Top Right):**
- **Angle:** Current MA27 angle in degrees
- **Trend:** Classification (STRONG UP/DOWN, UP/DOWN, FLAT)
- **Momentum:** Acceleration state (ACCEL UP/DN, Up/Down)
- **MAs:** Alignment status (ALL UP/DOWN, Mixed)
- **Zone:** Trading zone status (ACTIVE vs. NO TRADE)
- **Last:** Bars since last signal
### **Trading Strategies:**
**Strategy 1: Pure Signal Following**
- Enter LONG on BUY signal
- Exit on SELL signal
- Use stop-loss at recent swing low/high
- Works best on trending instruments
**Strategy 2: Confirmation with Price Action**
- Wait for BUY signal + bullish candlestick pattern
- Wait for SELL signal + bearish candlestick pattern
- Increases win rate by filtering premature signals
- Recommended for beginners
**Strategy 3: Momentum Acceleration**
- Use BUY+/SELL+ signals for adding to positions
- Only take these in direction of primary signal
- Scalp quick moves during momentum spikes
- For experienced traders
**Strategy 4: Mean Reversion in No-Trade Zones**
- When status shows "NO TRADE", fade extremes
- Wait for angle to exit no-trade zone for reversal
- Contrarian approach for range-bound markets
- Requires tight stops
---
## ⚠️ LIMITATIONS & DISCLAIMERS
**What This Indicator DOES:**
✅ Measures momentum direction and strength via angle analysis
✅ Generates signals when multiple conditions align
✅ Filters out low-conviction sideways markets
✅ Provides visual clarity on trend state
**What This Indicator DOES NOT:**
❌ Predict future price movements with certainty
❌ Guarantee profitable trades (no indicator can)
❌ Work equally well on all instruments/timeframes
❌ Replace proper risk management and position sizing
**Known Limitations:**
- **Lagging Nature:** Like all moving averages, signals occur after momentum begins
- **Whipsaw Risk:** Can generate false signals in volatile, directionless markets
- **Optimization Required:** Parameters need adjustment for different assets
- **Not a Complete System:** Should be combined with risk management, position sizing, and other analysis
**Best Performance Conditions:**
- Strong trending markets (crypto bull runs, stock breakouts)
- Liquid instruments (major forex pairs, large-cap stocks)
- Appropriate timeframe selection (match to trading style)
- Used alongside support/resistance and volume analysis
---
## 🔔 ALERT SETUP
The indicator includes four alert conditions:
**1. BUY SIGNAL**
- Message: "MA SMART Angle: BUY SIGNAL! Angle crossed up with momentum"
- Use for: Primary long entries
**2. SELL SIGNAL**
- Message: "MA SMART Angle: SELL SIGNAL! Angle crossed down with momentum"
- Use for: Primary short entries or long exits
**3. Strong BUY**
- Message: "MA SMART Angle: Strong BUY momentum - JMA fast crossed up"
- Use for: Adding to longs or aggressive entries
**4. Strong SELL**
- Message: "MA SMART Angle: Strong SELL momentum - JMA fast crossed down"
- Use for: Adding to shorts or aggressive exits
**Setting Up Alerts:**
1. Right-click indicator → "Add Alert on MA SMART Angle"
2. Select desired condition from dropdown
3. Choose notification method (popup, email, webhook)
4. Set alert expiration (typically "Once Per Bar Close")
---
## 📚 EDUCATIONAL VALUE
This indicator serves as an excellent learning tool for understanding:
**1. Angle-Based Momentum Analysis**
- Traditional indicators show MA crossovers
- This shows the *rate of change* (velocity) of MAs
- Teaches traders to think in terms of momentum acceleration
**2. Multi-Timeframe Confirmation**
- Shows how fast, medium, and slow MAs interact
- Demonstrates importance of trend alignment
- Helps develop patience for high-probability setups
**3. Signal Quality vs. Quantity Tradeoff**
- Simple mode = more signals, more noise
- Strict mode = fewer signals, higher quality
- Teaches discretionary filtering skills
**4. Market State Recognition**
- Visual distinction between trending and ranging markets
- Helps traders avoid trading choppy conditions
- Develops "market context" awareness
---
## 🔄 DIFFERENCES FROM OTHER MA INDICATORS
**vs. Traditional MA Crossovers:**
- Measures momentum (angle) rather than just price crossing MA
- Provides earlier signals as angles change before price crosses
- Filters better for sideways markets using no-trade zones
**vs. MACD:**
- Uses multiple MAs instead of just two
- ATR normalization makes it universal across instruments
- Visual angle representation more intuitive than histogram
**vs. Supertrend:**
- Not based on ATR bands but on MA slope analysis
- Provides graduated strength indication (not just binary trend)
- Less prone to whipsaw in low volatility
**vs. Original "MA Angles" by JD:**
- Adds explicit entry/exit signals (original had none)
- Implements no-repaint logic for reliability
- Includes signal filtering and quality controls
- Provides dual signal systems (Simple/Strict)
- Enhanced visualization and status monitoring
- Uses faster MA periods (3/8/13 vs 27/83/278) for modern markets
---
## 📖 CODE STRUCTURE (for Pine Script learners)
This indicator demonstrates:
**Advanced Pine Script Techniques:**
- Custom function implementation (JMA, angle calculation)
- Var declarations for stateful tracking
- Table creation for HUD display
- Multi-condition signal logic
- Alert system integration
- Proper use of historical references for no-repaint
**Code Organization:**
- Modular function definitions (JMA, angle)
- Clear separation of concerns (inputs, calculations, plotting, alerts)
- Extensive commenting for maintainability
- Best practices for Pine Script v5
**Learning Resources:**
- Study the JMA function to understand adaptive smoothing
- Examine angle calculation for ATR normalization technique
- Review signal logic for multi-condition confirmation patterns
- Analyze anti-spam filtering for state management
The code is open-source - feel free to study, modify, and improve upon it!
---
## 🙏 CREDITS & ATTRIBUTION
**Original Concepts:**
- **"ma angles - JD" by JD (Duyck)** - Core angle calculation methodology and indicator concept
Original open-source indicator on TradingView Community Scripts
- **JMA (Jurik Moving Average) implementation by Everget** - Smooth, low-lag moving average function
Acknowledged in original JD indicator code
- **Angle Calculation formula by KyJ** - Mathematical formula for converting MA slope to degrees using ATR normalization
Acknowledged in original JD indicator code comments
**Enhancements in This Version:**
- Signal generation logic - Original implementation for this indicator
- No-repaint confirmation system - Original implementation
- Dual signal modes (Simple/Strict) - Original implementation
- Visual enhancements and status table - Original implementation
- Alert system and signal filtering - Original implementation
- Modified MA periods (3/8/13 instead of 27/83/278) - Optimization for modern markets
**Open Source Philosophy:**
This indicator follows the open-source spirit of TradingView and the Pine Script community. The original "ma angles - JD" by JD (Duyck) was published as open-source, enabling this enhanced version. Similarly, this code is published as open-source to allow further community improvements.
---
## ⚡ QUICK START GUIDE
**For New Users:**
1. Add indicator to chart
2. Start with default settings (Simple mode)
3. Wait for BUY signal (green arrow)
4. Observe how price behaves after signal
5. Check status table to understand market state
6. Adjust parameters based on your instrument/timeframe
**For Experienced Traders:**
1. Switch to Strict mode for higher quality signals
2. Increase cooldown bars to reduce frequency
3. Raise minimum angle threshold for stronger trends
4. Combine with your existing strategy for confirmation
5. Set up alerts for desired signal types
6. Backtest on your preferred instruments
---
## 🎓 RECOMMENDED COMBINATIONS
**Works Well With:**
- **Volume Analysis:** Confirm signals with volume spikes
- **Support/Resistance:** Take signals near key levels
- **RSI/Stochastic:** Avoid overbought/oversold extremes
- **ATR:** Size positions based on volatility
- **Price Action:** Wait for candlestick confirmation
**Complementary Indicators:**
- Order Flow / Footprint (for institutional confirmation)
- Volume Profile (for identifying value areas)
- VWAP (for intraday mean reversion reference)
- Fibonacci Retracements (for target setting)
---
## 📈 PERFORMANCE EXPECTATIONS
**Realistic Win Rates:**
- Simple Mode: 45-55% (higher frequency, moderate accuracy)
- Strict Mode: 55-65% (lower frequency, higher accuracy)
- Combined with price action: 60-70%
**Best Asset Classes:**
1. **Cryptocurrencies** (strong trends, clear signals)
2. **Forex Major Pairs** (smooth price action, good angles)
3. **Large-Cap Stocks** (trending behavior, liquid)
4. **Index Futures** (trending instruments)
**Challenging Conditions:**
- Low volatility consolidation periods
- News-driven erratic movements
- Thin/illiquid instruments
- Counter-trending markets
---
## 🛡️ RISK DISCLAIMER
**IMPORTANT LEGAL NOTICE:**
This indicator is for **educational and informational purposes only**. It is **NOT financial advice** and does not constitute a recommendation to buy or sell any financial instrument.
**Trading Risks:**
- Trading carries substantial risk of loss
- Past performance does not guarantee future results
- No indicator can predict market movements with certainty
- You can lose more than your initial investment (especially with leverage)
**User Responsibilities:**
- Conduct your own research and due diligence
- Understand the instruments you trade
- Never risk more than you can afford to lose
- Use proper position sizing and risk management
- Consider consulting a licensed financial advisor
**Indicator Limitations:**
- Signals are based on historical data only
- No guarantee of accuracy or profitability
- Parameters must be optimized for your specific use case
- Results vary significantly by market conditions
By using this indicator, you acknowledge and accept all trading risks. The author is not responsible for any financial losses incurred through use of this indicator.
---
## 📧 SUPPORT & FEEDBACK
**Found a bug?** Please report it in the comments with:
- Chart symbol and timeframe
- Parameter settings used
- Description of unexpected behavior
- Screenshot if possible
**Have suggestions?** Share your ideas for improvements!
**Enjoying the indicator?** Leave a like and follow for updates!

Mickey's Breaker Engine⚡ Breaker Engine | Auto Retest + Smart R:R Targets
A precision-grade breaker-block detection system built for traders who live and breathe clean structure.
This indicator automatically detects Breaker Candles, confirms them, marks their zones, and executes intelligent retest-based entry logic — complete with Stop-Loss and Risk-to-Reward (R:R) tracking up to 3R (or any custom ratio).
🧠 Core Concept
A Breaker Block is a structural shift where price violates liquidity from a failed order block and flips the zone’s polarity — turning a former supply into demand (or vice-versa).
This script identifies those setups automatically, confirms them only after a valid structure break, and waits for a clean retest to trigger a trade signal.
🚀 Key Features
⚙️ Smart Zone Detection
Detects both Bullish Breakers and Bearish Breakers.
Zones are drawn precisely using the breaker’s middle candle body (or full wick range if enabled).
Fully configurable transparency, width, and extension for better visual context.
🎯 Auto Retest Entry Logic
Entry triggers only on a clean retest, not on immediate breakout.
Includes logical filters to ensure retests are structurally valid and not overlapping candles.
Works in any timeframe or market — crypto, forex, indices, or commodities.
💡 Dynamic Risk–Reward Tracking
Automatically plots 1R, 2R, 3R, ...R targets based on your defined stop range.
Risk is calculated from entry to zone boundary or ATR offset.
Each target label appears precisely when hit.
Targets automatically stop updating once Stop-Loss is triggered.
🧱 Visual Clarity
BUY 🟢 / SELL 🔴 bubbles at entries.
SL ❌ marker when stop is hit.
🎯 1R / 2R / 3R labels dynamically plotted when each reward level is reached.
Non-overlapping placement using ATR-based spacing.
⚡ Real-Time Alerts - Instant alerts for:
✅ “Breaker BUY” – Clean retest confirmed (Long setup)
✅ “Breaker SELL” – Clean retest confirmed (Short setup)
❌ “Breaker BUY SL” – Stop hit for Long
❌ “Breaker SELL SL” – Stop hit for Short
🧩 Customization Panel
| Setting | Description |
| :-------------------------- | :------------------------------------------------------------------------------ |
| **ATR Length** | Controls volatility-based offset sizing. |
| **Entry / SL Offset × ATR** | Adjusts label spacing and dynamic positioning. |
| **Risk-Reward Ratio** | Define default R:R (e.g. 1:3). |
| **Multiple Retests** | Enable if you want the same breaker zone to allow multiple retests/entries. |
| **Banner Design** | Control opacity, extension, and wick usage for the breaker block visualization. |
| **Color Controls** | Choose your BUY/SELL/SL bubble colors to match your chart theme. |
⚙️ Underlying Logic (At a Glance)
Pattern Detection:
Identifies a 5-bar sequence that forms a valid Breaker Candle (the middle bar flips structure).
Confirmation:
Requires a follow-through candle to validate a real liquidity break.
Zone Registration:
Stores the breaker zone’s body range in arrays for tracking.
Clean Retest Entry:
Waits for price to retest the zone from the opposite side and close cleanly inside.
Stop Loss / Target Projection:
Defines stop loss just beyond the zone and plots up to 3 × reward targets dynamically.
Monitoring & Alerts:
Tracks each setup independently until either an R-target or SL is reached.
💬 Recommended Usage
Works best with market-structure traders, smart-money concepts, or liquidity-based systems.
Combine it with an external displacement confirmation or BOS/CHOCH tool for best precision.
Ideal for backtesting breaker-based R:R consistency or forward-testing retest entries.
Compatible with any asset / timeframe.
🧭 Disclaimer
This script is for educational and analytical purposes only.
It is not financial advice and should not be used to make trading decisions without independent confirmation or risk management.
Always test on demo data before deploying live.

Algorithm Predator - ML-liteAlgorithm Predator - ML-lite
This indicator combines four specialized trading agents with an adaptive multi-armed bandit selection system to identify high-probability trade setups. It is designed for swing and intraday traders who want systematic signal generation based on institutional order flow patterns , momentum exhaustion , liquidity dynamics , and statistical mean reversion .
Core Architecture
Why These Components Are Combined:
The script addresses a fundamental challenge in algorithmic trading: no single detection method works consistently across all market conditions. By deploying four independent agents and using reinforcement learning algorithms to select or blend their outputs, the system adapts to changing market regimes without manual intervention.
The Four Trading Agents
1. Spoofing Detector Agent 🎭
Detects iceberg orders through persistent volume at similar price levels over 5 bars
Identifies spoofing patterns via asymmetric wick analysis (wicks exceeding 60% of bar range with volume >1.8× average)
Monitors order clustering using simplified Hawkes process intensity tracking (exponential decay model)
Signal Logic: Contrarian—fades false breakouts caused by institutional manipulation
Best Markets: Consolidations, institutional trading windows, low-liquidity hours
2. Exhaustion Detector Agent ⚡
Calculates RSI divergence between price movement and momentum indicator over 5-bar window
Detects VWAP exhaustion (price at 2σ bands with declining volume)
Uses VPIN reversals (volume-based toxic flow dissipation) to identify momentum failure
Signal Logic: Counter-trend—enters when momentum extreme shows weakness
Best Markets: Trending markets reaching climax points, over-extended moves
3. Liquidity Void Detector Agent 💧
Measures Bollinger Band squeeze (width <60% of 50-period average)
Identifies stop hunts via 20-bar high/low penetration with immediate reversal and volume spike
Detects hidden liquidity absorption (volume >2× average with range <0.3× ATR)
Signal Logic: Breakout anticipation—enters after liquidity grab but before main move
Best Markets: Range-bound pre-breakout, volatility compression zones
4. Mean Reversion Agent 📊
Calculates price z-scores relative to 50-period SMA and standard deviation (triggers at ±2σ)
Implements Ornstein-Uhlenbeck process scoring (mean-reverting stochastic model)
Uses entropy analysis to detect algorithmic trading patterns (low entropy <0.25 = high predictability)
Signal Logic: Statistical reversion—enters when price deviates significantly from statistical equilibrium
Best Markets: Range-bound, low-volatility, algorithmically-dominated instruments
Adaptive Selection: Multi-Armed Bandit System
The script implements four reinforcement learning algorithms to dynamically select or blend agents based on performance:
Thompson Sampling (Default - Recommended):
Uses Bayesian inference with beta distributions (tracks alpha/beta parameters per agent)
Balances exploration (trying underused agents) vs. exploitation (using proven winners)
Each agent's win/loss history informs its selection probability
Lite Approximation: Uses pseudo-random sampling from price/volume noise instead of true random number generation
UCB1 (Upper Confidence Bound):
Calculates confidence intervals using: average_reward + sqrt(2 × ln(total_pulls) / agent_pulls)
Deterministic algorithm favoring agents with high uncertainty (potential upside)
More conservative than Thompson Sampling
Epsilon-Greedy:
Exploits best-performing agent (1-ε)% of the time
Explores randomly ε% of the time (default 10%, configurable 1-50%)
Simple, transparent, easily tuned via epsilon parameter
Gradient Bandit:
Uses softmax probability distribution over agent preference weights
Updates weights via gradient ascent based on rewards
Best for Blend mode where all agents contribute
Selection Modes:
Switch Mode: Uses only the selected agent's signal (clean, decisive)
Blend Mode: Combines all agents using exponentially weighted confidence scores controlled by temperature parameter (smooth, diversified)
Lock Agent Feature:
Optional manual override to force one specific agent
Useful after identifying which agent dominates your specific instrument
Only applies in Switch mode
Four choices: Spoofing Detector, Exhaustion Detector, Liquidity Void, Mean Reversion
Memory System
Dual-Layer Architecture:
Short-Term Memory: Stores last 20 trade outcomes per agent (configurable 10-50)
Long-Term Memory: Stores episode averages when short-term reaches transfer threshold (configurable 5-20 bars)
Memory Boost Mechanism: Recent performance modulates agent scores by up to ±20%
Episode Transfer: When an agent accumulates sufficient results, averages are condensed into long-term storage
Persistence: Manual restoration of learned parameters via input fields (alpha, beta, weights, microstructure thresholds)
How Memory Works:
Agent generates signal → outcome tracked after 8 bars (performance horizon)
Result stored in short-term memory (win = 1.0, loss = 0.0)
Short-term average influences agent's future scores (positive feedback loop)
After threshold met (default 10 results), episode averaged into long-term storage
Long-term patterns (weighted 30%) + short-term patterns (weighted 70%) = total memory boost
Market Microstructure Analysis
These advanced metrics quantify institutional order flow dynamics:
Order Flow Toxicity (Simplified VPIN):
Measures buy/sell volume imbalance over 20 bars: |buy_vol - sell_vol| / (buy_vol + sell_vol)
Detects informed trading activity (institutional players with non-public information)
Values >0.4 indicate "toxic flow" (informed traders active)
Lite Approximation: Uses simple open/close heuristic instead of tick-by-tick trade classification
Price Impact Analysis (Simplified Kyle's Lambda):
Measures market impact efficiency: |price_change_10| / sqrt(volume_sum_10)
Low values = large orders with minimal price impact ( stealth accumulation )
High values = retail-dominated moves with high slippage
Lite Approximation: Uses simplified denominator instead of regression-based signed order flow
Market Randomness (Entropy Analysis):
Counts unique price changes over 20 bars / 20
Measures market predictability
High entropy (>0.6) = human-driven, chaotic price action
Low entropy (<0.25) = algorithmic trading dominance (predictable patterns)
Lite Approximation: Simple ratio instead of true Shannon entropy H(X) = -Σ p(x)·log₂(p(x))
Order Clustering (Simplified Hawkes Process):
Tracks self-exciting event intensity (coordinated order activity)
Decays at 0.9× per bar, spikes +1.0 when volume >1.5× average
High intensity (>0.7) indicates clustering (potential spoofing/accumulation)
Lite Approximation: Simple exponential decay instead of full λ(t) = μ + Σ α·exp(-β(t-tᵢ)) with MLE
Signal Generation Process
Multi-Stage Validation:
Stage 1: Agent Scoring
Each agent calculates internal score based on its detection criteria
Scores must exceed agent-specific threshold (adjusted by sensitivity multiplier)
Agent outputs: Signal direction (+1/-1/0) and Confidence level (0.0-1.0)
Stage 2: Memory Boost
Agent scores multiplied by memory boost factor (0.8-1.2 based on recent performance)
Successful agents get amplified, failing agents get dampened
Stage 3: Bandit Selection/Blending
If Adaptive Mode ON:
Switch: Bandit selects single best agent, uses only its signal
Blend: All agents combined using softmax-weighted confidence scores
If Adaptive Mode OFF:
Traditional consensus voting with confidence-squared weighting
Signal fires when consensus exceeds threshold (default 70%)
Stage 4: Confirmation Filter
Raw signal must repeat for consecutive bars (default 3, configurable 2-4)
Minimum confidence threshold: 0.25 (25%) enforced regardless of mode
Trend alignment check: Long signals require trend_score ≥ -2, Short signals require trend_score ≤ 2
Stage 5: Cooldown Enforcement
Minimum bars between signals (default 10, configurable 5-15)
Prevents over-trading during choppy conditions
Stage 6: Performance Tracking
After 8 bars (performance horizon), signal outcome evaluated
Win = price moved in signal direction, Loss = price moved against
Results fed back into memory and bandit statistics
Trading Modes (Presets)
Pre-configured parameter sets:
Conservative: 85% consensus, 4 confirmations, 15-bar cooldown
Expected: 60-70% win rate, 3-8 signals/week
Best for: Swing trading, capital preservation, beginners
Balanced: 70% consensus, 3 confirmations, 10-bar cooldown
Expected: 55-65% win rate, 8-15 signals/week
Best for: Day trading, most traders, general use
Aggressive: 60% consensus, 2 confirmations, 5-bar cooldown
Expected: 50-58% win rate, 15-30 signals/week
Best for: Scalping, high-frequency trading, active management
Elite: 75% consensus, 3 confirmations, 12-bar cooldown
Expected: 58-68% win rate, 5-12 signals/week
Best for: Selective trading, high-conviction setups
Adaptive: 65% consensus, 2 confirmations, 8-bar cooldown
Expected: Varies based on learning
Best for: Experienced users leveraging bandit system
How to Use
1. Initial Setup (5 Minutes):
Select Trading Mode matching your style (start with Balanced)
Enable Adaptive Learning (recommended for automatic agent selection)
Choose Thompson Sampling algorithm (best all-around performance)
Keep Microstructure Metrics enabled for liquid instruments (>100k daily volume)
2. Agent Tuning (Optional):
Adjust Agent Sensitivity multipliers (0.5-2.0):
<0.8 = Highly selective (fewer signals, higher quality)
0.9-1.2 = Balanced (recommended starting point)
1.3 = Aggressive (more signals, lower individual quality)
Monitor dashboard for 20-30 signals to identify dominant agent
If one agent consistently outperforms, consider using Lock Agent feature
3. Bandit Configuration (Advanced):
Blend Temperature (0.1-2.0):
0.3 = Sharp decisions (best agent dominates)
0.5 = Balanced (default)
1.0+ = Smooth (equal weighting, democratic)
Memory Decay (0.8-0.99):
0.90 = Fast adaptation (volatile markets)
0.95 = Balanced (most instruments)
0.97+ = Long memory (stable trends)
4. Signal Interpretation:
Green triangle (▲): Long signal confirmed
Red triangle (▼): Short signal confirmed
Dashboard shows:
Active agent (highlighted row with ► marker)
Win rate per agent (green >60%, yellow 40-60%, red <40%)
Confidence bars (█████ = maximum confidence)
Memory size (short-term buffer count)
Colored zones display:
Entry level (current close)
Stop-loss (1.5× ATR)
Take-profit 1 (2.0× ATR)
Take-profit 2 (3.5× ATR)
5. Risk Management:
Never risk >1-2% per signal (use ATR-based stops)
Signals are entry triggers, not complete strategies
Combine with your own market context analysis
Consider fundamental catalysts and news events
Use "Confirming" status to prepare entries (not to enter early)
6. Memory Persistence (Optional):
After 50-100 trades, check Memory Export Panel
Record displayed alpha/beta/weight values for each agent
Record VPIN and Kyle threshold values
Enable "Restore From Memory" and input saved values to continue learning
Useful when switching timeframes or restarting indicator
Visual Components
On-Chart Elements:
Spectral Layers: EMA8 ± 0.5 ATR bands (dynamic support/resistance, colored by trend)
Energy Radiance: Multi-layer glow boxes at signal points (intensity scales with confidence, configurable 1-5 layers)
Probability Cones: Projected price paths with uncertainty wedges (15-bar projection, width = confidence × ATR)
Connection Lines: Links sequential signals (solid = same direction continuation, dotted = reversal)
Kill Zones: Risk/reward boxes showing entry, stop-loss, and dual take-profit targets
Signal Markers: Triangle up/down at validated entry points
Dashboard (Configurable Position & Size):
Regime Indicator: 4-level trend classification (Strong Bull/Bear, Weak Bull/Bear)
Mode Status: Shows active system (Adaptive Blend, Locked Agent, or Consensus)
Agent Performance Table: Real-time win%, confidence, and memory stats
Order Flow Metrics: Toxicity and impact indicators (when microstructure enabled)
Signal Status: Current state (Long/Short/Confirming/Waiting) with confirmation progress
Memory Panel (Configurable Position & Size):
Live Parameter Export: Alpha, beta, and weight values per agent
Adaptive Thresholds: Current VPIN sensitivity and Kyle threshold
Save Reminder: Visual indicator if parameters should be recorded
What Makes This Original
This script's originality lies in three key innovations:
1. Genuine Meta-Learning Framework:
Unlike traditional indicator mashups that simply display multiple signals, this implements authentic reinforcement learning (multi-armed bandits) to learn which detection method works best in current conditions. The Thompson Sampling implementation with beta distribution tracking (alpha for successes, beta for failures) is statistically rigorous and adapts continuously. This is not post-hoc optimization—it's real-time learning.
2. Episodic Memory Architecture with Transfer Learning:
The dual-layer memory system mimics human learning patterns:
Short-term memory captures recent performance (recency bias)
Long-term memory preserves historical patterns (experience)
Automatic transfer mechanism consolidates knowledge
Memory boost creates positive feedback loops (successful strategies become stronger)
This architecture allows the system to adapt without retraining , unlike static ML models that require batch updates.
3. Institutional Microstructure Integration:
Combines retail-focused technical analysis (RSI, Bollinger Bands, VWAP) with institutional-grade microstructure metrics (VPIN, Kyle's Lambda, Hawkes processes) typically found in academic finance literature and professional trading systems, not standard retail platforms. While simplified for Pine Script constraints, these metrics provide insight into informed vs. uninformed trading , a dimension entirely absent from traditional technical analysis.
Mashup Justification:
The four agents are combined specifically for risk diversification across failure modes:
Spoofing Detector: Prevents false breakout losses from manipulation
Exhaustion Detector: Prevents chasing extended trends into reversals
Liquidity Void: Exploits volatility compression (different regime than trending)
Mean Reversion: Provides mathematical anchoring when patterns fail
The bandit system ensures the optimal tool is automatically selected for each market situation, rather than requiring manual interpretation of conflicting signals.
Why "ML-lite"? Simplifications and Approximations
This is the "lite" version due to necessary simplifications for Pine Script execution:
1. Simplified VPIN Calculation:
Academic Implementation: True VPIN uses volume bucketing (fixed-volume bars) and tick-by-tick buy/sell classification via Lee-Ready algorithm or exchange-provided trade direction flags
This Implementation: 20-bar rolling window with simple open/close heuristic (close > open = buy volume)
Impact: May misclassify volume during ranging/choppy markets; works best in directional moves
2. Pseudo-Random Sampling:
Academic Implementation: Thompson Sampling requires true random number generation from beta distributions using inverse transform sampling or acceptance-rejection methods
This Implementation: Deterministic pseudo-randomness derived from price and volume decimal digits: (close × 100 - floor(close × 100)) + (volume % 100) / 100
Impact: Not cryptographically random; may have subtle biases in specific price ranges; provides sufficient variation for agent selection
3. Hawkes Process Approximation:
Academic Implementation: Full Hawkes process uses maximum likelihood estimation with exponential kernels: λ(t) = μ + Σ α·exp(-β(t-tᵢ)) fitted via iterative optimization
This Implementation: Simple exponential decay (0.9 multiplier) with binary event triggers (volume spike = event)
Impact: Captures self-exciting property but lacks parameter optimization; fixed decay rate may not suit all instruments
4. Kyle's Lambda Simplification:
Academic Implementation: Estimated via regression of price impact on signed order flow over multiple time intervals: Δp = λ × Δv + ε
This Implementation: Simplified ratio: price_change / sqrt(volume_sum) without proper signed order flow or regression
Impact: Provides directional indicator of impact but not true market depth measurement; no statistical confidence intervals
5. Entropy Calculation:
Academic Implementation: True Shannon entropy requires probability distribution: H(X) = -Σ p(x)·log₂(p(x)) where p(x) is probability of each price change magnitude
This Implementation: Simple ratio of unique price changes to total observations (variety measure)
Impact: Measures diversity but not true information entropy with probability weighting; less sensitive to distribution shape
6. Memory System Constraints:
Full ML Implementation: Neural networks with backpropagation, experience replay buffers (storing state-action-reward tuples), gradient descent optimization, and eligibility traces
This Implementation: Fixed-size array queues with simple averaging; no gradient-based learning, no state representation beyond raw scores
Impact: Cannot learn complex non-linear patterns; limited to linear performance tracking
7. Limited Feature Engineering:
Advanced Implementation: Dozens of engineered features, polynomial interactions (x², x³), dimensionality reduction (PCA, autoencoders), feature selection algorithms
This Implementation: Raw agent scores and basic market metrics (RSI, ATR, volume ratio); minimal transformation
Impact: May miss subtle cross-feature interactions; relies on agent-level intelligence rather than feature combinations
8. Single-Instrument Data:
Full Implementation: Multi-asset correlation analysis (sector ETFs, currency pairs, volatility indices like VIX), lead-lag relationships, risk-on/risk-off regimes
This Implementation: Only OHLCV data from displayed instrument
Impact: Cannot incorporate broader market context; vulnerable to correlated moves across assets
9. Fixed Performance Horizon:
Full Implementation: Adaptive horizon based on trade duration, volatility regime, or profit target achievement
This Implementation: Fixed 8-bar evaluation window
Impact: May evaluate too early in slow markets or too late in fast markets; one-size-fits-all approach
Performance Impact Summary:
These simplifications make the script:
✅ Faster: Executes in milliseconds vs. seconds (or minutes) for full academic implementations
✅ More Accessible: Runs on any TradingView plan without external data feeds, APIs, or compute servers
✅ More Transparent: All calculations visible in Pine Script (no black-box compiled models)
✅ Lower Resource Usage: <500 bars lookback, minimal memory footprint
⚠️ Less Precise: Approximations may reduce statistical edge by 5-15% vs. academic implementations
⚠️ Limited Scope: Cannot capture tick-level dynamics, multi-order-book interactions, or cross-asset flows
⚠️ Fixed Parameters: Some thresholds hardcoded rather than dynamically optimized
When to Upgrade to Full Implementation:
Consider professional Python/C++ versions with institutional data feeds if:
Trading with >$100K capital where precision differences materially impact returns
Operating in microsecond-competitive environments (HFT, market making)
Requiring regulatory-grade audit trails and reproducibility
Backtesting with tick-level precision for strategy validation
Need true real-time adaptation with neural network-based learning
For retail swing/day trading and position management, these approximations provide sufficient signal quality while maintaining usability, transparency, and accessibility. The core logic—multi-agent detection with adaptive selection—remains intact.
Technical Notes
All calculations use standard Pine Script built-in functions ( ta.ema, ta.atr, ta.rsi, ta.bb, ta.sma, ta.stdev, ta.vwap )
VPIN and Kyle's Lambda use simplified formulas optimized for OHLCV data (see "Lite" section above)
Thompson Sampling uses pseudo-random noise from price/volume decimal digits for beta distribution sampling
No repainting: All calculations use confirmed bar data (no forward-looking)
Maximum lookback: 500 bars (set via max_bars_back parameter)
Performance evaluation: 8-bar forward-looking window for reward calculation (clearly disclosed)
Confidence threshold: Minimum 0.25 (25%) enforced on all signals
Memory arrays: Dynamic sizing with FIFO queue management
Limitations and Disclaimers
Not Predictive: This indicator identifies patterns in historical data. It cannot predict future price movements with certainty.
Requires Human Judgment: Signals are entry triggers, not complete trading strategies. Must be confirmed with your own analysis, risk management rules, and market context.
Learning Period Required: The adaptive system requires 50-100 bars minimum to build statistically meaningful performance data for bandit algorithms.
Overfitting Risk: Restoring memory parameters from one market regime to a drastically different regime (e.g., low volatility to high volatility) may cause poor initial performance until system re-adapts.
Approximation Limitations: Simplified calculations (see "Lite" section) may underperform academic implementations by 5-15% in highly efficient markets.
No Guarantee of Profit: Past performance, whether backtested or live-traded, does not guarantee future performance. All trading involves risk of loss.
Forward-Looking Bias: Performance evaluation uses 8-bar forward window—this creates slight look-ahead for learning (though not for signals). Real-time performance may differ from indicator's internal statistics.
Single-Instrument Limitation: Does not account for correlations with related assets or broader market regime changes.
Recommended Settings
Timeframe: 15-minute to 4-hour charts (sufficient volatility for ATR-based stops; adequate bar volume for learning)
Assets: Liquid instruments with >100k daily volume (forex majors, large-cap stocks, BTC/ETH, major indices)
Not Recommended: Illiquid small-caps, penny stocks, low-volume altcoins (microstructure metrics unreliable)
Complementary Tools: Volume profile, order book depth, market breadth indicators, fundamental catalysts
Position Sizing: Risk no more than 1-2% of capital per signal using ATR-based stop-loss
Signal Filtering: Consider external confluence (support/resistance, trendlines, round numbers, session opens)
Start With: Balanced mode, Thompson Sampling, Blend mode, default agent sensitivities (1.0)
After 30+ Signals: Review agent win rates, consider increasing sensitivity of top performers or locking to dominant agent
Alert Configuration
The script includes built-in alert conditions:
Long Signal: Fires when validated long entry confirmed
Short Signal: Fires when validated short entry confirmed
Alerts fire once per bar (after confirmation requirements met)
Set alert to "Once Per Bar Close" for reliability
Taking you to school. — Dskyz, Trade with insight. Trade with anticipation.

MTF EMA Trading SystemHere's a comprehensive description and usage guide for publishing your MTF EMA Trading System indicator on TradingView:
MTF EMA Trading System - Pro Edition
📊 Indicator Overview
The MTF EMA Trading System is an advanced multi-timeframe exponential moving average indicator designed for traders seeking high-probability setups with multiple confirmations. Unlike simple EMA crossover systems, this indicator combines trend alignment, momentum, volume analysis, and previous day confluence to generate reliable long and short signals with optimal risk-reward ratios.
✨ Key Features
1. Multi-Timeframe EMA Analysis
Configure 5 independent EMAs (default: 9, 21, 50, 100, 200)
Each EMA can pull data from ANY timeframe (5m, 15m, 1H, 4H, 1D, etc.)
Color-coded lines with customizable widths
End-of-line labels showing EMA period and timeframe (e.g., "EMA200 ")
Perfect for analyzing higher timeframe trends on lower timeframe charts
2. Advanced Signal Generation (Beyond Simple Crosses)
The system requires MULTIPLE confirmations before generating a signal:
LONG Signals Require:
✅ Price action trigger (EMA cross, bounce from key EMA, or pullback setup)
✅ Bullish EMA alignment (EMAs in proper ascending order)
✅ Volume spike confirmation (configurable threshold)
✅ RSI momentum confirmation (bullish but not overbought)
✅ Sufficient EMA separation (avoids choppy/whipsaw conditions)
✅ Price above previous day's low (confluence with support)
SHORT Signals Require:
✅ Price action trigger (EMA cross, rejection from key EMA, or pullback setup)
✅ Bearish EMA alignment (EMAs in proper descending order)
✅ Volume spike confirmation
✅ RSI momentum confirmation (bearish but not oversold)
✅ Sufficient EMA separation
✅ Price below previous day's high (confluence with resistance)
3. Real-Time Dashboard
Displays critical market conditions at a glance:
Overall trend direction (Bullish/Bearish/Neutral)
Price position relative to all EMAs
Volume status (spike or normal)
RSI momentum reading
EMA confluence strength
EMA separation quality
Current ATR value
Previous day high/low levels
Current signal status (LONG/SHORT/WAIT)
Risk-reward ratio
4. Clean Visual Design
Large, clear trade signal markers (green triangles for LONG, red triangles for SHORT)
No chart clutter - only essential information displayed
Customizable signal sizes
Professional color-coded dashboard
5. Built-In Risk Management
ATR-based calculations for stop loss placement
1:2 risk-reward ratio by default
All levels displayed in dashboard for easy reference
🎯 How to Use This Indicator
Step 1: Initial Setup
Add the indicator to your TradingView chart
Configure your preferred timeframes for each EMA:
EMA 9: Leave blank (uses chart timeframe) - Fast reaction to price
EMA 21: Leave blank or set to 15m - Key pivot level
EMA 50: Set to 1H - Intermediate trend
EMA 100: Set to 4H - Major trend filter
EMA 200: Set to 1D - Overall market bias
Adjust signal settings based on your trading style:
Conservative: Keep all confirmations enabled
Aggressive: Disable volume or momentum requirements
Scalping: Reduce min EMA separation to 0.2-0.3%
Step 2: Reading the Dashboard
Before taking any trade, check the dashboard:
Trend: Only take LONG signals in bullish trends, SHORT signals in bearish trends
Position: Confirm price is on the correct side of EMAs
Volume: Green spike = strong confirmation
RSI: Avoid extremes (>70 or <30)
Confluence: "Strong" = high probability setup
Separation: "Good" = trending market, avoid "Low" separation
Step 3: Trade Entry
For LONG Trades:
Wait for green triangle to appear below price
Verify dashboard shows:
Bullish or Neutral trend
Volume spike (preferred)
RSI between 50-70
Good separation
Enter at market or on next bar
Set stop loss at: Entry - (ATR × 2)
Set target at: Entry + (ATR × 4)
For SHORT Trades:
Wait for red triangle to appear above price
Verify dashboard shows:
Bearish or Neutral trend
Volume spike (preferred)
RSI between 30-50
Good separation
Enter at market or on next bar
Set stop loss at: Entry + (ATR × 2)
Set target at: Entry - (ATR × 4)
Step 4: Trade Management
Use the ATR values from dashboard for position sizing
Trail stops using the fastest EMA (EMA 9) as price moves in your favor
Exit partial position at 1:1 risk-reward, let remainder run to target
Exit immediately if dashboard trend changes against your position
💡 Best Practices
Timeframe Recommendations:
Scalping: 1m-5m chart with 5m, 15m, 1H, 4H, 1D EMAs
Day Trading: 5m-15m chart with 15m, 1H, 4H, 1D EMAs
Swing Trading: 1H-4H chart with 4H, 1D, 1W EMAs
Position Trading: 1D chart with 1D, 1W, 1M EMAs
Market Conditions:
Best in: Trending markets with clear direction
Avoid: Tight consolidation, low volume periods, major news events
Filter trades: Only take signals aligned with higher timeframe trend
Risk Management:
Never risk more than 1-2% per trade
Use ATR from dashboard to calculate position size
Respect the stop loss levels
Don't force trades when dashboard shows weak conditions
⚙️ Customization Options
EMA Settings (for each of 5 EMAs):
Length (period)
Timeframe (multi-timeframe capability)
Color
Line width
Show/hide toggle
Signal Settings:
Volume confirmation (on/off)
Volume spike threshold (1.0-3.0x)
Momentum confirmation (on/off)
RSI overbought/oversold levels
Minimum EMA separation percentage
ATR period and stop multiplier
Display Settings:
Show/hide EMA labels
Show/hide trade signals
Signal marker size (tiny/small/normal/large)
Show/hide dashboard
🔔 Alert Setup
The indicator includes 4 alert conditions:
LONG Signal - Fires when all long confirmations are met
SHORT Signal - Fires when all short confirmations are met
Bullish Setup - Early warning when trend aligns bullish with volume
Bearish Setup - Early warning when trend aligns bearish with volume
To set up alerts:
Right-click on chart → Add Alert
Select "MTF EMA Trading System"
Choose your desired alert condition
Configure notification method (popup, email, SMS, webhook)
📈 Performance Tips
Increase Win Rate:
Only trade in direction of higher timeframe trend
Wait for volume spike confirmation
Avoid trades during first 30 minutes and last 15 minutes of session
Skip trades when separation is "Low"
Reduce False Signals:
Increase minimum EMA separation to 0.7-1.0%
Enable all confirmation requirements
Only trade when confluence shows "Strong"
Combine with support/resistance levels
Optimize for Your Market:
Stocks: Use 9, 21, 50, 100, 200 EMAs
Forex: Consider 8, 13, 21, 55, 89 EMAs (Fibonacci)
Crypto: May need wider ATR multiplier (2.5-3.0x) for volatility
⚠️ Important Notes
This indicator is designed to reduce false signals by requiring multiple confirmations
No indicator is 100% accurate - always use proper risk management
Backtesting recommended before live trading
Market conditions change - adjust settings as needed
Works best in liquid markets with clear price action
🎓 Conclusion
The MTF EMA Trading System transforms simple moving average analysis into a sophisticated, multi-confirmation trading strategy. By combining trend alignment, momentum, volume, and confluence, it helps traders identify high-probability setups while filtering out noise and false signals. The clean interface and comprehensive dashboard make it suitable for both beginners and experienced traders across all markets and timeframes.

Uni VWAP + EMA ScalperFor backtesting by small group. It's intended to synch and provide visual and audible alerts.
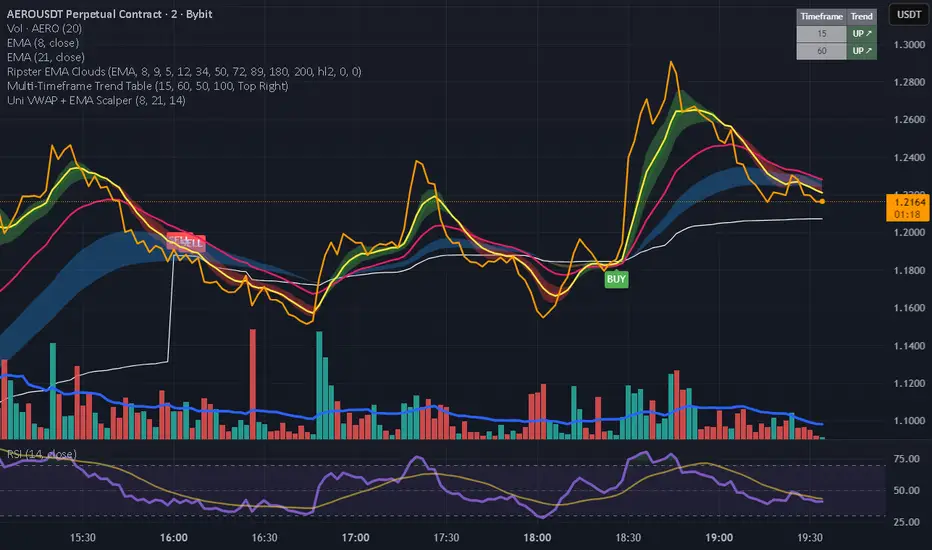
Trend Strength IndicatorThis is a Trend Strength Indicator that shows you the immediate trend and historical trend of price for up to 7 higher timeframes.
It shows the strength of each timeframe by showing a red or green dot based on where price is at compared to the previous higher timeframe candle. The brighter red or green the dot is, the stronger the trend is compared to that higher timeframe candle.
The colors and timeframes can be customized to suit your preference and you can also turn off as many timeframes as you’d like if you want less time frames to show up on the indicator.
It also includes alerts for when all timeframes are bullish or all timeframes are bearish.
Keep these timeframes set to higher time frames than your chart so you can trade in the direction of the overall higher timeframe trend.
Bullish Scoring & Colors
If the current candle close is above the midline of the higher time frame candle, it is given a score of 1 and a dark green dot. If the current candle close is above the higher timeframe candle body, then it is given a score of 2 and a medium green dot. If the current candle close is above the high of the higher time frame candle, it is given a score of 3 and a bright green dot.
The higher the score the stronger the bullish trend and the brighter green the dot will be.
Bearish Scoring & Colors
If the current candle close is below the midline of the higher timeframe candle, it is given a score of -1 and a dark red dot. If the current candle close is below the higher timeframe candle body, then it is given a score of -2 and a medium red dot. If the current candle close is below the low of the higher timeframe candle, it is given a score of -3 and a bright red dot.
The lower the score, the stronger the bearish trend and the brighter red the dot will be.
Trend Scoring Modes
We gave you the option to set the trend scoring mode to either score based on price above or below the midline for quick and easy trend identification, or using the midline, candle body and highs and lows to give you a more detailed view of the trend strength. You can switch between these modes by selecting your preferred mode in the settings panel. The default is Open, High, Low, Close + Midline.
Sending Trend Direction To External Indicators
We coded in the ability to use the trend strength score as a signal that you can use to filter other indicators. This feature is great for notifying signal generating indicators what direction the market is trending in so that the signal generating indicator only gives signals in the direction of the trend.
This feature works by providing a data output of 1, 0 or -1. 1 means the trend is bullish, 0 means the trend is neutral and -1 means the trend is bearish.
This score is calculated by using the score of each timeframe that is turned on and checking if all timeframes are in the same direction or not. So if 3 timeframes are turned on and they are all bullish, the indicator will provide a data output of 1. This tells your external indicators that the trend is bullish.
This data output can be found in the data window and is labeled Trend Direction To Send To External Indicators.
At the bottom of the settings panel, there is a setting called Trend Score Threshold For External Indicators. This setting is the score threshold that all timeframes will need to meet to allow a trend strength signal to go through. So if set to 1, then all timeframes must be scored 1 or higher for bullish or -1 or lower for bearish. If set to 2, then all timeframes must be 2 or higher for bullish or -2 or lower for bearish. If set to 3, then all timeframes must be 3 for bullish or -3 for bearish. If all timeframes have met this threshold, then a bullish or bearish signal can be sent to your external indicator as a trend filter.
Labels
There are labels to the right of each row of dots, telling you which timeframe is which so you can easily identify what timeframe each row is showing the trend for.
Alerts
You can set alerts for when all timeframes are bullish or when all timeframes are bearish. If you have some time frames turned off at the time of creating your alerts, then it will only require all timeframes that are on to be all bullish or bearish to generate an alert. Make sure to set your alerts to once per bar close to ensure you don’t get premature alerts that aren’t yet valid.
Backtesting
This indicator helps you quickly identify and backtest the trend direction, how strong that trend is on multiple timeframes and helps you spot reversals and trend continuations. Make sure you look back at a lot of historical data to see how price moves when trend changes take place and how well price continues in each direction compared to the overall trend. This will help you gain confidence in reading the indicator and using it to your advantage when trading.
Best Way To Use The Indicator
This indicator is designed to help you quickly identify the trend on various different timeframes. The brighter the green dots are, the stronger the bullish trend is. The brighter the red dots are, the stronger the bearish trend is.
Trade in the direction of the trend. If the colors are mixed green and red, then price is likely to chop back and forth, so only trade the extremes of the ranges when that happens.
When most of the lower timeframe dots are the same color, that means it is a strong trend and you should place trades in the direction of the trend to be safe. The lower timeframes will start trending before the higher timeframes, so take notice of the lower timeframe colors starting to agree with each other and then take advantage of the trend that is forming.
You can also spot reversals with this indicator by watching for the lower timeframes to start changing color after a strong trend in one direction. The lower timeframes will start to change color one by one, indicating that the trend is actually changing direction.
For best results, make sure you wait for the trend to show all bullish or all bearish at the same time before you place any trades. If you can be patient enough to do that, you will increase the probability of winning your trade because you are trading with the direction of the overall higher timeframe trend which is typically an easy way to win more trades. Of course wait for pullbacks during the trend so you can keep a tight stop loss after entering your trade.
If you are scalping, you can turn off the higher timeframes and just use the 1 hour through 1 day. This won’t be as reliable as using all timeframes and waiting for them to align, but it is suitable for scalping quick intraday movements.
Other Indicators To Pair This With
Use this in combination with our Higher Timeframe Candle Levels indicator so you can see all of these levels being used to calculate the trend strength scores and watch how price reacts to those levels. You should also use our Breakout Scanner to find other markets with strong trends so you always know which market is trending the strongest and can trade those. Trend Strength Indicator, Higher Timeframe Candle Levels and the Breakout Scanner all use the same levels and calculate the trend scores the same way so they are designed to work all together to help you quickly be able to read a chart and find what direction to trade in.
