Analyst Targets ProbabilityThis indicator calculates the probability of the current stock price reaching or exceeding the analyst-provided high, average, and low price targets within a one-year time horizon. It utilizes a geometric Brownian motion (GBM) model, a standard approach in financial modeling that assumes log-normal price distribution with constant volatility.
### Key Features:
- **Analyst Targets**: Automatically pulls the high, average, and low one-year price targets from TradingView's syminfo data.
- **Risk-Free Rate**: Fetched from the 1-year US Treasury yield (symbol: TVC:US01Y). Defaults to 4% if unavailable.
- **Dividend Yield**: Uses trailing twelve-month (TTM) dividends per share (DPS) from financial data, divided by current price. Defaults to 0% if unavailable.
- **Volatility**: Computed as annualized historical volatility based on 252 trading days of daily log returns. Falls back to a 20-day period if insufficient data, or defaults to 30% if still unavailable.
- **Probability Calculation**: Employs the barrier hitting probability formula under GBM:
- Drift (μ) = risk-free rate - dividend yield - (volatility² / 2)
- The formula for probability P of hitting target H from current price S₀ over time T is:
P = Φ(d₊) + (H / S₀)^p ⋅ Φ(d₋) for H > S₀ (or adjusted for H < S₀)
Where l = ln(max(H, S₀)/min(H, S₀)), ν = drift, p = -2ν / σ², d₊ = (-l + νT) / (σ√T), d₋ = (-l - νT) / (σ√T), and Φ is the standard normal CDF (approximated using a polynomial method for accuracy).
- **Output Display**: A table in the top-right corner shows each target type, its value, and the estimated probability (as a percentage). "N/A" appears if data is unavailable or calculations cannot proceed (e.g., zero volatility).
### Assumptions and Limitations:
- Assumes constant volatility and drift, no transaction costs, and continuous trading (real markets may deviate due to jumps, news events, or changing conditions).
- Probabilities are model-based estimates and not guarantees; they represent the likelihood under risk-neutral measure.
- Best suited for stocks with available analyst targets and historical data; may default to assumptions for less-liquid symbols.
- No user inputs required—fully automated using TradingView's data sources.
This script is provided under the Mozilla Public License 2.0. For educational and informational purposes only; not financial advice. Test on your charts and consider backtesting for validation.
Cari dalam skrip untuk "backtesting"

Triple Tap Sniper Triple Tap Sniper v3 – EMA Retest Precision System
Triple Tap Sniper is a precision trading tool built around the 21, 34, and 55 EMAs, designed to capture high-probability retests after EMA crosses. Instead of chasing the first breakout candle, the system waits for the first pullback into the EMA21 after a trend-confirming cross — the spot where professional traders often enter.
🔑 Core Logic
EMA Alignment → Trend defined by EMA21 > EMA34 > EMA55 (bullish) or EMA21 < EMA34 < EMA55 (bearish).
Cross Detection → Signals are only armed after a fresh EMA cross.
Retest Entry → Buy/Sell signals fire only on the first retest of EMA21, with trend still intact.
Pro Filters →
📊 Higher Timeframe Confirmation: Aligns signals with larger trend.
📈 ATR Volatility Filter: Blocks weak signals in low-vol chop.
📏 EMA Spread Filter: Ignores tiny “fake crosses.”
🕯️ Price Action Filter: Requires a proper wick rejection for valid entries.
🚀 Why Use Triple Tap Sniper?
✅ Filters out most false signals from sideways markets.
✅ Focuses only on clean trend continuations after pullbacks.
✅ Beginner-friendly visuals (Buy/Sell labels) + alert-ready for automation.
✅ Flexible: works across multiple timeframes & asset classes (stocks, crypto, forex).
⚠️ Notes
This is a signal indicator, not a full strategy. For backtesting and optimization, convert to a strategy and adjust filters per market/timeframe.
No indicator guarantees profits — use with sound risk management.

MA Availability ETA (SMA100/EMA200)This tool helps traders understand when long-term moving averages become available on any chosen timeframe.
Many new symbols, pairs, or timeframes don’t have enough price history to immediately plot long moving averages like SMA(100) and EMA(200). This script calculates and displays:
✅ Bars Remaining – how many bars are still needed before each moving average can be plotted reliably.
✅ ETA Duration – an estimate of how long (in chart time units) it will take until each MA is available.
✅ Status Table & Label – compact visual summary on the chart and in a table at the top-right corner.
✅ Vertical Marker – a dotted line showing exactly where both SMA(100) & EMA(200) first appear together.
✅ Alerts – optional alerts notify you the moment SMA(100) or EMA(200) become available.
🔑 Features
Works on any timeframe and instrument.
Highlights SMA(100) and EMA(200) on the chart for reference.
Lets you choose whether EMA(200) should be considered ready immediately, or only after a full 200-bar history.
Useful for traders who rely on long-term MA signals (golden cross, dynamic support/resistance, trend confirmation) and want to know when these tools will be ready on fresh charts.
🎯 Use Cases
New listings / low-history assets → See when SMA100 & EMA200 become usable.
Backtesting or forward-testing → Anticipate when long-term signals will first appear.
Trend-following strategies → Prepare in advance for crossovers or key support/resistance confluence zones.
⚠️ Note: ETAs are based on chart resolution and assume continuous data; real-world session gaps, weekends, or illiquid trading can make availability slightly later.
👉 Add this to your chart and you’ll always know when the big moving averages arrive — a critical moment for many upside moves and long-term strategies.
Swing Z | Zillennial Technologies Inc.Swing Z by Zillennial Technologies Inc. is an advanced algorithmic framework built specifically for cryptocurrency markets. It integrates multiple layers of technical analysis into a single decision-support tool, generating buy and sell signals only when several independent confirmations align.
Core Concept
Swing Z fuses trend structure, momentum oscillators, volatility signals, and price action tools to capture high-probability trading opportunities in volatile crypto environments.
Trend Structure (EMA 9, 21, 50, 200)
Short-term EMAs (9 & 21) detect immediate momentum shifts.
Longer-term EMAs (50 & 200) define the broader trend and dynamic support/resistance.
Momentum & Confirmation Layer
RSI measures relative strength and market conditions.
MACD crossovers confirm momentum shifts and trend continuations.
Volatility & Market Pressure
TTM Squeeze highlights compression zones likely to precede breakouts.
Volume analysis confirms conviction behind directional moves.
VWAP (Volume Weighted Average Price) establishes intraday value zones and institutional benchmarks.
Price Action Filters
Fibonacci retracements are integrated to identify key reversal and continuation levels.
Signals are produced only when multiple conditions agree, reducing noise and improving reliability in fast-moving crypto markets.
Features
Tailored for cryptocurrency trading across major pairs (BTC, ETH, and altcoins).
Works effectively on swing and trend-based timeframes (1H–1D).
Combines trend, momentum, volatility, and price action into a single framework.
Generates clear Buy/Sell markers and integrates with TradingView alerts.
How to Use
Apply to a clean chart for the clearest visualization.
Use Swing Z as a swing trading tool, aligning entries with both trend structure and momentum confirmation.
Combine with your own stop-loss, take-profit, and position sizing rules.
Avoid application on non-standard chart types such as Renko, Heikin Ashi, or Point & Figure, which may distort results.
Disclaimer
Swing Z is designed as a decision-support tool, not financial advice.
All backtesting should use realistic risk, commission, and slippage assumptions.
Past results do not guarantee future performance.
Signals do not repaint but may adjust as new data develops in real-time.
Why Swing Z is original & useful:
Swing Z unifies EMA trend structure, RSI, MACD, TTM Squeeze, VWAP, Fibonacci retracements, and volume analysis into a single algorithmic framework. This multi-confirmation approach improves accuracy by requiring consensus across trend, momentum, volatility, and price action — a design made specifically for the challenges and volatility of cryptocurrency markets.

Swing Z – Crypto Trading Algorithm | Zillennial Technologies IncSwing Z by Zillennial Technologies Inc. is an advanced algorithmic framework built specifically for cryptocurrency markets. It integrates multiple layers of technical analysis into a single decision-support tool, generating buy and sell signals only when several independent confirmations align.
Core Concept
Swing Z fuses trend structure, momentum oscillators, volatility signals, and price action tools to capture high-probability trading opportunities in volatile crypto environments.
Trend Structure (EMA 9, 21, 50, 200)
Short-term EMAs (9 & 21) detect immediate momentum shifts.
Longer-term EMAs (50 & 200) define the broader trend and dynamic support/resistance.
Momentum & Confirmation Layer
RSI measures relative strength and market conditions.
MACD crossovers confirm momentum shifts and trend continuations.
Volatility & Market Pressure
TTM Squeeze highlights compression zones likely to precede breakouts.
Volume analysis confirms conviction behind directional moves.
VWAP (Volume Weighted Average Price) establishes intraday value zones and institutional benchmarks.
Price Action Filters
Fibonacci retracements are integrated to identify key reversal and continuation levels.
Signals are produced only when multiple conditions agree, reducing noise and improving reliability in fast-moving crypto markets.
Features
Tailored for cryptocurrency trading across major pairs (BTC, ETH, and altcoins).
Works effectively on swing and trend-based timeframes (1H–1D).
Combines trend, momentum, volatility, and price action into a single framework.
Generates clear Buy/Sell markers and integrates with TradingView alerts.
How to Use
Apply to a clean chart for the clearest visualization.
Use Swing Z as a swing trading tool, aligning entries with both trend structure and momentum confirmation.
Combine with your own stop-loss, take-profit, and position sizing rules.
Avoid application on non-standard chart types such as Renko, Heikin Ashi, or Point & Figure, which may distort results.
Disclaimer
Swing Z is designed as a decision-support tool, not financial advice.
All backtesting should use realistic risk, commission, and slippage assumptions.
Past results do not guarantee future performance.
Signals do not repaint but may adjust as new data develops in real-time.
Why Swing Z is original & useful:
Swing Z unifies EMA trend structure, RSI, MACD, TTM Squeeze, VWAP, Fibonacci retracements, and volume analysis into a single algorithmic framework. This multi-confirmation approach improves accuracy by requiring consensus across trend, momentum, volatility, and price action — a design made specifically for the challenges and volatility of cryptocurrency markets.

Persistence# Persistence
## What it does
Measures **price change persistence**, defined as the percentage of bars within a lookback window that closed higher than the prior close. A high value means the instrument has been closing up frequently, which can indicate durable momentum. This mirrors Stockbee’s idea: *select stocks with high price change persistence*, and then combine **momentum plus persistence**.
## Can be used for scanning in PineScreener
## Calculation
* `isUp` is true when `close > close `.
* `countUp` counts true instances over the last `len` bars.
* `pctUp = 100 * countUp / len`, bounded between 0 and 100.
* A 50% level is a natural baseline. Above 50% suggests more up closes than down closes in the window.
## Inputs
* **Lookback bars (`len`)**: default 252 for roughly one trading year on a daily chart. On weekly charts use something like 52, on monthly charts use 12.
## How to use
1. **Screen for persistence**
Sort a watchlist by the plotted value, higher is better. Many momentum traders start looking above 58 to 65 percent, then layer a trend filter.
2. **Combine with momentum**
Examples, pick tickers with:
* `pctUp > 60`, and price above a rising EMA50 or EMA100.
* `pctUp rising` and weekly ROC positive.
3. **Switch timeframe to change the horizon**
* Daily chart with `len = 252` approximates one year.
* Weekly chart with `len = 52` approximates one year.
* Monthly chart with `len = 12` approximates one year.
## TC2000 equivalence
Stockbee’s TC2000 expression:
```
CountTrue(c > c1, 252)
```
## Interpretation guide
* **70 to 90**: very strong persistence; often trend leaders, check for extensions and risk controls.
* **60 to 70**: constructive persistence; good hunting ground for swing setups that also pass momentum filters.
* **50**: neutral baseline; around random up vs down frequency.
* **Below 50**: persistent weakness; consider only for mean reversion or short strategies.
## Practical tips
* **Event effects**: ex-dividend gaps can reduce persistence on high yield names. Earnings gaps can swing the value sharply.
* **Survivorship bias**: when backtesting on curated lists, persistence can look cleaner than in live scans.
* **Liquidity**: thin names may show noisy persistence due to erratic prints.
## Reference to Stockbee
* “One way to select stocks for swing trading is to find those with high price change persistence.”
* “Persistence can be calculated on a daily, monthly, or weekly timeframe.”
* TC2000 function: `CountTrue(c > c1, 252)`
* Example noted in the tweet: CVNA had very high one-year price persistence at the time of that post.
* Takeaway: **look for momentum plus persistence**, not persistence alone.

Cnagda Liquidit Trading SystemCnagda Liquidit Trading System helps spot where price is likely to trap traders and reverse, then gives simple, actionable Level to entry, place SL, and take profits with confidence. It blends imbalance zones, trend bias, order blocks, liquidity pools, high-probability fake Signal, and context-aware candle patterns into one clean workflow.
🟩🟥 Imbalance boxes: “Crowd rushed, gaps left”
What it is: Green/red boxes mark fast, one-sided moves where price “skipped” orders—think FVG-like zones that often get revisited.
Why it helps: Price frequently pulls back to “fill” these zones, creating clean retest entries with logical stops.
⏩How to use:
Green box = potential demand retest; Red box = potential supply retest. Enter on pullback into box, not on first impulse. Put stop on far side of box and aim first targets at recent swing points.
↕️ Swing bias (HH/HL vs LH/LL): “Which way is the road?”
What it is: Higher-highs/higher-lows = up-bias; Lower-highs/lower-lows = down-bias. system plots Buy/Sell OB levels aligned with that bias.
Why it helps: Trading with the broader flow reduces “hero trades” against institutions. Bias gives clearer entries and cleaner drawdowns.
⏩How to use:
Up-bias: look for long on Buy OB retests. Down-bias: look for short on Sell OB retests. Wait for a small rejection/engulfing to confirm before triggering.
🧱Order blocks: “Where big players remember”
What it is: last opposite-colored candle before an impulsive move—these zones often hold memory and reaction. system plots these as Buy/Sell OB lines.
Why it helps: Many breakouts pull back to the origin. Good entries often happen on retest, not on the breakout chase.
⏩ How to use:
Let price return into the OB, show wick rejection, and decent volume. Enter with stop beyond OB; define risk-reward before entry.
📊Volume coloring: “How Volume is move?”
What it is: Bar color reflects relative volume; inside bars are black. The dashboard also shows Volume and “Volume vs Prev.”
Why it helps: Patterns without volume often fade; volume validates strength and intent of moves.
⏩ How to use:
Favor entries where imbalance/OB/liquidity-grab coincide with higher volume. If volume is weak, reduce size or skip.
🧲 BSL/SSL liquidity pools: “Fishing for stops”
What it is: Equal highs cluster stops above (BSL); equal lows cluster stops below (SSL). system plots these and highlights the nearest one (“magnet”).
Why it helps: Price often sweeps these pools to trigger stops before reversing. This is a prime trap-reversal location.
⏩ How to use:
Watch nearest BSL/SSL. If price wicks through and closes back inside, anticipate a reversal. Trade reaction, not first poke. When price closes beyond, consider that pool mitigated and move on.
🟢🔴 Advanced liquidity grab: “Catch fakeout”
What it is: Bullish grab = makes a new low beyond a prior low but closes back above it, with a long lower wick, small body, and higher volume. Bearish is mirror. Labeled automatically.
Why it helps: It exposes trap moves (stop hunts) and often precedes true direction.
⏩ How to use:
Best when it aligns with a nearby imbalance/OB and supportive volume. Enter on reversal candle break or on retest. Stop goes beyond sweep wick.
🧠 Smart candlestick patterns (only in right place)
What it is: Engulfing, Hammer, Shooting Star, Hanging Man, Doji (with high volume), Morning/Evening Star, Piercing—but marked “effective” only if context (swing/trend/location) agrees.
Why it helps: same pattern in the wrong place is noise; in the right place, it’s signal.
⏩ How to use:
Location first (BSL/SSL/OB/imbalance), then pattern. Treat pattern as trigger/confirmation—one fresh label shows to keep chart clean.
🧭 Dashboard: “Context in a glance”
⏩ Reversal Level: current swing anchor—expect turns or reactions nearby; great for alerts and planning.
⏩ Volume vs Prev + Volume: Strength meter for signal candle—higher adds conviction.
⏩ Nearest Pool: next “magnet” area—look for sweeps/rejections there.
🧩Step-by-step trading flow (with mindset)
⏩ Set bias: HH/HL = long bias, LH/LL = short bias. Counter-trend only on clean sweeps with strong confirmation.
⏩ Find magnet: Check Nearest Pool (BSL/SSL). Focus attention there; it saves screen time.
⏩ Wait for event: Look for a sweep/grab label, or sharp rejection at pool/OB/imbalance. Avoid FOMO.
⏩ Add confluence: Stack 2–3 of these—imbalance box, OB, contextual pattern, supportive volume.
⏩Plan entry: Bullish: trigger above reversal candle high or take retest of FVG/OB. Stop below sweep wick/zone. Target at least 1:1.5–1:2.
Bearish: mirror above.
⏩Manage smartly: Take partials, move to breakeven or trail thoughtfully. Don’t drag stops inside zone out of emotion.
🎛️ Parameter tuning (to reduce human error)
⏩ swingLen: Smaller = faster but noisier; larger = cleaner but slower. Backtest first, then go live.
⏩ Tolerance (ATR or percent): ATR tolerance adapts to volatility (good for fast markets and lower TFs). Start around 0.15–0.30. In calm markets, try percent 0.05–0.15%.
⏩ minBarsGap: Start with 3–5 so equal highs/lows are truly equal—reduces false pools.
❌Common mistakes → ✅ Better habits
⏩Chasing every breakout → Wait for sweep/rejection, then confirm.
⏩Ignoring volume → Validate strength; cut size or skip on weak volume.
⏩Losing history of pools → If reviewing/backtesting, keep mitigated pools visible (dashed/faded).
⏩Over-tight tolerance/too small swingLen → Increases false signals; backtest to find balance.
📝 checklist (before entry)
⏩ Is there a nearby BSL/SSL and did a sweep/grab happen there?
⏩ Is there a close imbalance/OB that price can retest?
⏩ Do we have an effective pattern plus supportive volume?
⏩Is the stop beyond the wick/zone and RR ≥ 1:1.5?
•?((¯°·._.• 🎀 𝐻𝒶𝓅𝓅𝓎 𝒯𝓇𝒶𝒹𝒾𝓃𝑔 🎀 •._.·°¯((?•

Adaptive Valuation [BackQuant]Adaptive Valuation
What this is
A composite, zero-centered oscillator that standardizes several classic indicators and blends them into one “valuation” line. It computes RSI, CCI, Demarker, and the Price Zone Oscillator, converts each to a rolling z-score, then forms a weighted average. Optional smoothing, dynamic overbought and oversold bands, and an on-chart table make the inputs and the final score easy to inspect.
How it works
Components
• RSI with its own lookback.
• CCI with its own lookback.
• DM (Demarker) with its own lookback.
• PZO (Price Zone Oscillator) with its own lookback.
Standardization via z-score
Each component is transformed using a rolling z-score over lookback bars:
z = (value − mean) ÷ stdev , where the mean is an EMA and the stdev is rolling.
This puts all inputs on a comparable scale measured in standard deviations.
Weighted blend
The z-scores are combined with user weights w_rsi, w_cci, w_dm, w_pzo to produce a single valuation series. If desired, it is then smoothed with a selected moving average (SMA, EMA, WMA, HMA, RMA, DEMA, TEMA, LINREG, ALMA, T3). ALMA’s sigma input shapes its curve.
Dynamic thresholds (optional)
Two ways to set overbought and oversold:
• Static : fixed levels at ob_thres and os_thres .
• Dynamic : ±k·σ bands, where σ is the rolling standard deviation of the valuation over dynLen .
Bands can be centered at zero or around the valuation’s rolling mean ( centerZero ).
Visualization and UI
• Zero line at 0 with gradient fill that darkens as the valuation moves away from 0.
• Optional plotting of band lines and background highlights when OB or OS is active.
• Optional candle and background coloring driven by the valuation.
• Summary table showing each component’s current z-score, the final score, and a compact status.
How it can be used
• Bias filter : treat crosses above 0 as bullish bias and below 0 as bearish bias.
• Mean-reversion context : look for exhaustion when the valuation enters the OB or OS region, then watch for exits from those regions or a return toward 0.
• Signal confirmation : use the final score to confirm setups from structure or price action.
• Adaptive banding : with dynamic thresholds, OB and OS adjust to prevailing variability rather than relying on fixed lines.
• Component tuning : change weights to emphasize trend (raise DM, reduce RSI/CCI) or range behavior (raise RSI/CCI, reduce DM). PZO can help in swing environments.
Why z-score blending helps
Indicators often live on different scales. Z-scoring places them on a common, unitless axis, so a one-sigma move in RSI has comparable influence to a one-sigma move in CCI. This reduces scale bias and allows transparent weighting. It also facilitates regime-aware thresholds because the dynamic bands scale with recent dispersion.
Inputs to know
• Component lookbacks : rsilb, ccilb, dmlb, pzolb control each raw signal.
• Standardization window : lookback sets the z-score memory. Longer smooths, shorter reacts.
• Weights : w_rsi, w_cci, w_dm, w_pzo determine each component’s influence.
• Smoothing : maType, smoothP, sig govern optional post-blend smoothing.
• Dynamic bands : dyn_thres, dynLen, thres_k, centerZero configure the adaptive OB/OS logic.
• UI : toggle the plot, table, candle coloring, and threshold lines.
Reading the plot
• Above 0 : composite pressure is positive.
• Below 0 : composite pressure is negative.
• OB region : valuation above the chosen OB line. Risk of mean reversion rises and momentum continuation needs evidence.
• OS region : mirror logic on the downside.
• Band exits : leaving OB or OS can serve as a normalization cue.
Strengths
• Normalizes heterogeneous signals into one interpretable series.
• Adjustable component weights to match instrument behavior.
• Dynamic thresholds adapt to changing volatility and drift.
• Transparent diagnostics from the on-chart table.
• Flexible smoothing choices, including ALMA and T3.
Limitations and cautions
• Z-scores assume a reasonably stationary window. Sharp regime shifts can make recent bands unrepresentative.
• Highly correlated components can overweight the same effect. Consider adjusting weights to avoid double counting.
• More smoothing adds lag. Less smoothing adds noise.
• Dynamic bands recalibrate with dynLen ; if set too short, bands may swing excessively. If too long, bands can be slow to adapt.
Practical tuning tips
• Trending symbols: increase w_dm , use a modest smoother like EMA or T3, and use centerZero dynamic bands.
• Choppy symbols: increase w_rsi and w_cci , consider ALMA with a higher sigma , and widen bands with a larger thres_k .
• Multiday swing charts: lengthen lookback and dynLen to stabilize the scale.
• Lower timeframes: shorten component lookbacks slightly and reduce smoothing to keep signals timely.
Alerts
• Enter and exit of Overbought and Oversold, based on the active band choice.
• Bullish and bearish zero crosses.
Use alerts as prompts to review context rather than as stand-alone trade commands.
Final Remarks
We created this to show people a different way of making indicators & trading.
You can process normal indicators in multiple ways to enhance or change the signal, especially with this you can utilise machine learning to optimise the weights, then trade accordingly.
All of the different components were selected to give some sort of signal, its made out of simple components yet is effective. As long as the user calibrates it to their Trading/ investing style you can find good results. Do not use anything standalone, ensure you are backtesting and creating a proper system.

EMA 1/8 Cross - Fixed Pip TP/SLEMA 1/8 Cross – Fixed Pip TP/SL
This strategy is based on the crossover between EMA 8 and EMA 14 as trading signals:
Long entry → when EMA 1 crosses above EMA 8
Short entry → when EMA 1 crosses below EMA 8
Features:
Fixed pip Take Profit (TP) and Stop Loss (SL), fully adjustable in the settings.
Customizable EMA Fast/Slow lengths for optimization.
Pip size input to match different broker definitions (e.g., XAUUSD often uses 0.10 as one pip).
Suitable for testing scalping or swing trading across multiple timeframes.
⚠️ Disclaimer:
This script is intended for backtesting and educational purposes only. Please optimize parameters and apply proper risk management before using it on live accounts.

AltCoin & MemeCoin Index Correlation [Eddie_Bitcoin]🧠 Philosophy of the Strategy
The AltCoin & MemeCoin Index Correlation Strategy by Eddie_Bitcoin is a carefully engineered trend-following system built specifically for the highly volatile and sentiment-driven world of altcoins and memecoins.
This strategy recognizes that crypto markets—especially niche sectors like memecoins—are not only influenced by individual price action but also by the relative strength or weakness of their broader sector. Hence, it attempts to improve the reliability of trading signals by requiring alignment between a specific coin’s trend and its sector-wide index trend.
Rather than treating each crypto asset in isolation, this strategy dynamically incorporates real-time dominance metrics from custom indices (OTHERS.D and MEME.D) and combines them with local price action through dual exponential moving average (EMA) crossovers. Only when both the asset and its sector are moving in the same direction does it allow for trade entries—making it a confluence-based system rather than a single-signal strategy.
It supports risk-aware capital allocation, partial exits, configurable stop loss and take profit levels, and a scalable equity-compounding model.
✅ Why did I choose OTHERS.D and MEME.D as reference indices?
I selected OTHERS.D and MEME.D because they offer a sector-focused view of crypto market dynamics, especially relevant when trading altcoins and memecoins.
🔹 OTHERS.D tracks the market dominance of all cryptocurrencies outside the top 10 by market cap.
This excludes not only BTC and ETH, but also major stablecoins like USDT and USDC, making it a cleaner indicator of risk appetite across true altcoins.
🔹 This is particularly useful for detecting "Altcoin Season"—periods where capital rotates away from Bitcoin and flows into smaller-cap coins.
A rising OTHERS.D often signals the start of broader altcoin rallies.
🔹 MEME.D, on the other hand, captures the speculative behavior of memecoin segments, which are often driven by retail hype and social media activity.
It's perfect for timing momentum shifts in high-risk, high-reward tokens.
By using these indices, the strategy aligns entries with broader sector trends, filtering out noise and increasing the probability of catching true directional moves, especially in phases of capital rotation and altcoin risk-on behavior.
📐 How It Works — Core Logic and Execution Model
At its heart, this strategy employs dual EMA crossover detection—one pair for the asset being traded and one pair for the selected market index.
A trade is only executed when both EMA crossovers agree on the direction. For example:
Long Entry: Coin's fast EMA > slow EMA and Index's fast EMA > slow EMA
Short Entry: Coin's fast EMA < slow EMA and Index's fast EMA < slow EMA
You can disable the index filter and trade solely based on the asset’s trend just to make a comparison and see if improves a classic EMA crossover strategy.
Additionally, the strategy includes:
- Adaptive position sizing, based on fixed capital or current equity (compound mode)
- Take Profit and Stop Loss in percentage terms
- Smart partial exits when trend momentum fades
- Date filtering for precise backtesting over specific timeframes
- Real-time performance stats, equity tracking, and visual cues on chart
⚙️ Parameters & Customization
🔁 EMA Settings
Each EMA pair is customizable:
Coin Fast EMA: Default = 47
Coin Slow EMA: Default = 50
Index Fast EMA: Default = 47
Index Slow EMA: Default = 50
These control the sensitivity of the trend detection. A wider spread gives smoother, slower entries; a narrower spread makes it more responsive.
🧭 Index Reference
The correlation mechanism uses CryptoCap sector dominance indexes:
OTHERS.D: Dominance of all coins EXCLUDING Top 10 ones
MEME.D: Dominance of all Meme coins
These are dynamically calculated using:
OTHERS_D = OTHERS_cap / TOTAL_cap * 100
MEME_D = MEME_cap / TOTAL_cap * 100
You can select:
Reference Index: OTHERS.D or MEME.D
Or disable the index reference completely (Don't Use Index Reference)
💰 Position Sizing & Risk Management
Two capital allocation models are supported:
- Fixed % of initial capital (default)
- Compound profits, which scales positions as equity grows
Settings:
- Compound profits?: true/false
- % of equity: Between 1% and 200% (default = 10%)
This is critical for users who want to balance growth with risk.
🎯 Take Profit / Stop Loss
Customizable thresholds determine automatic exits:
- TakeProfit: Default = 99999 (disabled)
- StopLoss: Default = 5 (%)
These exits are percentage-based and operate off the entry price vs. current close.
📉 Trend Weakening Exit (Scale Out)
If the position is in profit but the trend weakens (e.g., EMA color signals trend loss), the strategy can partially close a configurable portion of the position:
- Scale Position on Weak Trend?: true/false
- Scaled Percentage: % to close (default = 65%)
This feature is useful for preserving profits without exiting completely.
📆 Date Filter
Useful for segmenting performance over specific timeframes (e.g., bull vs bear markets):
- Filter Date Range of Backtest: ON/OFF
- Start Date and End Date: Custom time range
OTHER PARAMETERS EXPLANATION (Strategy "Properties" Tab):
- Initial Capital is set to 100 USD
- Commission is set to 0.055% (The ones I have on Bybit)
- Slippage is set to 3 ticks
- Margin (short and long) are set to 0.001% to avoid "overspending" your initial capital allocation
📊 Visual Feedback and Debug Tools
📈 EMA Trend Visualization
The slow EMA line is dynamically color-coded to visually display the alignment between the asset trend and the index trend:
Lime: Coin and index both bullish
Teal: Only coin bullish
Maroon: Only index bullish
Red: Both bearish
This allows for immediate visual confirmation of current trend strength.
💬 Real-Time PnL Labels
When a trade closes, a label shows:
Previous trade return in % (first value is the effective PL)
Green background for profit, Red for losses.
📑 Summary Table Overlay
This table appears in a corner of the chart (user-defined) and shows live performance data including:
Trade direction (yellow long, purple short)
Emojis: 💚 for current profit, 😡 for current loss
Total number of trades
Win rate
Max drawdown
Duration in days
Current trade profit/loss (absolute and %)
Cumulative PnL (absolute and %)
APR (Annualized Percentage Return)
Each metric is color-coded:
Green for strong results
Yellow/orange for average
Red/maroon for poor performance
You can select where this appears:
Top Left
Top Right
Bottom Left
Bottom Right (default)
📚 Interpretation of Key Metrics
Equity Multiplier: How many times initial capital has grown (e.g., “1.75x”)
Net Profit: Total gains including open positions
Max Drawdown: Largest peak-to-valley drop in strategy equity
APR: Annualized return calculated based on equity growth and days elapsed
Win Rate: % of profitable trades
PnL %: Percentage profit on the most recent trade
🧠 Advanced Logic & Safety Features
🛑 “Don’t Re-Enter” Filter
If a trade is closed due to StopLoss without a confirmed reversal, the strategy avoids re-entering in that same direction until conditions improve. This prevents false reversals and repetitive losses in sideways markets.
🧷 Equity Protection
No new trades are initiated if equity falls below initial_capital / 30. This avoids overleveraging or continuing to trade when capital preservation is critical.
Keep in mind that past results in no way guarantee future performance.
Eddie Bitcoin

MK_OSFT-Multi-Timeframe MA Dashboard & Smart Alerts-v2📊 Multi-Timeframe MA Dashboard & Smart Alerts v2.0
Transform your trading with the ultimate moving average monitoring system that tracks up to 8 different MA configurations across multiple timeframes simultaneously.
🎯 What This Indicator Does
This advanced dashboard eliminates the need to constantly switch between timeframes by displaying all your critical moving averages on a single chart. Whether you're scalping on 5-minute charts or swing trading on daily timeframes, you'll instantly see the big picture.
⭐ Key Features
📈 Multi-Timeframe Moving Averages
Monitor up to **8 different MA configurations** simultaneously
Support for **SMA and EMA** across 6 timeframes (5m, 15m, 1h, 4h, Daily, Weekly)
Each MA fully customizable: length, color, alert settings, and visibility
Smart visual representation with labeled horizontal lines and connecting plots
🚨 Intelligent Alert System
Cross-over/Cross-under alerts for price vs MA interactions
Three alert modes : No alerts, Once only, or Once per bar close
Smart batching system prevents alert spam during volatile periods
Queue management with 3-second delays between alerts for optimal performance
Easy alert reset functionality for "once only" alerts
📊 Real-Time Information Dashboard
Live countdown timers showing time remaining until each timeframe closes
Color-coded progress bars with gradient visualization (green → yellow → orange → red)
Instant cross-over detection with up/down arrow indicators
Price vs MA relationship clearly displayed (above/below coloring)
🎨 Professional Visualization
Anti-overlap technology prevents labels from clustering
Customizable label positioning and sizing options
Drawing order control (larger timeframes first/last)
Connecting lines link current price to MA values
Status line integration for quick value reference
💡 Perfect For
Multi-timeframe traders [/b who need complete market context
Trend followers monitoring key MA levels across timeframes
Breakout traders waiting for price to cross critical moving averages
Risk managers using MAs as dynamic support/resistance levels
Anyone wanting organized, clutter-free MA monitoring
⚙️ Highly Configurable
Moving Average Settings
Individual enable/disable for each of 8 MA slots
Flexible timeframe selection : 5m, 15m, 1h, 4h, Daily, Weekly
MA type choice : SMA or EMA for each configuration
Custom lengths from 1 to any desired period
Color customization for each MA line and label
Alert Management
Per-MA alert configuration : Choose which MAs trigger alerts
Source selection : Current bar vs last confirmed bar calculations
Frequency control : Prevent over-alerting with smart queuing
Reset functionality : Easily reactivate "fired" once-only alerts
Display Options
Table positioning : Top-right, bottom-left, or bottom-right
Label styling : Size, offset, and gap control
Line customization : Width and extension options
Timezone adjustment : Align timestamps with your local time
🔧 Technical Excellence
Optimized performance with efficient array management and single-pass calculations
Real-time vs historical mode handling for accurate backtesting
Memory-efficient label and line management prevents accumulation
Robust error handling and edge case management
Clean, well-documented code following Pine Script best practices
📋 How to Use
Add to chart and configure your desired MA combinations
Set alert preferences for each MA (none/once/per bar)
Create TradingView alert using "Any alert() function calls"
Monitor the dashboard for cross-over signals and timeframe progress
Use the info table to track all MA values and alert statuses at a glance
🎓 Educational Value
This indicator serves as an excellent educational tool for understanding:
Multi-timeframe analysis principles
Moving average confluence and divergence
Alert system design and management
Professional indicator development techniques
---
Transform your trading workflow with this professional-grade multi-timeframe MA monitoring system. No more chart hopping - get the complete moving average picture in one powerful dashboard!
© MK_OSF_TRADING | Pine Script v6 | Mozilla Public License 2.0

Script_Algo - ORB Strategy with Filters🔍 Core Concept: This strategy combines three powerful technical analysis tools: Range Breakout, the SuperTrend indicator, and a volume filter. Additionally, it features precise customization of the number of candles used to construct the breakout range, enabling optimized performance for specific assets.
🎯 How It Works:
The strategy defines a trading range at the beginning of the trading session based on a selected number of candles.
It waits for a breakout above the upper or below the lower boundary of this range, requiring a candle close.
It filters signals using the SuperTrend indicator for trend confirmation.
It utilizes trading volume to filter out false breakouts.
⚡ Strategy Features
📈 Entry Points:
Long: Candle close above the upper range boundary + SuperTrend confirmation
Short: Candle close below the lower range boundary + SuperTrend confirmation
🛡️ Risk Management:
Stop-Loss: Set at the opposite range boundary.
Take-Profit: Calculated based on a risk/reward ratio (3:1 by default).
Position Size: 10 contracts (configurable).
⚠️ IMPORTANT SETTINGS
🕐 Time Parameters:
Set the correct time and time zone!
❕ATTENTION: The strategy works ONLY with correct time settings! Set the time corresponding to your location and trading session.
📊 This strategy is optimized for trading TESLA stock!
Parameters are tailored to TESLA's volatility, and trading volumes are adequate for signal filtering. Trading time corresponds to the American session.
📈 If you look at the backtesting results, you can see that the strategy could potentially have generated about 70 percent profit on Tesla stock over six months on 5m timeframe. However, this does not guarantee that results will be repeated in the future; remain vigilant.
⚠️ For other assets, the following is required:
Testing and parameter optimization
Adjustment of time intervals and the number of candles forming the range
Calibration of stop-loss and take-profit levels
⚠️ Limitations and Drawbacks
🔗 Automation Constraints:
❌ Cannot be directly connected via Webhook to CFD brokers!
Additional IT solutions are required for automation, thus only manual trading based on signals is possible.
📉 Risk Management:
Do not risk more than 2-3% of your account per trade.
Test on historical data before live use.
Start with a demo account.
💪 Strategy Advantages
✅ Combined approach – multiple signal filters
✅ Clear entry and exit rules
✅ Visual signals on the chart
✅ Volume-based false breakout filtering
✅ Automatic position management
🎯 Usage Recommendations
Always test the strategy on historical data.
Start with small trading volumes.
Ensure time settings are correct.
Adapt parameters to current market volatility.
Use only for stocks – futures and Forex require adaptation.
📚 Suitable Timeframes - M1-M15
Only highly liquid stocks
🍀 I wish all subscribers good luck in trading and steady profits!
📈 May your charts move in the right direction!
⚠️ Remember: Trading involves risk. Do not invest money you cannot afford to lose!

All Weekly Opens + Week LabelThis script plots every Weekly Open (WO) across the entire chart, making it easy for traders to backtest how price reacts to weekly opens historically.
Each weekly open is drawn as a horizontal line and labeled with the month abbreviation and the week number of that month (e.g., WO Aug-4). This allows traders to quickly identify where each weekly session started and analyze market behavior around these key reference levels.
How it works
The script detects the first bar of each new week and records its opening price.
A horizontal line is drawn at that price, extending to the right.
An optional label shows the week name in the format Month-WeekNumber.
Traders can enable or disable labels, change line colors, line width, and optionally display the opening price in the label.
A new input allows filtering to show only the last N months of Weekly Opens. By default, all weekly opens are displayed, but traders can limit the chart to just the most recent ones for a cleaner view.
Why it’s useful
Weekly opens are often respected levels in both intraday and swing trading. They provide natural reference points for:
Backtesting market reactions to session opens.
Identifying areas of support/resistance around weekly levels.
Aligning trade entries and exits with higher-timeframe context.
Simplifying charts by focusing only on the most relevant recent weeks.
Notes
This indicator is not a trading signal generator.
It should be used as a contextual tool for analysis, helping traders improve risk management and entry precision.
Works on all symbols and timeframes.
The “last N months” filter is optional; setting it to 0 will plot all Weekly Opens available in the chart’s history.
Scalping Line Strategy📌 Scalping Line Strategy – A Precision Crossover System
🔎 Overview
The Scalping Line Strategy is a short-term trading system built around the concept of momentum-driven crossovers between a smoothed moving average filter and a fast signal line. It is designed for scalpers and intraday traders who seek clear entry signals, minimal lag, and adaptive filtering to fit volatile market conditions.
At its core, the strategy uses a custom signal line ("Scalping Line"), which is derived from the difference between a double-smoothed moving average and a shorter-period signal line. Trade entries are triggered when this Scalping Line crosses above or below zero, providing a clean and rules-based framework for both long and short setups.
⚙️ Core Logic
Main Trend Filter – A double-smoothed moving average is calculated over a configurable period (default 100). This reduces noise and provides a more robust backbone for scalping signals.
Percent-Based Filter – To avoid false signals, a customizable percentage filter adjusts how closely the system “respects” price deviations from the moving average. This helps filter out insignificant fluctuations.
Signal Line – A shorter-period simple moving average (default 7) provides faster responsiveness to recent price action.
Scalping Line (SLI) – Calculated as the difference between the fast signal line and the smoothed moving average. When the SLI crosses zero, it signals a potential momentum shift.
SLI > 0 → Momentum bias is bullish.
SLI < 0 → Momentum bias is bearish.
🎯 Trade Direction & Flexibility
Trade Direction Control:
Choose between Long Only, Short Only, or Both to tailor the system to your trading style.
Signal Flip Option:
By default, long entries occur when the SLI crosses below zero, and shorts when it crosses above zero. This orientation can be flipped, allowing for alternative interpretations of the signals depending on how you want to capture momentum in your market.
🕒 Time Window Filtering
For intraday traders, a time filter can be enabled to restrict signals to specific trading sessions (e.g., 9 AM – 4 PM EST). This is particularly useful when trading assets such as equities or futures that have strong intraday volatility windows.
📈 Visuals & Clarity
Scalping Line Plot: Displayed as a dynamic oscillator around a zero baseline.
Histogram Fill: Green when above zero (bullish bias), red when below zero (bearish bias).
Signal Markers: Clear arrows mark long and short entries at crossover points.
Zero Line Reference: A flat gray line at zero assists in visually gauging momentum shifts.
🚀 Strategy Execution
Long Entry: Triggered when SLI crosses below zero (or above zero if flip is enabled) within allowed session hours.
Short Entry: Triggered when SLI crosses above zero (or below zero if flip is enabled) within allowed session hours.
Built-in Signal Cancels: Pending entries are canceled if conditions are no longer valid, ensuring no stale trades remain active.
✅ Best Use Cases
Markets: Works across equities, forex, crypto, and futures with sufficient intraday volatility.
Timeframes: Most effective on 1m to 15m charts for scalping setups, but adaptable to higher frames for swing trading.
Style: Traders who appreciate simple, rules-based momentum crossovers will find this system easy to follow and highly adaptable.
⚠️ Risk Management Note
This strategy is strictly an entry signal framework. Position sizing, stop-loss, and take-profit rules must be overlaid based on your risk management style. Always validate results with backtesting and forward testing before applying to live trading accounts.
📜 Final Thoughts
The Scalping Line Strategy offers a refined, easy-to-interpret approach to intraday trading. By combining smoothed moving averages, adaptive filtering, and flexible signal options, it helps traders identify short-term momentum shifts with clarity and confidence, making it a highly configurable tool for scalping-focused strategies.

FlowStateTrader FlowState Trader - Advanced Time-Filtered Strategy
## Overview
FlowState Trader is a sophisticated algorithmic trading strategy that combines precision entry signals with intelligent time-based filtering and adaptive risk management. Built for traders seeking to achieve their optimal performance state, FlowState identifies high-probability trading opportunities within user-defined time windows while employing dynamic trailing stops and partial position management.
## Core Strategy Philosophy
FlowState Trader operates on the principle that peak trading performance occurs when three elements align: **Focus** (precise entry signals), **Flow** (optimal time windows), and **State** (intelligent position management). This strategy excels at finding reversal opportunities at key support and resistance levels while filtering out suboptimal trading periods to keep traders in their optimal flow state.
## Key Features
### 🎯 Focus Entry System
**Support/Resistance Zone Trading**:
- Dynamic identification of key price levels using configurable lookback periods
- Entry signals triggered when price interacts with these critical zones
- Volume confirmation ensures genuine breakout/reversal momentum
- Trend filter alignment prevents counter-trend disasters
**Entry Conditions**:
- **Long Signals**: Price closes above support buffer, touches support level, with above-average volume
- **Short Signals**: Price closes below resistance buffer, touches resistance level, with above-average volume
- Optional trend filter using EMA or SMA for directional bias confirmation
### ⏰ FlowState Time Filtering System
**Comprehensive Time Controls**:
- **12-Hour Format Trading Windows**: User-friendly AM/PM time selection
- **Multi-Timezone Support**: UTC, EST, PST, CST with automatic conversion
- **Day-of-Week Filtering**: Trade only weekdays, weekends, or both
- **Lunch Hour Avoidance**: Automatically skips low-volume lunch periods (12-1 PM)
- **Visual Time Indicators**: Background coloring shows active/inactive trading periods
**Smart Time Features**:
- Handles overnight trading sessions seamlessly
- Prevents trades during historically poor performance periods
- Customizable trading hours for different market sessions
- Real-time trading window status in dashboard
### 🛡️ Adaptive Risk Management
**Multi-Level Take Profit System**:
- **TP1**: First profit target with optional partial position closure
- **TP2**: Final profit target for remaining position
- **Flexible Scaling**: Choose number of contracts to close at each level
**Dynamic Trailing Stop Technology**:
- **Three Operating Modes**:
- **Conservative**: Earlier activation, tighter trailing (protect profits)
- **Balanced**: Optimal risk/reward balance (recommended)
- **Aggressive**: Later activation, wider trailing (let winners run)
- **ATR-Based Calculations**: Adapts to current market volatility
- **Automatic Activation**: Engages when position reaches profitability threshold
### 📊 Intelligent Position Sizing
**Contract-Based Management**:
- Configurable entry quantity (1-1000 contracts)
- Partial close quantities for profit-taking
- Clear position tracking and P&L monitoring
- Real-time position status updates
### 🎨 Professional Visualization
**Enhanced Chart Elements**:
- **Entry Zone Highlighting**: Clear visual identification of trading opportunities
- **Dynamic Risk/Reward Lines**: Real-time TP and SL levels with price labels
- **Trailing Stop Visualization**: Live tracking of adaptive stop levels
- **Support/Resistance Lines**: Key level identification
- **Time Window Background**: Visual confirmation of active trading periods
**Dual Dashboard System**:
- **Strategy Dashboard**: Real-time position info, settings status, and current levels
- **Performance Scorecard**: Live P&L tracking, win rates, and trade statistics
- **Customizable Sizing**: Small, Medium, or Large display options
### ⚙️ Comprehensive Customization
**Core Strategy Settings**:
- **Lookback Period**: Support/resistance calculation period (5-100 bars)
- **ATR Configuration**: Period and multipliers for stops/targets
- **Reward-to-Risk Ratios**: Customizable profit target calculations
- **Trend Filter Options**: EMA/SMA selection with adjustable periods
**Time Filter Controls**:
- **Trading Hours**: Start/end times in 12-hour format
- **Timezone Selection**: Four major timezone options
- **Day Restrictions**: Weekend-only, weekday-only, or unrestricted
- **Session Management**: Lunch hour avoidance and custom periods
**Risk Management Options**:
- **Trailing Stop Modes**: Conservative/Balanced/Aggressive presets
- **Partial Close Settings**: Enable/disable with custom quantities
- **Alert System**: Comprehensive notifications for all trade events
### 📈 Performance Tracking
**Real-Time Metrics**:
- Net profit/loss calculation
- Win rate percentage
- Profit factor analysis
- Maximum drawdown tracking
- Total trade count and breakdown
- Current position P&L
**Trade Analytics**:
- Winner/loser ratio tracking
- Real-time performance scorecard
- Strategy effectiveness monitoring
- Risk-adjusted return metrics
### 🔔 Alert System
**Comprehensive Notifications**:
- Entry signal alerts with price and quantity
- Take profit level hits (TP1 and TP2)
- Stop loss activations
- Trailing stop engagements
- Position closure notifications
## Strategy Logic Deep Dive
### Entry Signal Generation
The strategy identifies high-probability reversal points by combining multiple confirmation factors:
1. **Price Action**: Looks for price interaction with key support/resistance levels
2. **Volume Confirmation**: Ensures sufficient market interest and liquidity
3. **Trend Alignment**: Optional filter prevents counter-trend positions
4. **Time Validation**: Only trades during user-defined optimal periods
5. **Zone Analysis**: Entry occurs within calculated buffer zones around key levels
### Risk Management Philosophy
FlowState Trader employs a three-tier risk management approach:
1. **Initial Protection**: ATR-based stop losses set at strategy entry
2. **Profit Preservation**: Trailing stops activate once position becomes profitable
3. **Scaled Exit**: Partial profit-taking allows for both security and potential
### Time-Based Edge
The time filtering system recognizes that not all trading hours are equal:
- Avoids low-volume, high-spread periods
- Focuses on optimal liquidity windows
- Prevents trading during news events (lunch hours)
- Allows customization for different market sessions
## Best Practices and Optimization
### Recommended Settings
**For Scalping (1-5 minute charts)**:
- Lookback Period: 10-20
- ATR Period: 14
- Trailing Stop: Conservative mode
- Time Filter: Major session hours only
**For Day Trading (15-60 minute charts)**:
- Lookback Period: 20-30
- ATR Period: 14-21
- Trailing Stop: Balanced mode
- Time Filter: Extended trading hours
**For Swing Trading (4H+ charts)**:
- Lookback Period: 30-50
- ATR Period: 21+
- Trailing Stop: Aggressive mode
- Time Filter: Disabled or very broad
### Market Compatibility
- **Forex**: Excellent for major pairs during active sessions
- **Stocks**: Ideal for liquid stocks during market hours
- **Futures**: Perfect for index and commodity futures
- **Crypto**: Effective on major cryptocurrencies (24/7 capability)
### Risk Considerations
- **Market Conditions**: Performance varies with volatility regimes
- **Timeframe Selection**: Lower timeframes require tighter risk management
- **Position Sizing**: Never risk more than 1-2% of account per trade
- **Backtesting**: Always test on historical data before live implementation
## Educational Value
FlowState serves as an excellent learning tool for:
- Understanding support/resistance trading
- Learning proper time-based filtering
- Mastering trailing stop techniques
- Developing systematic trading approaches
- Risk management best practices
## Disclaimer
This strategy is for educational and informational purposes only. Past performance does not guarantee future results. Trading involves substantial risk of loss and is not suitable for all investors. Users should thoroughly backtest the strategy and understand all risks before live trading. Always use proper position sizing and never risk more than you can afford to lose.
---
*FlowState Trader represents the evolution of systematic trading - combining classical technical analysis with modern risk management and intelligent time filtering to help traders achieve their optimal performance state through systematic, disciplined execution.*

Trading Rules Panel BJTRADESFXA Simple Panel for Your Trading Rules
Trading can quickly get overwhelming if you’re juggling multiple strategies, indicators, and market conditions. A simple Trading Rules Panel on your chart helps you stay disciplined by keeping your strategy visible at all times. Instead of relying on memory or flipping through notes, the panel displays your personal trading checklist right where you need it — on your screen.
The panel can be customized to show:
✅ Entry conditions (e.g., trend direction, candle patterns, breakout levels)
✅ Exit rules (take profit, stop loss, or trailing stop logic)
✅ Risk management (lot size, max risk %, reward-to-risk ratio)
✅ Trading session reminders (only trade London/New York overlap, etc.)
✅ Personal rules (no revenge trading, stop after 2 losses, follow your plan)
This kind of panel doesn’t place trades for you; rather, it acts as a visual reminder to keep you consistent and accountable. It prevents emotional decisions and reinforces your discipline, especially during high-pressure moments.
A well-placed panel can also:
Reduce mistakes caused by forgetting steps
Keep your focus on the bigger picture
Improve backtesting and journaling since your rules are clearly visible
Help new traders stick to structure instead of chasing trades

Imbalance RSI Divergence Strategy# Imbalance RSI Divergence Strategy - User Guide
## What is This Strategy?
This strategy identifies **imbalance** zones in the market and combines them with **RSI divergence** to generate trading signals. It aims to capitalize on price gaps left by institutional investors and large volume movements.
### Main Settings
- **RSI Period (14)**: Period used for RSI calculation. Lower values = more sensitive, higher values = more stable signals.
- **ATR Period (10)**: Period for volatility measurement using Average True Range.
- **ATR Stop Loss Multiplier (2.0)**: How many ATR units to use for stop loss calculation.
- **Risk:Reward Ratio (4.0)**: Risk-reward ratio. 2.0 = 2 units of reward for 1 unit of risk.
- **Use RSI Divergence Filter (true)**: Enables/disables the RSI divergence filter.
### Imbalance Filters
- **Minimum Imbalance Size (ATR) (0.3)**: Minimum imbalance size in ATR units to filter out small imbalances.
- **Enable Lookback Limit (false)**: Activates historical lookback limitations.
- **Maximum Lookback Bars (300)**: Maximum number of bars to look back.
### Visual Settings
- **Show Imbalance Size**: Displays imbalance size in ATR units.
- **Show RSI Divergence Lines**: Shows/hides divergence lines.
- **Divergence Line Colors**: Colors for bullish/bearish divergence lines.
### Volatility-Based Adjustments
- **Low volatility markets**:
- Minimum Imbalance Size: 0.2-0.4 ATR
- ATR Stop Loss Multiplier: 1.5-2.0
- **High volatility markets**:
- Minimum Imbalance Size: 0.5-1.0 ATR
- ATR Stop Loss Multiplier: 2.5-3.5
### Risk Tolerance
- **Conservative approach**:
- Risk:Reward Ratio: 2.0-3.0
- RSI Divergence Filter: Enabled
- Minimum Imbalance Size: Higher (0.5+ ATR)
- **Aggressive approach**:
- Risk:Reward Ratio: 4.0-6.0
- Minimum Imbalance Size: Lower (0.2-0.3 ATR)
###Market Conditions
- **Trending markets**: Higher RSI Period (21-28)
- **Sideways markets**: Lower RSI Period (10-14)
- **Volatile markets**: Higher ATR Multiplier
## Recommended Testing Procedure
1. **Start with default settings** and backtest on 3-6 months of historical data
2. **Adjust RSI Period** to see which value produces better results
3. **Optimize ATR Multiplier** for stop loss levels
4. **Test different Risk:Reward ratios** comparatively
5. **Fine-tune Minimum Imbalance Size** to improve signal quality
## Important Considerations
- **False positive signals**: Imbalances may be less reliable during low volatility periods
- **Market openings**: First hours often produce more imbalances but can be riskier
- **News events**: Consider disabling strategy during major news releases
- **Backtesting**: Test across different market conditions (trending, sideways, volatile)
## Recommended Settings for Beginners
**Safe settings for new users:**
- RSI Period: 14
- ATR Period: 14
- ATR Stop Loss Multiplier: 2.5
- Risk:Reward Ratio: 3.0
- Minimum Imbalance Size: 0.5 ATR
- RSI Divergence Filter: Enabled
## Advanced Tips
### Signal Quality Improvement
- **Combine with market structure**: Look for imbalances near key support/resistance levels
- **Volume confirmation**: Higher volume during imbalance formation increases reliability
- **Multiple timeframe analysis**: Confirm signals on higher timeframes
### Risk Management
- **Position sizing**: Never risk more than 1-2% of account per trade
- **Maximum drawdown**: Set overall stop loss for the strategy
- **Market hours**: Consider avoiding low liquidity periods
### Performance Monitoring
- **Win rate**: Track percentage of profitable trades
- **Average R:R**: Monitor actual risk-reward achieved vs. target
- **Maximum consecutive losses**: Set alerts for strategy review
This strategy works best when combined with proper risk management and market analysis. Always backtest thoroughly before using real money and adjust parameters based on your specific market and trading style.

Advanced Volume Profile Pro Delta + POC + VAH/VAL# Advanced Volume Profile Pro - Delta + POC + VAH/VAL Analysis System
## WHAT THIS SCRIPT DOES
This script creates a comprehensive volume profile analysis system that combines traditional volume-at-price distribution with delta volume calculations, Point of Control (POC) identification, and Value Area (VAH/VAL) analysis. Unlike standard volume indicators that show only total volume over time, this script analyzes volume distribution across price levels and estimates buying vs selling pressure using multiple calculation methods to provide deeper market structure insights.
## WHY THIS COMBINATION IS ORIGINAL AND USEFUL
**The Problem Solved:** Traditional volume indicators show when volume occurs but not where price finds acceptance or rejection. Standalone volume profiles lack directional bias information, while basic delta calculations don't provide structural context. Traders need to understand both volume distribution AND directional sentiment at key price levels.
**The Solution:** This script implements an integrated approach that:
- Maps volume distribution across price levels using configurable row density
- Estimates delta (buying vs selling pressure) using three different methodologies
- Identifies Point of Control (highest volume price level) for key support/resistance
- Calculates Value Area boundaries where 70% of volume traded
- Provides real-time alerts for key level interactions and volume imbalances
**Unique Features:**
1. **Developing POC Visualization**: Real-time tracking of Point of Control migration throughout the session via blue dotted trail, revealing institutional accumulation/distribution patterns before they complete
2. **Multi-Method Delta Calculation**: Price Action-based, Bid/Ask estimation, and Cumulative methods for different market conditions
3. **Adaptive Timeframe System**: Auto-adjusts calculation parameters based on chart timeframe for optimal performance
4. **Flexible Profile Types**: N Bars Back (precise control), Days Back (calendar-based), and Session-based analysis modes
5. **Advanced Imbalance Detection**: Identifies and highlights significant buying/selling imbalances with configurable thresholds
6. **Comprehensive Alert System**: Monitors POC touches, Value Area entry/exit, and major volume imbalances
## HOW THE SCRIPT WORKS TECHNICALLY
### Core Volume Profile Methodology:
**1. Price Level Distribution:**
- Divides price range into user-defined rows (10-50 configurable)
- Calculates row height: `(Highest Price - Lowest Price) / Number of Rows`
- Distributes each bar's volume across price levels it touched proportionally
**2. Delta Volume Calculation Methods:**
**Price Action Method:**
```
Price Range = High - Low
Buy Pressure = (Close - Low) / Price Range
Sell Pressure = (High - Close) / Price Range
Buy Volume = Total Volume × Buy Pressure
Sell Volume = Total Volume × Sell Pressure
Delta = Buy Volume - Sell Volume
```
**Bid/Ask Estimation Method:**
```
Average Price = (High + Low + Close) / 3
Buy Volume = Close > Average ? Volume × 0.6 : Volume × 0.4
Sell Volume = Total Volume - Buy Volume
```
**Cumulative Method:**
```
Buy Volume = Close > Open ? Volume : Volume × 0.3
Sell Volume = Close ≤ Open ? Volume : Volume × 0.3
```
**3. Point of Control (POC) Identification:**
- Scans all price levels to find maximum volume concentration
- POC represents the price level with highest trading activity
- Acts as significant support/resistance level
- **Developing POC Feature**: Tracks POC evolution in real-time via blue dotted trail, showing how institutional interest migrates throughout the session. Upward POC migration indicates accumulation patterns, downward migration suggests distribution, providing early trend signals before price confirmation.
**4. Value Area Calculation:**
- Starts from POC and expands up/down to encompass 70% of total volume
- VAH (Value Area High): Upper boundary of value area
- VAL (Value Area Low): Lower boundary of value area
- Expansion algorithm prioritizes direction with higher volume
**5. Adaptive Range Selection:**
Based on profile type and timeframe optimization:
- **N Bars Back**: Fixed lookback period with performance optimization (20-500 bars)
- **Days Back**: Calendar-based analysis with automatic timeframe adjustment (1-365 days)
- **Session**: Current trading session or custom session times
### Performance Optimization Features:
- **Sampling Algorithm**: Reduces calculation load on large datasets while maintaining accuracy
- **Memory Management**: Clears previous drawings to prevent performance degradation
- **Safety Constraints**: Prevents excessive memory usage with configurable limits
## HOW TO USE THIS SCRIPT
### Initial Setup:
1. **Profile Configuration**: Select profile type based on trading style:
- N Bars Back: Precise control over data range
- Days Back: Intuitive calendar-based analysis
- Session: Real-time session development
2. **Row Density**: Set number of rows (30 default) - more rows = higher resolution, slower performance
3. **Delta Method**: Choose calculation method based on market type:
- Price Action: Best for trending markets
- Bid/Ask Estimate: Good for ranging markets
- Cumulative: Smoothed approach for volatile markets
4. **Visual Settings**: Configure colors, position (left/right), and display options
### Reading the Profile:
**Volume Bars:**
- **Length**: Represents relative volume at that price level
- **Color**: Green = net buying pressure, Red = net selling pressure
- **Intensity**: Darker colors indicate volume imbalances above threshold
**Key Levels:**
- **POC (Blue Line)**: Highest volume price - major support/resistance
- **VAH (Purple Dashed)**: Value Area High - upper boundary of fair value
- **VAL (Orange Dashed)**: Value Area Low - lower boundary of fair value
- **Value Area Fill**: Shaded region showing main trading range
**Developing POC Trail:**
- **Blue Dotted Lines**: Show real-time POC evolution throughout the session
- **Migration Patterns**: Upward trail indicates bullish accumulation, downward trail suggests bearish distribution
- **Early Signals**: POC movement often precedes price movement, providing advance warning of institutional activity
- **Institutional Footprints**: Reveals where smart money concentrated volume before final POC establishment
### Trading Applications:
**Support/Resistance Analysis:**
- POC acts as magnetic price level - expect reactions
- VAH/VAL provide intermediate support/resistance levels
- Profile edges show areas of low volume acceptance
**Developing POC Analysis:**
- **Upward Migration**: POC moving higher = institutional accumulation, bullish bias
- **Downward Migration**: POC moving lower = institutional distribution, bearish bias
- **Stable POC**: Tight clustering = balanced market, range-bound conditions
- **Early Trend Detection**: POC direction change often precedes price breakouts
**Entry Strategies:**
- Buy at VAL with POC as target (in uptrends)
- Sell at VAH with POC as target (in downtrends)
- Breakout plays above/below profile extremes
**Volume Imbalance Trading:**
- Strong buying imbalance (>60% threshold) suggests continued upward pressure
- Strong selling imbalance suggests continued downward pressure
- Imbalances near key levels provide high-probability setups
**Multi-Timeframe Context:**
- Use higher timeframe profiles for major levels
- Lower timeframe profiles for precise entries
- Session profiles for intraday trading structure
## SCRIPT SETTINGS EXPLANATION
### Volume Profile Settings:
- **Profile Type**: Determines data range for calculation
- N Bars Back: Exact number of bars (20-500 range)
- Days Back: Calendar days with timeframe adaptation (1-365 days)
- Session: Trading session-based (intraday focus)
- **Number of Rows**: Profile resolution (10-50 range)
- **Profile Width**: Visual width as chart percentage (10-50%)
- **Value Area %**: Volume percentage for VA calculation (50-90%, 70% standard)
- **Auto-Adjust**: Automatically optimizes for different timeframes
### Delta Volume Settings:
- **Show Delta Volume**: Enable/disable delta calculations
- **Delta Calculation Method**: Choose methodology based on market conditions
- **Highlight Imbalances**: Visual emphasis for significant volume imbalances
- **Imbalance Threshold**: Percentage for imbalance detection (50-90%)
### Session Settings:
- **Session Type**: Daily, Weekly, Monthly, or Custom periods
- **Custom Session Time**: Define specific trading hours
- **Previous Sessions**: Number of historical sessions to display
### Days Back Settings:
- **Lookback Days**: Number of calendar days to analyze (1-365)
- **Automatic Calculation**: Script automatically converts days to bars based on timeframe:
- Intraday: Accounts for 6.5 trading hours per day
- Daily: 1 bar per day
- Weekly/Monthly: Proportional adjustment
### N Bars Back Settings:
- **Lookback Bars**: Exact number of bars to analyze (20-500)
- **Precise Control**: Best for systematic analysis and backtesting
### Visual Customization:
- **Colors**: Bullish (green), Bearish (red), and level colors
- **Profile Position**: Left or Right side of chart
- **Profile Offset**: Distance from current price action
- **Labels**: Show/hide level labels and values
- **Smooth Profile Bars**: Enhanced visual appearance
### Alert Configuration:
- **POC Touch**: Alerts when price interacts with Point of Control
- **VA Entry/Exit**: Alerts for Value Area boundary interactions
- **Major Imbalance**: Alerts for significant volume imbalances
## VISUAL FEATURES
### Profile Display:
- **Horizontal Bars**: Volume distribution across price levels
- **Color Coding**: Delta-based coloring for directional bias
- **Smooth Rendering**: Optional smoothing for cleaner appearance
- **Transparency**: Configurable opacity for chart readability
### Level Lines:
- **POC**: Solid blue line with optional label
- **VAH/VAL**: Dashed colored lines with value displays
- **Extension**: Lines extend across relevant time periods
- **Value Area Fill**: Optional shaded region between VAH/VAL
### Information Table:
- **Current Values**: Real-time POC, VAH, VAL prices
- **VA Range**: Value Area width calculation
- **Positioning**: Multiple table positions available
- **Text Sizing**: Adjustable for different screen sizes
## IMPORTANT USAGE NOTES
**Realistic Expectations:**
- Volume profile analysis provides structural context, not trading signals
- Delta calculations are estimations based on price action, not actual order flow
- Past volume distribution does not guarantee future price behavior
- Combine with other analysis methods for comprehensive market view
**Best Practices:**
- Use appropriate profile types for your trading style:
- Day Trading: Session or Days Back (1-5 days)
- Swing Trading: Days Back (10-30 days) or N Bars Back
- Position Trading: Days Back (60-180 days)
- Consider market context (trending vs ranging conditions)
- Verify key levels with additional technical analysis
- Monitor profile development for changing market structure
**Performance Considerations:**
- Higher row counts increase calculation complexity
- Large lookback periods may affect chart performance
- Auto-adjust feature optimizes for most use cases
- Consider using session profiles for intraday efficiency
**Limitations:**
- Delta calculations are estimations, not actual transaction data
- Profile accuracy depends on available price/volume history
- Effectiveness varies across different instruments and market conditions
- Requires understanding of volume profile concepts for optimal use
**Data Requirements:**
- Requires volume data for accurate calculations
- Works best on liquid instruments with consistent volume
- May be less effective on very low volume or exotic instruments
This script serves as a comprehensive volume analysis tool for traders who need detailed market structure information with integrated directional bias analysis and real-time POC development tracking for informed trading decisions.

Indicador Millo SMA20-SMA200-AO-RSI M1This indicator is designed for scalping in 1-minute timeframes on crypto pairs, combining trend direction, momentum, and oscillator confirmation.
Logic:
Trend Filter:
Only BUY signals when price is above the SMA200.
Only SELL signals when price is below the SMA200.
Entry Trigger:
BUY: Price crosses above the SMA20.
SELL: Price crosses below the SMA20.
Confirmation Window:
After the price cross, the Awesome Oscillator (AO) must cross the zero line in the same direction within a maximum of N bars (configurable, default = 4).
RSI must be > 50 for BUY and < 50 for SELL at the moment AO confirms.
Cooldown:
A cooldown period (configurable, default = 10 bars) prevents multiple signals of the same type in a short time, reducing noise in sideways markets.
Features:
Works on any crypto pair and can be used in other markets.
Adjustable confirmation window, RSI threshold, and cooldown.
Alerts ready for BUY and SELL conditions.
Can be converted into a strategy for backtesting with TP/SL.
Suggested Use:
Pair: BTC/USDT M1 or similar high-liquidity asset.
Combine with manual support/resistance or higher timeframe trend analysis.
Recommended to confirm entries visually and with additional confluence before trading live.

Wickless Tap Signals Wickless Tap Signals — TradingView Indicator (v6)
A precision signal-only tool that marks BUY/SELL events when price “retests” the base of a very strong impulse candle (no wick on the retest side) in the direction of trend.
What it does (in plain English)
Finds powerful impulse candles:
Bull case: a green candle with no lower wick (its open ≈ low).
Bear case: a red candle with no upper wick (its open ≈ high).
Confirms trend with an EMA filter:
Only looks for bullish bases while price is above the EMA.
Only looks for bearish bases while price is below the EMA.
Waits for the retest (“tap”):
Later, if price revisits the base of that wickless candle
Bullish: taps the candle’s low/open → BUY signal
Bearish: taps the candle’s high/open → SELL signal
Optional level “consumption” so each base can trigger one signal, not many.
The idea: a wickless impulse often marks strong initiative order flow. The first retest of that base frequently acts as a springboard (bull) or ceiling (bear).
Exact rules (formal)
Let tick = syminfo.mintick, tol = tapTicks * tick.
Trend filter
inUp = close > EMA(lenEMA)
inDn = close < EMA(lenEMA)
Wickless impulse candles (confirmed on bar close)
Bullish wickless: close > open and abs(low - open) ≤ tol
Bearish wickless: close < open and abs(high - open) ≤ tol
When such a candle closes with trend alignment:
Store bullTapLevel = low (for bull case) and its bar index.
Store bearTapLevel = high (for bear case) and its bar index.
Signals (must happen on a later bar than the origin)
BUY: low ≤ bullTapLevel + tol and inUp and bar_index > bullBarIdx
SELL: high ≥ bearTapLevel - tol and inDn and bar_index > bearBarIdx
One-shot option
If enabled, once a signal fires, the stored level is cleared so it won’t trigger again.
Inputs (Settings)
Trend EMA Length (lenEMA): Default 200.
Use 50–100 for intraday, 200 for swing/position.
Tap Tolerance (ticks) (tapTicks): Default 1.
Helps account for tiny feed discrepancies. Set 0 for strict equality.
One Signal per Level (oneShot): Default ON.
If OFF, multiple taps can create multiple signals.
Plot Tap Levels (plotLevels): Draws horizontal lines at active bases.
Show Pattern Labels (showLabels): Marks the origin wickless candles.
Plots & Visuals
EMA trend line for context.
Tap Levels:
Green line at bullish base (origin candle’s low/open).
Red line at bearish base (origin candle’s high/open).
Signals:
BUY: triangle-up below the bar on the tap.
SELL: triangle-down above the bar on the tap.
Labels (optional):
Marks the original wickless impulse candle that created each level.
Alerts
Two alert conditions are built in:
“BUY Signal” — fires when a bullish tap occurs.
“SELL Signal” — fires when a bearish tap occurs.
How to set:
Add the indicator to your chart.
Click Alerts (⏰) → Condition = this indicator.
Choose BUY Signal or SELL Signal.
Set your alert frequency and delivery method.
Recommended usage
Timeframes: Works on any; start with 5–15m intraday, or 1H–1D for swing.
Markets: Equities, futures, FX, crypto. For thin/illiquid assets, consider a slightly larger Tap Tolerance.
Confluence ideas (optional, but helpful):
Higher-timeframe trend agreeing with your chart timeframe.
Volume surge on the origin wickless candle.
S/R, order blocks, or SMC structures near the tap level.
Avoid major news moments when slippage is high.
No-repaint behavior
Origin patterns are detected only on bar close (barstate.isconfirmed), so bases are created with confirmed data.
Signals come after the origin bar, on subsequent taps.
There is no lookahead; lines and shapes reflect information known at the time.
(As with all real-time indicators, an intrabar tap can trigger an alert during the live bar; the signal then remains if that condition held at bar close.)
Known limitations & design choices
Single active level per side: The script tracks only the most recent bullish base and most recent bearish base.
Want a queue of multiple simultaneous bases? That’s possible with arrays; ask and we’ll extend it.
Heikin Ashi / non-standard candles: Wick definitions change; for consistent behavior use regular OHLC candles.
Gaps: On large gaps, taps can occur instantly at the open. Consider one-shot ON to avoid rapid repeats.
This is an indicator, not a strategy: It does not place trades or compute PnL. For backtesting, we can convert it into a strategy with SL/TP logic (ATR or structure-based).
Practical tips
Tap Tolerance:
If you miss obvious taps by a hair, increase to 1–2 ticks.
For FX/crypto with tiny ticks, even 0 or 1 is often enough.
EMA length:
Shorten for faster signals; lengthen for cleaner trend selection.
Risk management (manual suggestion):
For BUY signals, consider a stop slightly below the tap level (or ATR-based).
For SELL signals, consider a stop slightly above the tap level.
Scale out or trail using structure or ATR.
Quick checklist
✅ Price above EMA → watch for a green no-lower-wick candle → store its low → BUY on tap.
✅ Price below EMA → watch for a red no-upper-wick candle → store its high → SELL on tap.
✅ Use Tap Tolerance to avoid missing precise touches by one tick.
✅ Consider One Signal per Level to keep trades uncluttered.
FAQ
Q: Why did I not get a signal even though price touched the level?
A: Check Tap Tolerance (maybe too strict), trend alignment at the tap bar, and that the tap happened after the origin candle. Also confirm you’re on regular candles.
Q: Can I see multiple bases at once?
A: This version tracks the latest bull and bear bases. We can extend to arrays to keep N recent bases per side.
Q: Will it repaint?
A: No. Bases form on confirmed closes, and signals only on later bars.
Q: Can I backtest it?
A: This is a study. Ask for the strategy variant and we’ll add entries, exits, SL/TP, and stats.

Trading bot gridsGuide: Price Lines – Arithmetic vs. Geometric
This script draws horizontal price lines (grids) between a start price and an end price.
You can choose whether the lines are distributed evenly (arithmetic) or by percentage (geometric).
🔧 Inputs
Start Price → Lower or upper boundary of the price range.
End Price → Opposite boundary of the price range.
Number of Lines → Total number of lines to be drawn between the start and end prices.
Distribution →
Arithmetic: Fixed USDT distance between each line.
Geometric: Fixed percentage distance between each line.
Grid Color → Color of the drawn lines.
📈 How it Works
The script calculates the lower (lo) and upper (hi) boundaries, regardless of which is entered first.
Arithmetic distribution: Each line is spaced by a fixed amount in USDT.
Geometric distribution: Each line is spaced by the same percentage difference from the previous one.
Lines are created only once at the first bar and remain on the chart.
All lines are extended across the entire visible chart.
💡 Tips
Useful for Grid Bot backtesting or visualizing price zones.
Works for both long and short price ranges.
In geometric mode, lines appear closer together near the lower price range and farther apart toward the upper range.

Engulfing Pattern[SpeculationLab]Overview
This script detects two types of engulfing / outer bar patterns and marks them directly on the chart:
Body Engulfing – The current candle’s body range (open–close) completely covers the entire range (high–low) of the previous candle.
Range Engulfing – The current candle’s full range (high–low, including wicks) completely covers the entire range (high–low) of the previous candle.
Direction logic:
Bull – The previous candle is bearish and the selected engulfing rule is met.
Bear – The previous candle is bullish and the selected engulfing rule is met.
Optional: Require the current candle to have the opposite color of the previous one.
This is an open-source pattern recognition tool for learning, backtesting, and chart review. It is not financial advice.
Key Features
Two detection modes:
body – Body engulfs previous entire range
range – Wicks engulf previous entire range
Direction detection based on the previous candle’s color, with optional opposite-color confirmation
Chart markers: “BULL” /“BEAR” above bars
Alert-ready: built-in conditions for bullish and bearish engulfing patterns
Parameters
Engulfing Type: body / range
body: Current body must fully cover the previous candle’s high–low range
range: Current full range (high–low) must fully cover the previous candle’s high–low range
Require Opposite Previous Candle (default: off):
When enabled, the engulfing pattern must also have the opposite color from the previous candle to trigger
Usage Tips
Engulfing patterns are price action structures; combine with trend, key levels, and volume for context
Signals confirm on bar close (barstate.isconfirmed) to reduce repainting
Can be used with personal risk management rules (stop-loss, take-profit, filters)
Disclaimer
For educational and research purposes only – not financial advice
Past performance of patterns does not guarantee future results
Trading involves risk; always manage it responsibly
This script is open-source – feel free to learn from or modify it, but credit the original source and author (SpeculationLab)
脚本简介
本脚本用于识别两类包裹/外包形态,并在图表上以标记提示:
Body(实体包裹):当前K线的实体区间(开—收)完全覆盖上一根K线的整个区间(上一根的高—低)。
Range(影线外包):当前K线的影线区间(高—低)完全覆盖上一根K线的整个区间(上一根的高—低)。
方向判定:
Bull(多):上一根为阴线且满足所选包裹规则;
Bear(空):上一根为阳线且满足所选包裹规则;
可选项:要求“当前K线颜色与上一根相反”后再确认(见参数)。
本脚本为开源形态识别工具,适合技术分析学习、回测与复盘,不构成任何投资建议。
主要功能
两种识别模式:body(实体包裹上一根整段) / range(影线包裹上一根整段)。
方向识别:按上一根K线颜色判断多空;可选“当前颜色与上一根相反”的二次确认。
图表提示:plotshape 在K线上方标注 “BULL / BEAR”。
提醒支持:内置 Bullish Engulf / Bearish Engulf 提醒条件。
参数说明
Engulfing Type:body / range
body:当前实体须完全覆盖上一根的高—低整段;
range:当前高—低须完全覆盖上一根的高—低整段。
Require Opposite Previous Candle(默认关闭):
开启后,除满足包裹规则外,还需当前K线颜色与上一根相反才触发标记。
使用建议
包裹/外包是价格行为结构,建议结合趋势、关键价位、成交量等因素综合判断。
信号在收盘时确认(barstate.isconfirmed),以减少重绘干扰。
可与个人风格的风险控制规则(止损、止盈、过滤条件)配合使用。
合规与免责声明
本脚本仅用于技术研究与学习,不构成任何形式的投资建议或收益承诺。
历史形态并不代表未来结果,交易有风险,请自行评估并承担责任。
本脚本开源,欢迎学习与二次开发;转载或改用请注明来源与作者(SpeculationLab / 投机实验室)。
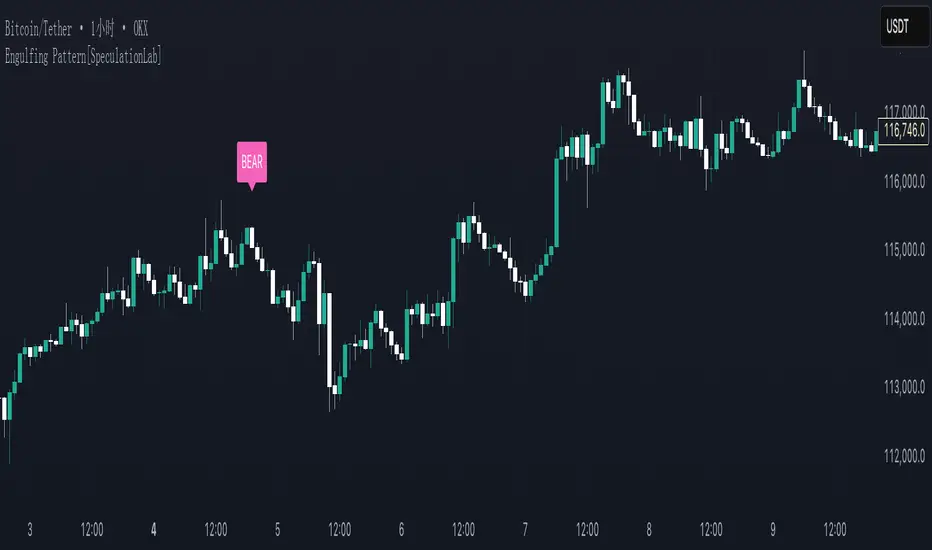
Intraday Volume Pulse GSK-VIZAG-AP-INDIAIntraday Volume Pulse Indicator
Overview
This indicator is designed to track and visualize intraday volume dynamics during a user-defined trading session. It calculates and displays key volume metrics such as buy volume, sell volume, cumulative delta (difference between buy and sell volumes), and total volume. The data is presented in a customizable table overlay on the chart, making it easy to monitor volume pulses throughout the session. This can help traders identify buying or selling pressure in real-time, particularly useful for intraday strategies.
The indicator resets its calculations at the start of each new day and only accumulates volume data from the specified session start time onward. It uses simple logic to classify volume as buy or sell based on candle direction:
Buy Volume: Assigned to green (up) candles or half of neutral (doji) candles.
Sell Volume: Assigned to red (down) candles or half of neutral (doji) candles.
All calculations are approximate and based on available volume data from the chart. This script does not incorporate external data sources, order flow, or tick-level information—it's purely derived from standard OHLCV (Open, High, Low, Close, Volume) bars.
Key Features
Session Customization: Define the start time of your trading session (e.g., market open) and select from common timezones like Asia/Kolkata, America/New_York, etc.
Volume Metrics:
Buy Volume: Total volume attributed to bullish activity.
Sell Volume: Total volume attributed to bearish activity.
Cumulative Delta: Net difference (Buy - Sell), highlighting overall market bias.
Total Volume: Sum of all volume during the session.
Formatted Display: Volumes are formatted for readability (e.g., in thousands "K", lakhs "L", or crores "Cr" for large numbers).
Color-Coded Table: Uses a patriotic color scheme inspired by general themes (Saffron, White, Green) with dynamic backgrounds based on positive/negative values for quick visual interpretation.
Table Options: Toggle visibility and position (top-right, top-left, etc.) for a clean chart layout.
How to Use
Add to Chart: Apply this indicator to any symbol's chart (works best on intraday timeframes like 1-min, 5-min, or 15-min).
Configure Inputs:
Session Start Hour/Minute: Set to your market's open time (default: 9:15 for Indian markets).
Timezone: Choose the appropriate timezone to align with your trading hours.
Show Table: Enable/disable the metrics table.
Table Position: Place the table where it doesn't obstruct your view.
Interpret the Table:
Monitor for spikes in buy/sell volume or shifts in cumulative delta.
Positive delta (green) suggests buying pressure; negative (red) suggests selling.
Use alongside price action or other indicators for confirmation—e.g., high total volume with positive delta could indicate bullish momentum.
Limitations:
Volume classification is heuristic and not based on actual order flow (e.g., it splits doji volume evenly).
Data accumulation starts from the session time and resets daily; historical backtesting may be limited by the max_bars_back=500 setting.
This is for educational and visualization purposes only—do not use as sole basis for trading decisions.
Calculation Details
Session Filter: Uses timestamp() to define the session start and filters bars with time >= sessionStart.
New Day Detection: Resets volumes on daily changes via ta.change(time("D")).
Volume Assignment:
Buy: Full volume if close > open; half if close == open.
Sell: Full volume if close < open; half if close == open.
Cumulative Metrics: Accumulated only during the session.
Formatting: Custom function f_format() scales large numbers for brevity.
Disclaimer
This script is for educational and informational purposes only. It does not provide financial advice or signals to buy/sell any security. Always perform your own analysis and consult a qualified financial professional before making trading decisions.
© 2025 GSK-VIZAG-AP-INDIA
