Sunmool's NY Lunch Model BacktestingICT NY Lunch Model Backtesting (12:00–13:00 NY) 🗽🍔
This research indicator tests an ICT narrative using the New York lunch window (12:00–13:00 America/New_York). It records that hour’s high/low and measures, during the post-lunch session (default 13:00–16:00), how often:
⬆️ If the afternoon trends up, the Lunch Low gets swept first.
⬇️ If the afternoon trends down, the Lunch High gets swept first.
It reports these as conditional probabilities, not trade signals. 📈
👀 What it shows
🟦 Lunch Range box (toggle): high/low from 12:00–13:00 NY
🔻🔺 Sweep signals (bar-anchored)
Low sweep: triangle below bar + optional “L”
High sweep: triangle above bar + optional “H”
🧱 Optional small box wrapping the swept candle
📊 Stats table (top-right)
P(L-swept | Up) — % of Up-days where Lunch Low was swept
P(H-swept | Down) — % of Down-days where Lunch High was swept
🔁 Contradictions + sample sizes (Up-days / Down-days)
🎯 Direction logic (Up/Down)
Anchor: 13:00 open (pmOpen) ⏰
Threshold: ATR × multiple or % from 13:00
Close ≥ pmOpen + threshold → Up-day
Close ≤ pmOpen − threshold → Down-day
Tiny moves under the threshold are ignored to reduce noise 🧹
⚙️ Inputs
🌐 Timezone: America/New_York (DST handled)
🍽️ Lunch window: 1200–1300
🕓 Post-lunch window: default 1300–1600 (try 17:00/20:00 for sensitivity)
📐 Trend threshold: ATR / Percent (with length/multiple or % level)
📅 Weekdays-only toggle (FX/Equities style)
👁️ Display toggles: Lunch box / sweep arrows / sweep text / sweep candle box / stats table
🔔 TF hint when chart TF > 15m
🧭 How to use
Use 5–15m charts for accurate lunch range capture.
Scroll ~1 year for meaningful samples.
Run sensitivity checks: vary ATR/% thresholds and the post-lunch end time.
For crypto, compare with vs without weekends. 🚀
🧠 Reading the results
High P(L-swept | Up) with a solid Up-day count ⇒ on up afternoons, lunch low is often swept.
High P(H-swept | Down) ⇒ on down afternoons, lunch high is often swept.
Lower Contradictions = cleaner tendency.
Remember: this is a probabilistic tendency, not a rule. 🎲
📝 Notes & limits
All markers (arrows, text, sweep boxes) are bar-anchored; the lunch range box is a research overlay you can toggle.
Real-time vs historical bar building can differ—interpret on bar close. 🔒
Cari dalam skrip untuk "backtesting"

Strategy Chameleon [theUltimator5]Have you ever looked at an indicator and wondered to yourself "Is this indicator actually profitable?" Well now you can test it out for yourself with the Strategy Chameleon!
Strategy Chameleon is a versatile, signal-agnostic trading strategy designed to adapt to any external indicator or trading system. Like a chameleon changes colors to match its environment, this strategy adapts to match any buy/sell signals you provide, making it the ultimate backtesting and automation tool for traders who want to test multiple strategies without rewriting code.
🎯 Key Features
1) Connects ANY external indicator's buy/sell signals
Works with RSI, MACD, moving averages, custom indicators, or any Pine Script output
Simply connect your indicator's signal output to the strategy inputs
2) Multiple Stop Loss Types:
Percentage-based stops
ATR (Average True Range) dynamic stops
Fixed point stops
3) Advanced Trailing Stop System:
Percentage trailing
ATR-based trailing
Fixed point trailing
4) Flexible Take Profit Options:
Risk:Reward ratio targeting
Percentage-based profits
ATR-based profits
Fixed point profits
5) Trading Direction Control
Long Only - Bull market strategies
Short Only - Bear market strategies
Both - Full market strategies
6) Time-Based Filtering
Optional trading session restrictions
Customize active trading hours
Perfect for day trading strategies
📈 How It Works
Signal Detection: The strategy monitors your connected buy/sell signals
Entry Logic: Executes trades when signals trigger during valid time periods
Risk Management: Automatically applies your chosen stop loss and take profit levels
Trailing System: Dynamically adjusts stops to lock in profits
Performance Tracking: Real-time statistics table showing win rate and performance
⚙️ Setup Instructions
0) Add indicator you want to test, then add the Strategy to your chart
Connect Your Signals:
imgur.com
Go to strategy settings → Signal Sources
1) Set "Buy Signal Source" to your indicator's buy output
2) Set "Sell Signal Source" to your indicator's sell output
3) Choose table position - This simply changes the table location on the screen
4) Set trading direction preference - Buy only? Sell only? Both directions?
imgur.com
5) Set your preferred stop loss type and level
You can set the stop loss to be either percentage based or ATR and fully configurable.
6) Enable trailing stops if desired
imgur.com
7) Configure take profit settings
8) Toggle time filter to only consider specific time windows or trading sessions.
🚀 Use Cases
Test various indicators to determine feasibility and/or profitability.
Compare different signal sources quickly
Validate trading ideas with consistent risk management
Portfolio Management
Apply uniform risk management across different strategies
Standardize stop loss and take profit rules
Monitor performance consistently
Automation Ready
Built-in alert conditions for automated trading
Compatible with trading bots and webhooks
Easy integration with external systems
⚠️ Important Notes
This strategy requires external signals to function
Default settings use 10% of equity per trade
Pyramiding is disabled (one position at a time)
Strategy calculates on bar close, not every tick
🔗 Integration Examples
Works perfectly with:
RSI strategies (connect RSI > 70 for sells, RSI < 30 for buys)
Moving average crossovers
MACD signal line crosses
Bollinger Band strategies
Custom oscillators and indicators
Multi-timeframe strategies
📋 Default Settings
Position Size: 10% of equity
Stop Loss: 2% percentage-based
Trailing Stop: 1.5% percentage-based (enabled)
Take Profit: Disabled (optional)
Trade Direction: Both long and short
Time Filter: Disabled

BackTestLibLibrary "BackTestLib"
Allows backtesting indicator performance. Tracks typical metrics such as won/loss, profit factor, draw down, etc. Trading View strategy library provides similar (and more comprehensive)
functionality but only works with strategies. This libary was created to address performance tracking within indicators.
Two primary outputs are generated:
1. Summary Table: Displays overall performance metrics for the indicator over the chart's loaded timeframe and history
2. Details Table: Displays a table of individual trade entries and exits. This table can grow larger than the available chart space. It does have a max number of rows supported. I haven't
found a way to add scroll bars or scroll bar equivalents yet.
f_init(data, _defaultStopLoss, _defaultTakeProfit, _useTrailingStop, _useTraingStopToBreakEven, _trailingStopActivation, _trailingStopOffset)
f_init Initialize the backtest data type. Called prior to using the backtester functions
Parameters:
data (backtesterData) : backtesterData to initialize
_defaultStopLoss (float) : Default trade stop loss to apply
_defaultTakeProfit (float) : Default trade take profit to apply
_useTrailingStop (bool) : Trailing stop enabled
_useTraingStopToBreakEven (bool) : When trailing stop active, trailing stop will increase no further than the entry price
_trailingStopActivation (int) : When trailing stop active, trailing will begin once price exceeds base stop loss by this number of points
_trailingStopOffset (int) : When trailing stop active, it will trail the max price achieved by this number of points
Returns: Initialized data set
f_buildResultStr(_resultType, _price, _resultPoints, _numWins, _pointsWon, _numLoss, _pointsLost)
f_buildResultStr Helper function to construct a string of resutling data for exit tooltip labels
Parameters:
_resultType (string)
_price (float)
_resultPoints (float)
_numWins (int)
_pointsWon (float)
_numLoss (int)
_pointsLost (float)
f_buildResultLabel(data, labelVertical, labelOffset, long)
f_buildResultLabel Helper function to construct an Exit label for display on the chart
Parameters:
data (backtesterData)
labelVertical (bool)
labelOffset (int)
long (bool)
f_updateTrailingStop(_entryPrice, _curPrice, _sl, _tp, trailingStopActivationInput, trailingStopOffsetInput, useTrailingStopToBreakEven)
f_updateTrailingStop Helper function to advance the trailing stop as price action dictates
Parameters:
_entryPrice (float)
_curPrice (float)
_sl (float)
_tp (float)
trailingStopActivationInput (float)
trailingStopOffsetInput (float)
useTrailingStopToBreakEven (bool)
Returns: Updated stop loss for current price action
f_enterShort(data, entryPrice, fixedStopLoss)
f_enterShort Helper function to enter a short and collect data necessary for tracking the trade entry
Parameters:
data (backtesterData)
entryPrice (float)
fixedStopLoss (float)
Returns: Updated backtest data
f_enterLong(data, entryPrice, fixedStopLoss)
f_enterLong Helper function to enter a long and collect data necessary for tracking the trade entry
Parameters:
data (backtesterData)
entryPrice (float)
fixedStopLoss (float)
Returns: Updated backtest data
f_exitTrade(data)
f_enterLong Helper function to exit a trade and update/reset tracking data
Parameters:
data (backtesterData)
Returns: Updated backtest data
f_checkTradeConditionForExit(data, condition, curPrice, enableRealTime)
f_checkTradeConditionForExit Helper function to determine if provided condition indicates an exit
Parameters:
data (backtesterData)
condition (bool) : When true trade will exit
curPrice (float)
enableRealTime (bool) : When true trade will evaluate if barstate is relatime or barstate is confirmed; otherwise just checks on is confirmed
Returns: Updated backtest data
f_checkTrade(data, curPrice, curLow, curHigh, enableRealTime)
f_checkTrade Helper function to determine if current price action dictates stop loss or take profit exit
Parameters:
data (backtesterData)
curPrice (float)
curLow (float)
curHigh (float)
enableRealTime (bool) : When true trade will evaluate if barstate is relatime or barstate is confirmed; otherwise just checks on is confirmed
Returns: Updated backtest data
f_fillCell(_table, _column, _row, _title, _value, _bgcolor, _txtcolor, _text_size)
f_fillCell Helper function to construct result table cells
Parameters:
_table (table)
_column (int)
_row (int)
_title (string)
_value (string)
_bgcolor (color)
_txtcolor (color)
_text_size (string)
Returns: Table cell
f_prepareStatsTable(data, drawTesterSummary, drawTesterDetails, summaryTableTextSize, detailsTableTextSize, displayRowZero, summaryTableLocation, detailsTableLocation)
f_fillCell Helper function to populate result table
Parameters:
data (backtesterData)
drawTesterSummary (bool)
drawTesterDetails (bool)
summaryTableTextSize (string)
detailsTableTextSize (string)
displayRowZero (bool)
summaryTableLocation (string)
detailsTableLocation (string)
Returns: Updated backtest data
backtesterData
backtesterData - container for backtest performance metrics
Fields:
tradesArray (array) : Array of strings with entries for each individual trade and its results
pointsBalance (series float) : Running sum of backtest points won/loss results
drawDown (series float) : Running sum of backtest total draw down points
maxDrawDown (series float) : Running sum of backtest total draw down points
maxRunup (series float) : Running sum of max points won over the backtest
numWins (series int) : Number of wins of current backtes set
numLoss (series int) : Number of losses of current backtes set
pointsWon (series float) : Running sum of points won to date
pointsLost (series float) : Running sum of points lost to date
entrySide (series string) : Current entry long/short
tradeActive (series bool) : Indicates if a trade is currently active
tradeComplete (series bool) : Indicates if a trade just exited (due to stop loss or take profit)
entryPrice (series float) : Current trade entry price
entryTime (series int) : Current trade entry time
sl (series float) : Current trade stop loss
tp (series float) : Current trade take profit
defaultStopLoss (series float) : Default trade stop loss to apply
defaultTakeProfit (series float) : Default trade take profit to apply
useTrailingStop (series bool) : Trailing stop enabled
useTrailingStopToBreakEven (series bool) : When trailing stop active, trailing stop will increase no further than the entry price
trailingStopActivation (series int) : When trailing stop active, trailing will begin once price exceeds base stop loss by this number of points
trailingStopOffset (series int) : When trailing stop active, it will trail the max price achieved by this number of points
resultType (series string) : Current trade won/lost
exitPrice (series float) : Current trade exit price
resultPoints (series float) : Current trade points won/lost
summaryTable (series table) : Table to deisplay summary info
tradesTable (series table) : Table to display per trade info

ETF Builder & Backtest System [TradeDots]Create, analyze, and monitor your own custom “ETF-like” portfolio directly on TradingView. This script merges up to 10 different assets with user-defined weightings into a single composite chart, allowing you to see how your personalized portfolio would have performed historically. It is an original tool designed to help traders and investors quickly gauge risk and return profiles without leaving the TradingView platform.
📝 HOW IT WORKS
1. Custom Portfolio Construction
Multiple Assets : Combine up to 10 different stocks, ETFs, cryptocurrencies, or other symbols.
User-Defined Weights : Allocate each asset a percentage weight (e.g., 15% in AAPL, 10% in MSFT, etc.).
Single Composite Value : The script calculates a weighted “ETF-style” price, effectively simulating a merged portfolio curve on your chart.
2. Performance Tracking & Return Analysis
Automatic History Capture : The indicator records each asset’s starting price when it first appears in your chosen date range.
Rolling Updates : As time progresses, all asset prices are continually evaluated and the portfolio value is updated in real time.
Buy & Hold Returns : See how each asset—and the overall portfolio—performed from the “start” date to the most recent bar.
Annualized Return : Automatically calculates CAGR (Compound Annual Growth Rate) to help visualize performance over varying timescales.
3. Table & Visual Output
Performance Table : A comprehensive table displays individual asset returns, annualized returns, and portfolio totals.
Normalized Chart Plot : The composite ETF value is scaled to 100 at the start date, making it easy to compare relative growth or decline.
Optional Time Filter : You can define a specific date range (Start/End Dates) to focus on a particular period or to limit historical data.
⚙️ KEY FEATURES
1. Flexible Asset Selection
Choose any symbols from multiple asset classes. The script will only run calculations when data is available—no need to worry about missing quotes.
2. Dynamic Table Reporting
Start Price for each asset
Percentage Weight in the portfolio
Total Return (%) and Annualized Return (%)
3. Simple Backtesting Logic
This script takes a straightforward Buy & Hold perspective. Once the start date is reached, the portfolio remains static until the end date, so you can quickly assess hypothetical growth.
4. Plot Customization
Toggle the main “ETF” plot on/off.
Alter the visual style for tables and text.
Adjust the time filter to limit or extend your performance measurement window.
🚀 HOW TO USE IT
1. Add the Script
Search for “ETF Builder & Backtest System ” in the Indicators & Strategies tab or manually add it to your chart after saving it in your Pine Editor.
2. Configure Inputs
Enable Time Filter : Choose whether to restrict the analysis to a particular date range.
Start & End Date : Define the period you want to measure performance over (e.g., from 2019-12-31 to 2025-01-01).
Assets & Weights : Enter each symbol and specify a percentage weight (up to 10 assets).
Display Options : Pick where you want the Table to appear and choose background/text colors.
3. Interpret the Table & Plots
Asset Rows : Each asset’s ticker, weighting, start price, and performance metrics.
ETF Total Row : Summarizes total weighting, composite starting value, and overall returns.
Normalized Plot : Tracks growth/decline of the combined portfolio, starting at 100 on the chart.
4. Refine Your Strategy
Compare how different weights or a new mix of assets would have performed over the same period.
Assess if certain assets contribute disproportionately to your returns or volatility.
Use the results to guide allocations in your real trading or paper trading accounts.
❗️LIMITATIONS
1. Buy & Hold Only
This script does not handle rebalancing or partial divestments. Once the portfolio starts, weights remain fixed throughout the chosen timeframe.
2. No Reinvestment Tracking
Dividends or other distributions are not factored into performance.
3. Data Availability
If historical data for a particular asset is unavailable on TradingView, related results may display as “N/A.”
4. Market Regimes & Volatility
Past performance does not guarantee similar future behavior. Markets can change rapidly, which may render historical backtests less predictive over time.
⚠️ RISK DISCLAIMER
Trading and investing carry significant risk and can result in financial loss. The “ETF Builder & Backtest System ” is provided for informational and educational purposes only. It does not constitute financial advice.
Always conduct your own research.
Use proper risk management and position sizing.
Past performance does not guarantee future results.
This script is an original creation by TradeDots, published under the Mozilla Public License 2.0.
Use this indicator as part of a broader trading or investment approach—consider fundamental and technical factors, overall market context, and personal risk tolerance. No trading tool can assure profits; exercise caution and responsibility in all financial decisions.

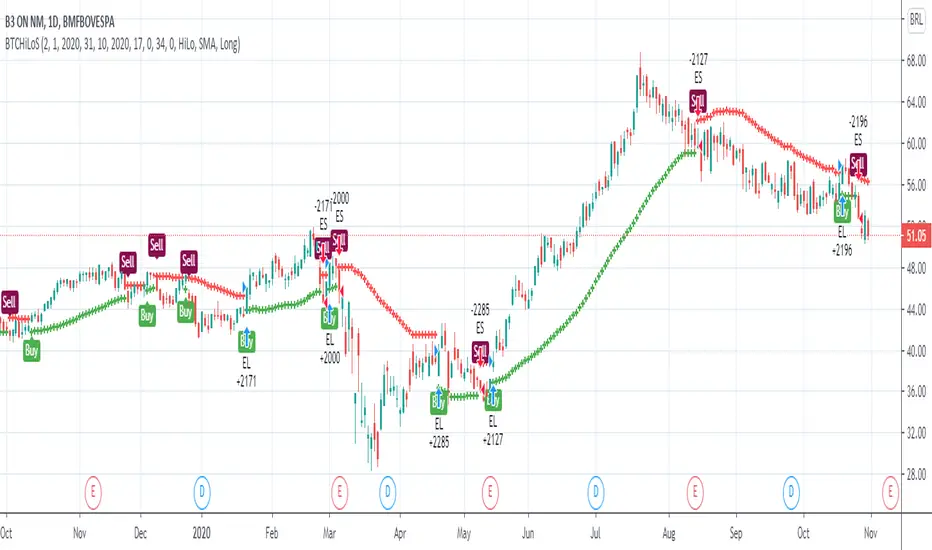
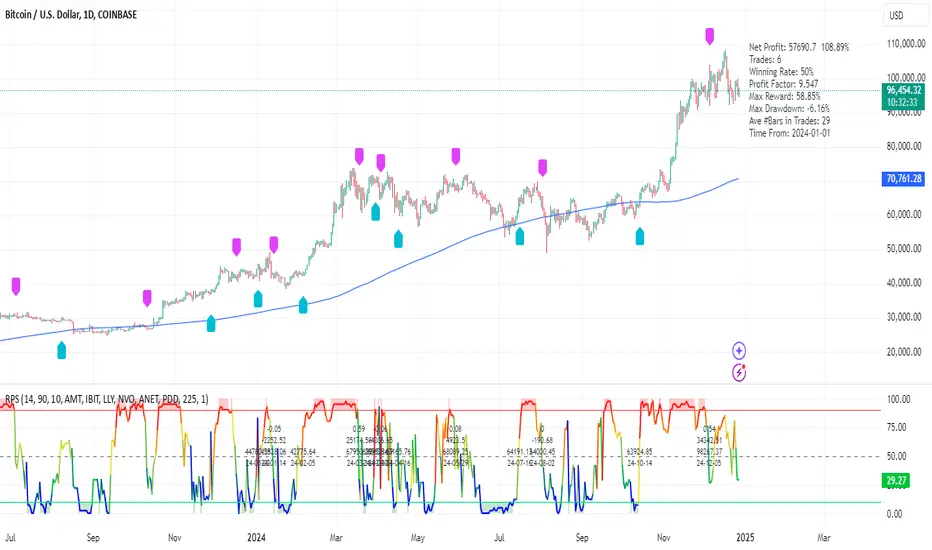
RPS Trading Signals & Backtesting
Overview:
The Enhanced Relative Price Strength (RPS) Indicator is designed for trend traders looking to identify the relative strength of stocks within a select universe. By comparing the price movements of chosen stocks over a specified period, this indicator helps traders make informed decisions about potential buying and selling opportunities.
Key Features:
Relative Strength Ranking: Our RPS indicator ranks the price performance of individual stocks against a curated selection, enabling users to pinpoint which stocks are exhibiting relative strength or weakness.
Customizable Stock Universe: The script evaluates 40 stocks, which include 30 high-weight NDX100 stocks, 4 major index ETFs (SPY, QQQ, DIA, IWM), and allows for the addition of 6 user-defined custom stocks.
Dynamic Color Gradients: The visual representation of the RPS score utilizes a gradient color scheme ranging from purple at low scores to red at high scores, leveraging the color for clear, immediate insight into stock performance.
Threshold Visualization: Users can set specific high (default 85) and low (default 15) thresholds for RPS, highlighted with solid line indicators and area fills. This visual aspect aids traders in quickly spotting entry and exit points.
Trading Signal Generation: The script includes logic for generating buy and sell signals according to defined RPS behaviors relative to the set thresholds, factoring in market conditions based on a long-term moving average.
Backtesting Capabilities: Users can backtest trading signals by inputting desired start and end dates, allowing traders to evaluate the effectiveness of the RPS strategy on historical data for various assets including stocks and cryptocurrencies (e.g., NVDA, LLY, GOOG, BTC, ETH, SOL).
User-Friendly Options: The script allows for adjustments such as moving average lengths, visibility of trading signals, and fills for ease of use and customization according to trading preferences.
How It Works:
The RPS Indicator functions by calculating the performance of stocks relative to each other. Based on the RPS trends, the indicator identifies when to enter or exit trades, providing a framework to capitalize on market movements.
Conclusion:
The Enhanced RPS Indicator aims to empower traders with a powerful analytical tool in their arsenal, tailored to simplify decision-making and bolster trading strategies. As this script evolves, we encourage feedback and collaboration from users to refine and enhance its capabilities further.
Trade Less, Earn More!
Cumulative Volume Delta Strategy | Flux Charts💎 GENERAL OVERVIEW
Introducing the Cumulative Volume Delta Strategy (CVDS) Indicator, an advanced tool designed to enhance trading strategies by identifying potential trend reversals through volume dynamics. This script features integrated order block detection, Fair Value Gaps (FVGs), and a dynamic take-profit (TP) and stop-loss (SL) system. For an in-depth understanding of the strategy, refer to the "HOW DOES IT WORK?" section below.
Features of the new Cumulative Volume Delta Strategy (CVDS) Indicator :
Cumulative Volume Delta-based Strategy
Order Block and Fair Value Gap (FVG) Entry Methods
Dynamic TP/SL System
Customizable Risk Management Settings
Alerts for Buy, Sell, TP, and SL Signals
📌 HOW DOES IT WORK ?
The CVDS indicator operates by tracking the net volume difference between buyers and sellers to identify divergences that could indicate potential trend reversals. A cumulative volume delta (CVD) calculation is employed to measure the intensity of these divergences in relation to price movements. The net volume sum is reset every trading day (can be changed from the settings using the anchor period option), and divergences are detected when the cumulative volume crosses the 0-line over or under.
Once a significant divergence is detected, the indicator identifies breakout points, confirmed by either Fair Value Gaps (FVGs) or Order Blocks (OBs). Depending on your chosen entry mode, the indicator will trigger a buy or sell entry when the confirmation signal aligns with the breakout direction. Alerts for Buy, Sell, Take-Profit, and Stop-Loss are available.
Note that the indicator cannot run on 1-minute and 1-second charts, as it needs to get data from a lower timeframe. 1-minutes & 1-second timeframes are the minimum timeframes in their ranges respectively.
🚩 UNIQUENESS
What sets this indicator apart is the combination of volume divergence analysis with advanced price action tools like Fair Value Gaps (FVGs) and Order Blocks (OBs). The ability to choose between these methods, along with a dynamic TP/SL system that adapts based on volatility, provides flexibility for traders in any market condition. The backtesting dashboard provides metrics about the performance of the indicator. You can use it to tune the settings for best use in the current ticker. The CVD-based strategy ensures that trades are initiated only when meaningful divergences between volume and price occur, filtering out noise and increasing the likelihood of profitable trades.
⚙️ SETTINGS
1. General Configuration
Anchor Period: Time anchor period used in CVD calculation. This is essentially the period that the volume delta sum will be reset. Lower timeframes may result in more entries at the cost of less reliable results.
Entry Mode: Choose between FVGs or OBs to trigger your entries based on the confirmation signals.
Retracement Requirement: Enable to confirm the entry after a retracement toward the FVG or OB.
2. Fair Value Gaps
FVG Sensitivity: Modify the sensitivity of FVG detection, allowing for more or fewer gaps to be considered valid.
3. Order Blocks (OB)
Swing Length: Define the swing length to identify OB formations. Shorter lengths find smaller OBs, while longer lengths detect larger structures.
4. TP / SL
TP / SL Method:
a) Dynamic: The TP / SL zones will be auto-determined by the algorithm based on the Average True Range (ATR) of the current ticker.
b) Fixed : You can adjust the exact TP / SL ratios from the settings below.
Dynamic Risk: The risk you're willing to take if "Dynamic" TP / SL Method is selected. Higher risk usually means a better winrate at the cost of losing more if the strategy fails. This setting is has a crucial effect on the performance of the indicator, as different tickers may have different volatility so the indicator may have increased performance when this setting is correctly adjusted.

Alligator + MA Trend Catcher [TradeDots]The "Alligator + MA Trend Catcher" is a trading strategy that integrates the William Alligator indicator with a Moving Average (MA) to establish robust entry and exit conditions, optimized for capturing trends.
HOW IT WORKS
This strategy combines the traditional William Alligator set up with an additional Moving Average indicator for enhanced trend confirmation, creating a user-friendly backtesting tool for traders who prefer the Alligator method.
The original Alligator strategy can frequently present fluctuations, even in well-established trends, leading to potentially premature exits. To mitigate this, we incorporate a Moving Average as a secondary confirmation measure to ensure the market trend has indeed shifted.
Here’s the operational flow for long orders:
Entry Signal: When the price rises above the Moving Average, it confirms a bullish market state. Enter if Alligator spread in an upward direction. The trade remains active even if the Alligator indicator suggests a trend reversal.
Exit Signal: The position is closed when the price falls below the Moving Average, and the Alligator spreads in the downward direction. This setup helps traders to maintain positions through the entirety of the trend for maximum gain.
APPLICATION
This strategy is tailored for assets with significant, well-defined trends, such as Bitcoin and Ethereum, which are known for their high volatility and substantial price movements.
This strategy offers a low win-rate but high reward configuration, making asset selection critical for long-term profitability. If you choose assets that lack strong price momentum, there's a high chance that this strategy may not be effective.
For traders seeking to maximize gains from large trends without exiting prematurely, this strategy provides an aggressive yet controlled approach to riding out substantial market waves.
DEFAULT SETUP
Commission: 0.01%
Initial Capital: $10,000
Equity per Trade: 80%
RISK DISCLAIMER
Trading entails substantial risk, and most day traders incur losses. All content, tools, scripts, articles, and education provided by TradeDots serve purely informational and educational purposes. Past performances are not definitive predictors of future results.

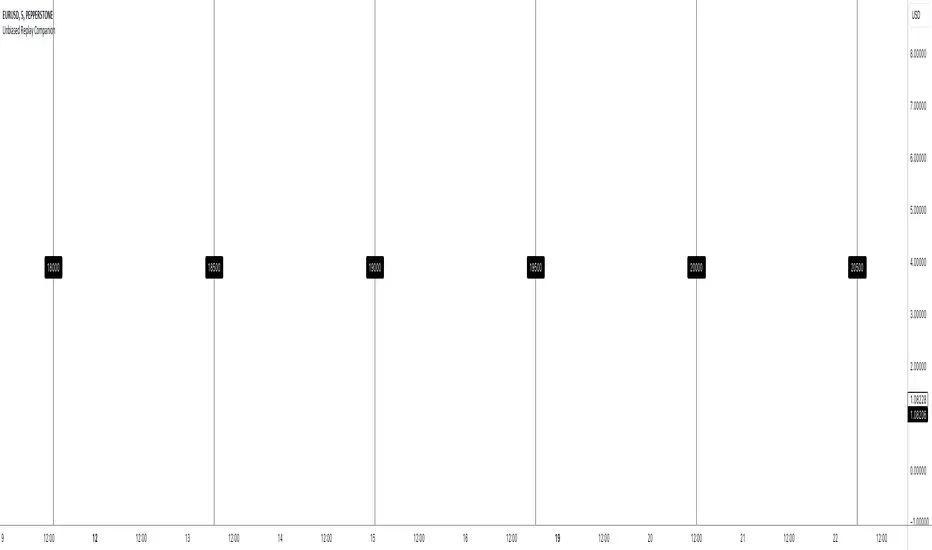
Unbiased Replay CompanionWhen using bar replay mode on TradingView, you have to scroll your way back through clearly visible price history, which always leaves you with unwanted lookahead bias because you unfortunately see all future price movements before they are hidden by the use of the scissors tool.
This indicator provides a simple way to hide all the price action and displays a configurable bar counter instead, allowing you to scroll back to every moment in history without seeing any of the prices' movements. The bar counter hereby serves as a visual aid to guide you back to the very first available bar on the chart.
You can configure the color of the overlay to match your charts' background as well as the style of the bar counter and the distance at which the counter is being displayed.
The indicator crops the vertical price scale by a random amount (only when it is being displayed) to also prevent you from having any unwanted bias based on the current price range.
Whenever you're done scrolling and have used the replay scissors tool to start your session just hide the indicator and bring it up again when you need to scroll. That's all there is to it.
Important: After you apply the indicator to your charts, make sure it is displayed in front of everything else. You can configure this by clicking on the three dots that are displayed on the right side of the indicator name on hover and choose "Visual order > Bring to front" from the popup menu that appears.
Enjoy your unbiased backtesting sessions!
Optimal Length BackTester [YinYangAlgorithms]This Indicator allows for a ‘Optimal Length’ to be inputted within the Settings as a Source. Unlike most Indicators and/or Strategies that rely on either Static Lengths or Internal calculations for the length, this Indicator relies on the Length being derived from an external Indicator in the form of a Source Input.
This may not sound like much, but this application may allows limitless implementations of such an idea. By allowing the input of a Length within a Source Setting you may have an ‘Optimal Length’ that adjusts automatically without the need for manual intervention. This may allow for Traditional and Non-Traditional Indicators and/or Strategies to allow modifications within their settings as well to accommodate the idea of this ‘Optimal Length’ model to create an Indicator and/or Strategy that adjusts its length based on the top performing Length within the current Market Conditions.
This specific Indicator aims to allow backtesting with an ‘Optimal Length’ inputted as a ‘Source’ within the Settings.
This ‘Optimal Length’ may be used to display and potentially optimize multiple different Traditional Indicators within this BackTester. The following Traditional Indicators are included and available to be backtested with an ‘Optimal Length’ inputted as a Source in the Settings:
Moving Average; expressed as either a: Simple Moving Average, Exponential Moving Average or Volume Weighted Moving Average
Bollinger Bands; expressed based on the Moving Average Type
Donchian Channels; expressed based on the Moving Average Type
Envelopes; expressed based on the Moving Average Type
Envelopes Adjusted; expressed based on the Moving Average Type
All of these Traditional Indicators likewise may be displayed with multiple ‘Optimal Lengths’. They have the ability for multiple different ‘Optimal Lengths’ to be inputted and displayed, such as:
Fast Optimal Length
Slow Optimal Length
Neutral Optimal Length
By allowing for the input of multiple different ‘Optimal Lengths’ we may express the ‘Optimal Movement’ of such an expressed Indicator based on different Time Frames and potentially also movement based on Fast, Slow and Neutral (Inclusive) Lengths.
This in general is a simple Indicator that simply allows for the input of multiple different varieties of ‘Optimal Lengths’ to be displayed in different ways using Tradition Indicators. However, the idea and model of accepting a Length as a Source is unique and may be adopted in many different forms and endless ideas.
Tutorial:
You may add an ‘Optimal Length’ within the Settings as a ‘Source’ as followed in the example above. This Indicator allows for the input of a:
Neutral ‘Optimal Length’
Fast ‘Optimal Length’
Slow ‘Optimal Length’
It is important to account for all three as they generally encompass different min/max length values and therefore result in varying ‘Optimal Length’s’.
For instance, say you’re calculating the ‘Optimal Length’ and you use:
Min: 1
Max: 400
This would therefore be scanning for 400 (inclusive) lengths.
As a general way of calculating you may assume the following for which lengths are being used within an ‘Optimal Length’ calculation:
Fast: 1 - 199
Slow: 200 - 400
Neutral: 1 - 400
This allows for the calculation of a Fast and Slow length within the predetermined lengths allotted. However, it likewise allows for a Neutral length which is inclusive to all lengths alloted and may be deemed the ‘Most Accurate’ for these reasons. However, just because the Neutral is inclusive to all lengths, doesn’t mean the Fast and Slow lengths are irrelevant. The Fast and Slow length inputs may be useful for seeing how specifically zoned lengths may fair, and likewise when they cross over and/or under the Neutral ‘Optimal Length’.
This Indicator features the ability to display multiple different types of Traditional Indicators within the ‘Display Type’.
We will go over all of the different ‘Display Types’ with examples on how using a Fast, Slow and Neutral length would impact it:
Simple Moving Average:
In this example above have the Fast, Slow and Neutral Optimal Length formatted as a Slow Moving Average. The first example is on the 15 minute Time Frame and the second is on the 1 Day Time Frame, demonstrating how the length changes based on the Time Frame and the effects it may have.
Here we can see that by inputting ‘Optimal Lengths’ as a Simple Moving Average we may see moving averages that change over time with their ‘Optimal Lengths’. These lengths may help identify Support and/or Resistance locations. By using an 'Optimal Length' rather than a static length, we may create a Moving Average which may be more accurate as it attempts to be adaptive to current Market Conditions.
Bollinger Bands:
Bollinger Bands are a way to see a Simple Moving Average (SMA) that then uses Standard Deviation to identify how much deviation has occurred. This Deviation is then Added and Subtracted from the SMA to create the Bollinger Bands which help Identify possible movement zones that are ‘within range’. This may mean that the price may face Support / Resistance when it reaches the Outer / Inner bounds of the Bollinger Bands. Likewise, it may mean the Price is ‘Overbought’ when outside and above or ‘Underbought’ when outside and below the Bollinger Bands.
By applying All 3 different types of Optimal Lengths towards a Traditional Bollinger Band calculation we may hope to see different ranges of Bollinger Bands and how different lookback lengths may imply possible movement ranges on both a Short Term, Long Term and Neutral perspective. By seeing these possible ranges you may have the ability to identify more levels of Support and Resistance over different lengths and Trading Styles.
Donchian Channels:
Above you’ll see two examples of Machine Learning: Optimal Length applied to Donchian Channels. These are displayed with both the 15 Minute Time Frame and the 1 Day Time Frame.
Donchian Channels are a way of seeing potential Support and Resistance within a given lookback length. They are a way of withholding the High’s and Low’s of a specific lookback length and looking for deviation within this length. By applying a Fast, Slow and Neutral Machine Learning: Optimal Length to these Donchian Channels way may hope to achieve a viable range of High’s and Low’s that one may use to Identify Support and Resistance locations for different ranges of Optimal Lengths and likewise potentially different Trading Strategies.
Envelopes / Envelopes Adjusted:
Envelopes are an interesting one in the sense that they both may be perceived as useful; however we deem that with the use of an ‘Optimal Length’ that the ‘Envelopes Adjusted’ may work best. We will start with examples of the Traditional Envelope then showcase the Adjusted version.
Envelopes:
As you may see, a Traditional form of Envelopes even produced with a Machine Learning: Optimal Length may not produce optimal results. Unfortunately this may occur with some Traditional Indicators and they may need some adjustments as you’ll notice with the ‘Envelopes Adjusted’ version. However, even without the adjustments, these Envelopes may be useful for seeing ‘Overbought’ and ‘Oversold’ locations within a Machine Learning: Optimal Length standpoint.
Envelopes Adjusted:
By adding an adjustment to these Envelopes, we may hope to better reflect our Optimal Length within it. This is caused by adding a ratio reflection towards the current length of the Optimal Length and the max Length used. This allows for the Fast and Neutral (and potentially Slow if Neutral is greater) to achieve a potentially more accurate result.
Envelopes, much like Bollinger Bands are a way of seeing potential movement zones along with potential Support and Resistance. However, unlike Bollinger Bands which are based on Standard Deviation, Envelopes are based on percentages +/- from the Simple Moving Average.
We will conclude our Tutorial here. Hopefully this has given you some insight into how useful adding a ‘Optimal Length’ within an external (secondary) Indicator as a Source within the Settings may be. Likewise, how useful it may be for automation sake in the sense that when the ‘Optimal Length’ changes, it doesn’t rely on an alert where you need to manually update it yourself; instead it will update Automatically and you may reap the benefits of such with little manual input needed (aside from the initial setup).
If you have any questions, comments, ideas or concerns please don't hesitate to contact us.
HAPPY TRADING!

Captain Backtest Model [TFO]Created by @imjesstwoone and @mickey1984, this trade model attempts to capture the expansion from the 10:00-14:00 EST 4h candle using just 3 simple steps. All of the information presented in this description has been outlined by its creators, all I did was translate it to Pine Script. All core settings of the trade model may be edited so that users can test several variations, however this description will cover its default, intended behavior using NQ 5m as an example.
Step 1 is to identify our Price Range. In this case, we are concerned with the highest high and the lowest low created from 6:00-10:00 EST.
Step 2 is to wait for either the high or low of said range to be taken out. Whichever side gets taken first determines the long/short bias for the remainder of the Trade Window (i.e. if price takes the range high, bias is long, and vice versa). Bias must be determined by 11:15 EST, otherwise no trades will be taken. This filter is intended to weed out "choppy" trading days.
Step 3 is to wait for a retracement and enter with a close through the previous candle's high (if long biased) or low (if short biased). There are a couple toggleable criteria that we use to define a retracement; one is checking for opposite close candles that indicate a pullback; another is checking if price took the previous candle's low (if long biased) or high (if short biased).
This trade model was initially tested for index futures, particularly ES and NQ, using a 5m chart, however this indicator allows us to backtest any symbol on any timeframe. Creators @imjesstwoone and @mickey1984 specified a 5 point stop loss on ES and a 25 point stop loss on NQ with their testing.
I've personally found some success in backtesting NQ 5m using a 25 point stop loss and 75 point profit target (3:1 R). Enabling the Use Fixed R:R parameter will ensure that these stops and targets are utilized, otherwise it will enter and hold the position until the close of the Trade Window.

Backtest Strategy Optimizer AdapterBacktest Strategy Optimizer Adapter
With this library, you will be able to run one or multiple backtests with different variables (combinations). For example, you can run 100 backtests of Supertrend at once with an increment factor of 0.1. This way, you can easily fetch the most profitable settings and apply them to your strategy.
To get a better understanding of the code, you can check the code below.
Single backtest results
= backtest.results(date_start, date_end, long_entry, long_exit, take_profit_percentage, stop_loss_percentage, atr_length, initial_capital, order_size, commission)
Add backtest results to a table
backtest.table(initial_capital, profit_and_loss, open_balance, winrate, entries, exits, wins, losses, backtest_table_position, backtest_table_margin, backtest_table_transparency, backtest_table_cell_color, backtest_table_title_cell_color, backtest_table_text_color)
Backtest result without chart labels
= backtest.run(date_start, date_end, long_entry, long_exit, take_profit_percentage, stop_loss_percentage, atr_length, initial_capital, order_size, commission)
Backtest result profit
profit = backtest.profit(date_start, date_end, long_entry, long_exit, take_profit_percentage, stop_loss_percentage, atr_length, initial_capital, order_size, commission)
Backtest result winrate
winrate = backtest.winrate(date_start, date_end, long_entry, long_exit, take_profit_percentage, stop_loss_percentage, atr_length, initial_capital, order_size, commission)
Start Date
You can set the start date either by using a timestamp or a number that refers to the number of bars back.
Stop Loss / Take Profit Issue
Unfortunately, I did not manage to achieve 100% accuracy for the take profit and stop loss. The original TradingView backtest can stop at the correct position within a bar using the strategy.exit stop and limit variables. However, it seems unachievable with a crossunder/crossover function in PineScript unless it is calculated on every tick (which would make the backtesting results invalid). So far, I have not found a workaround, and I would be grateful if someone could solve this issue, if it is even possible. If you have any solutions or fixes, please let me know!
Multiple Backtest Results / Optimizer
You can run multiple backtests in a single strategy or indicator, but there are certain requirements for placing the correct code in the right way. To view examples of running multiple backtests, you can refer to the links provided in the updates I posted below. In the samples I have also explained how you can auto-generate code for your backtest strategy.
HK Percentile Interpolation One
This script is designed to execute a trading strategy based on Heikin Ashi candlesticks, moving averages, and percentile levels.
Please note that you should keep your original chart in normal candlestick mode and not switch it to Heikin Ashi mode. The script itself calculates Heikin Ashi values from regular candlesticks. If your chart is already in Heikin Ashi mode, the script would be calculating Heikin Ashi values based on Heikin Ashi values, which would produce incorrect results.
The strategy begins trading from a start date that you can specify by modifying the `startDate` parameter. The format of the date is "YYYY MM DD". So, for example, to start the strategy from January 1, 2022, you would set `startDate = timestamp("2022 01 01")`.
The script uses Heikin Ashi candlesticks, which are plotted in the chart. This approach can be useful for spotting trends and reversals more easily than with regular candlestick charts. This is particularly useful when backtesting in TradingView's "Rewind" mode, as you can see how the Heikin Ashi candles behaved at each step of the strategy.
Buy and sell signals are generated based on two factors:
1. The crossing over or under of the Heikin Ashi close price and the 75th percentile price level.
2. The Heikin Ashi close price being above certain moving averages.
You have the flexibility to adjust several parameters in the script, including:
1. The stop loss and trailing stop percentages (`stopLossPercentage` and `trailStopPercentage`). These parameters allow the strategy to exit trades if the price moves against you by a certain percentage.
2. The lookback period (`lookback`) used to calculate percentile levels. This determines the range of past bars used in the percentile calculation.
3. The lengths of the two moving averages (`yellowLine_length` and `purplLine_length`). These determine how sensitive the moving averages are to recent price changes.
4. The minimum holding period (`holdPeriod`). This sets the minimum number of bars that a trade must be kept open before it can be closed.
Please adjust these parameters according to your trading preferences and risk tolerance. Happy trading!

Rocket Grid Algorithm - The Quant ScienceThe Rocket Grid Algorithm is a trading strategy that enables traders to engage in both long and short selling strategies. The script allows traders to backtest their strategies with a date range of their choice, in addition to selecting the desired strategy - either SMA Based Crossunder or SMA Based Crossover.
The script is a combination of trend following and short-term mean reversing strategies. Trend following involves identifying the current market trend and riding it for as long as possible until it changes direction. This type of strategy can be used over a medium- to long-term time horizon, typically several months to a few years.
Short-term mean reversing, on the other hand, involves taking advantage of short-term price movements that deviate from the average price. This type of strategy is usually applied over a much shorter time horizon, such as a few days to a few weeks. By rapidly entering and exiting positions, the strategy seeks to capture small, quick gains in volatile market conditions.
Overall, the script blends the best of both worlds by combining the long-term stability of trend following with the quick gains of short-term mean reversing, allowing traders to potentially benefit from both short-term and long-term market trends.
Traders can configure the start and end dates, months, and years, and choose the length of the data they want to work with. Additionally, they can set the percentage grid and the upper and lower destroyers to manage their trades effectively. The script also calculates the Simple Moving Average of the chosen data length and plots it on the chart.
The trigger for entering a trade is defined as a crossunder or crossover of the close price with the Simple Moving Average. Once the trigger is activated, the script calculates the total percentage of the side and creates a grid range. The grid range is then divided into ten equal parts, with each part representing a unique grid level. The script keeps track of each grid level, and once the close price reaches the grid level, it opens a trade in the specified direction.
The equity management strategy in the script involves a dynamic allocation of equity to each trade. The first order placed uses 10% of the available equity, while each subsequent order uses 1% less of the available equity. This results in the allocation of 9% for the second order, 8% for the third order, and so on, until a maximum of 10 open trades. This approach allows for risk management and can help to limit potential losses.
Overall, the Rocket Grid Algorithm is a flexible and powerful trading strategy that can be customized to meet the specific needs of individual traders. Its user-friendly interface and robust backtesting capabilities make it an excellent tool for traders looking to enhance their trading experience.

iMoku (Ichimoku Complete Tool) - The Quant Science iMoku™ is a professional all-in-one solution for the famous Ichimoku Kinko Hyo indicator.
The algorithm includes:
1. Backtesting spot
2. Visual tool
3. Auto-trading functions
With iMoku you can test four different strategies.
Strategy 1: Cross Tenkan Sen - Kijun Sen
A long position is opened with 100% of the invested capital ($1000) when "Tenkan Sen" crossover "Kijun Sen".
Closing the long position on the opposite condition.
There are 3 different strength signals for this strategy: weak, normal, strong.
Weak : the signal is weak when the condition is true and the price is above the 'Kumo'
Normal : the signal is normal when the condition is true and the price is within the 'Kumo'
Strong : the signal is strong when the condition is true and the price is below the 'Kumo'
Strategy 2: Cross Price - Kijun Sen
A long position is opened with 100% of the invested capital ($1000) when the price crossover the 'Kijun Sen'.
Closing the long position on the opposite condition.
There are 3 different strength signals for this strategy: weak, normal, strong.
Weak : the signal is weak when the condition is true and the price is above the 'Kumo'
Normal : the signal is normal when the condition is true and the price is inside the 'Kumo'
Strong : the signal is strong when the condition is true and the price is below the 'Kumo'
Strategy 3: Kumo Breakout
A long position is opened with 100% of the invested capital ($1000) when the price breakup the 'Kumo'.
Closing the long position with a percentage stop loss and take profit on the invested capital.
Strategy 4: Kumo Twist
A long position is opened with 100% of the invested capital ($1000) when the 'Kumo' goes from negative to positive (called "Twist").
Closing the long position on the opposite condition.
There are 2 different strength signals for this strategy: weak, and strong.
Weak : the signal is weak when the condition is true and the price is above the 'Kumo'
Strong : the signal is strong when the condition is true and the price is below the 'Kumo'
This script is compliant with algorithmic trading.
You can use this script with trading terminals such as 3Commas or CryptoHopper. Connecting this script is very easy.
1. Enter the user interface
2. Select and activate a strategy
3. Copy your bot's links into the dedicated fields
4. Create and activate alert
Disclaimer: algorithmic trading involves risk, the user should consider aspects such as slippage, liquidity and costs when evaluating an asset. The Quant Science is not responsible for any kind of damage resulting from use of this script. By using this script you take all the responsibilities and risks.

Month/Month Percentage % Change, Historical; Seasonal TendencyTable of monthly % changes in Average Price over the last 10 years (or the 10 yrs prior to input year).
Useful for gauging seasonal tendencies of an asset; backtesting monthly volatility and bullish/bearish tendency.
~~User Inputs~~
Choose measure of average: sma(close), sma(ohlc4), vwap(close), vwma(close).
Show last 10yrs, with 10yr average % change, or to just show single year.
Chose input year; with the indicator auto calculating the prior 10 years.
Choose color for labels and size for labels; choose +Ve value color and -Ve value color.
Set 'Daily bars in month': 21 for Forex/Commodities/Indices; 30 for Crypto.
Set precision: decimal places
~~notes~~
-designed for use on Daily timeframe (tradingview is buggy on monthly timeframe calculations, and less precise on weekly timeframe calculations).
-where Current month of year has not occurred yet, will print 9yr average.
-calculates the average change of displayed month compared to the previous month: i.e. Jan22 value represents whole of Jan22 compared to whole of Dec21.
-table displays on the chart over the input year; so for ES, with 2010 selected; shows values from 2001-2010, displaying across 2010-2011 on the chart.
-plots on seperate right hand side scale, so can be shrunk and dragged vertically.
-thanks to @gabx11 for the suggestion which inspired me to write this

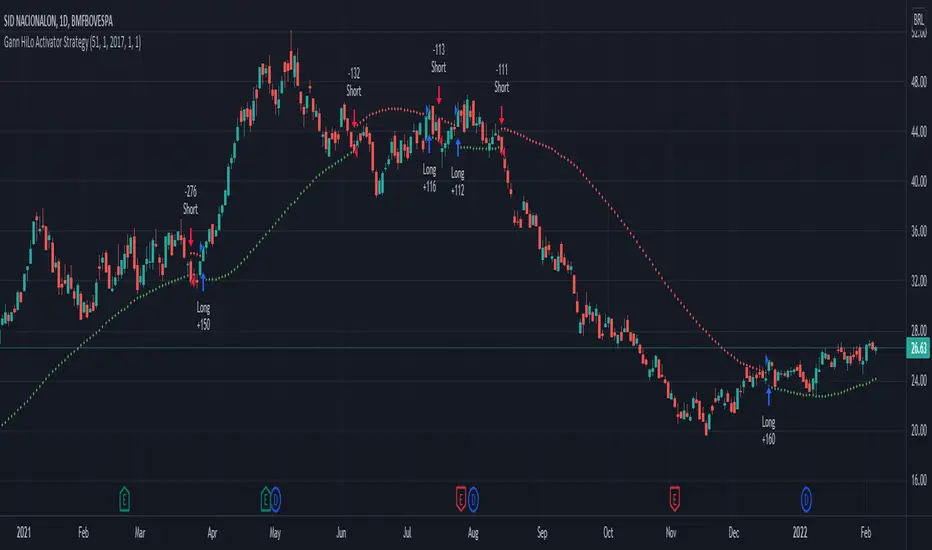
Gann HiLo Activator Strategy█ OVERVIEW
Strategy based on the Gann Hilo Activator . This is a trend following strategy, which means it will go long (and close the previous short position) once the price closes above the high SMA, and go short (and close the previous long position) once the price closes below the low SMA.
█ PARAMETERS
- Length
- Displace (or offset): default is 1
- Begin from start: strategy will run since the beggining
- From year, month, day: Choose an specific date to start backtesting (must disable the parameter above to work)
█ HOW TO USE
After choosing the start date to run the strategy, you can change the length field and look at the backtest results to find the most optimal settings for the current symbol.
This strategy was tested on the stock and crypto market with good results. Hope you enjoy!
WhaleCrew BacktesterBacktesting indicators is easy , just add the following line of code to your script:
plot(longEntry ? 1 : shortEntry ? -1 : longTP ? 0.5 : shortTP ? -0.5 : 0, color=na, editable=false, title='Backtest')
These numbers are defined as constants in the backtester source-code.
After adding this indicator to your chart:
1. Open Settings
2. Select supported indicator to backtest
3. Select if you want to enter Longs and/or Shorts
4. Open the 'Strategy Tester' at the bottom to check the performance
Remember:
past performance is not indicative of future results
repainting indicators will create wrong/unrealistic results

EMR Strategy [H1 Backtesting]EMR Strategy base on EMA, MACD and RSI to supply signal on time frame H1.
Details of Rule as below:
===
1.EMA
+ Time frame: H1
+ Periods: 25, 100 (~ EMA 25 H4), 600 (~ EMA 25 D1)
===
2.MACD
+ Time frame: H1
+ Periods: 12,26,9
===
3.RSI
+ Time frame: H1
+ Periods: 14
===
4.Trading Rule
4.1.Long Position
+ MACD>0 and RSI>50 and close price moving above EMA 25
+ Close price crossed EMA 100 or crossed EMA 600 at the first time
4.2.Short Position
+ MACD<0 and RSI<50 and close price moving below EMA 25
+ Close price crossed EMA 100 or crossed EMA 600 at the first time
===
5.Money Management
+ This strategy concentrate into winrate.
+ So use trailing stop to protect your profits.
+ And use stoploss to avoid big loss on trades.

Inverse Fisher Transform on RSI for backtest w/alertsThis version of the Inverse Fisher Transform on RSI comes with support for
1) Backtesting with Gavin's backtest script
2) Bypass, you can use another indicator to pause buy signals from this indicator. Just create another indicator that plots "1" whenever you want to activate the bypass on the IFTRSI signal.
3) Independent buy and sell level thresholds. Some tokens perform better with a higher sell level, even levels as high as 0.996, sometimes the buy level can also be relaxed to even 0.6 and get incredible results on the 5 minute chart.
4) alerts for Buy and Sell signals
Make sure you add Gavin's backtest and select external signal and this indicator as the source.

72s Strat: Backtesting Adaptive HMA+ pt.1This is a follow up to my previous publication of Adaptive HMA+ few months ago, as a mean to provide some kind of initial backtesting tools. Which can be use to explore many possible strategies, optimise its settings to better conform user's pair/tf, and hopefully able to help tweaking your general strategy.
If you haven't read the study or use the indicator, kindly go here first to get the overall idea.
The first strategy introduce in this backtest is one most basic already described in the study; buy/sell is when movement is there and everything is on the right side; When RSI has turned to other side, we can use it as exit point (if in profit of course, else just let it hit our TP/SL, why would we exit before profit). Also, base on RSI when we make entry, we can further differentiate type of signals. --Please check all comments in code directly where the signals , entries , and exits section are.
Second additional strategy to check; is when we also use second faster Adaptive HMA+ for exit. So this is like a double orders on a signal but with different exit-rule (/more on this on snapshots below). Alternatively, you can also work the code so to only use this type of exit.
There's also an additional feature which you can enable its visuals, the Distance Zone , is to help measuring price distance to our xHMA+. It's just a simple atr based envelope really, I already put the sample code in study's comment section, but better gonna update it there directly for non-coder too, after this.
In this sample I use Lot for order quantity size just because that's what I use on my broker. Also what few friends use while we forward-testing it since the study is published, so we also checked/compared each profit/loss report by real number. To use default or other unit of measurement, change the entry code accordingly.
If you change your order size, you should also change the commission in Properties Tab. My broker commission is 5 USD per order/lot, so in there with example order size 0.1 lot I put commission 0.5$ per order (I'll put 2.5$ for 0.5 lot, 10$ for 2 lot, and so on). Crypto usually has higher charge. --It is important that you should fill it base on your broker.
SETTINGS
I'm trying to keep it short. Please explore it further again. (Beginner should also first get acquaintance with terms use here.)
ORDERS:
Base Minimum Profit Before Exit:
The number is multiplier of ongoing ATR. Means that when basic exit condition is met, algo will check whether you're already in minimum profit or not, if not, let it still run to TP or SL, or until it meets subsequent exit condition, then it will check again.
Default Target Profit:
Multiplier of ATR at signal. If reached before any eligible exit condition is met, exit TP.
Base StopLoss Point:
You can change directly in code to use other like ATR Trailing SL, fix percent SL, or whatever. In the sample, 4 options provided.
Maximum StopLoss:
This is like a safety-net, that if at some point your chosen SL point from input above happens to be exceeding this maximum input that you can tolerate, then this max point is the one will be use as SL.
Activate 2nd order...:
The additional doubling of certain buy/sell with different exits as described above. If enable, you should also set pyramiding to at least: 2. If not, it does nothing.
ADAPTIVE HMA+ PERIOD
Many users already have their own settings for these. So in here I only sample the default as first presented in the study. Make it to your adaptive.
MARKET MOVEMENT
(1) Now you can check in realtime how much slope degree is best to define your specific pair/tf is out of congestion (yellow) area. And (2) also able to check directly what ATR lengths are more suitable defining your pair's volatility.
DISTANCE ZONE
Distance Multiplier. Each pair/tf has its own best distance zone (in xHMA+ perspective). The zone also determine whether a signal should appear or not. (Or what type of signal, if you wanna go more detail in constructing your strategy)
USAGE
(Provided you already have your own comfortable settings for minimum-maximum period of Adaptive HMA+. Best if you already have backtested it manually too and/or apply as an add-on to your working strategy)
1. In our experiences, first most important to define is both elements in the Market Movement Settings . These also tend to be persistent for whole season since it's kinda describing that pair/tf overall behaviour. Don't worry if you still get a low Profit Factor here, but by tweaking you should start to see positive changes in one of Max Drawdown and Net Profit, or Percent Profitable.
2. Afterwards, find your pair/tf Distance Zone . When optimising this, what we seek is just a "not to bad" equity curves to start forming. At least Max Drawdown should lessen more. Doesn't have to be great already, but should be better, no red in Net Profit.
3. Then go manage the "Trailing Minimum Profit", TP, SL, and max SL.
4. Repeat 1,2,3. 👻
5. Manage order size, commission, and/or enable double-order (need pyramiding) if you like. Check if your equity can handle max drawdown before margin call.
6. After getting an acceptable backtest result, go to List of Trades tab and find the biggest loss or when many sequencing loss in a row happened. Click on it to go to exact point on chart, observe why the signal failed and get at least general idea how it can be prevented . The rest is yours, you should know your pair/tf more than other.
You can also re-explore your minimum-maximum period for both Major and minor xHMA+.
Keep in mind that all numbers in Setting are conceptually in a form of range . You don't want to get superb equity curves but actually a "fragile" , means one can easily turn it to disaster just by changing only a fraction in one/two of the setting.
---
If you just wanna test the strength of the indicator alone, you can disable "Use StopLoss" temporarily while optimising settings.
Using no SL might be tempting in overall result data in some cases, but NOTE: It is not recommended to not using SL, don't forget that we deliberately enter when it's in high volatility. If want to add flexibility or trading for long-term, just maximise your SL. ie.: chose SL Point>ATR only and set it maximum. (Check your max drawdown after this).
I think this is quite important specially for beginners, so here's an example; Hypothetically in below scenario, because of some settings, the buy order after the loss sell signal didn't appear. Let's say if our initial capital only 1000$ using leverage and order size 0,5 lot (risky position sizing already), moreover if this happens at the beginning of your trading season, that's half of account gone already in one trade . Your max SL should've made you exit after that pumping bar.
The Trailing Minimum Profit is actually look like this. Search in the code if you want to plot it. I just don't like too many lines on chart.
To maximise profit we can try enabling double-order. The only added rule coded is: RSI should rising when buy and falling when sell. 2nd signal will appears above or below default buy/sell signal. (Of course it's also prone to double-loss, re-check your max drawdown after. Profit factor play its part in here for a long run). Snapshot in comparison:
Two default sell signals on left closed at RSI exit, the additional sell signal closed later on when price crossover minor xHMA+. On buy side, price haven't met our minimum profit when first crossunder minor xHMA+. If later on we hit SL on this "+buy" signal, at least we already profited from default buy signal. You can also consider/treat this as multiple TP points.
For longer-term trading, what you need to maximise is the Minimum Profit , so it won't exit whenever an exit condition happened, it can happen several times before reaching minimum profit. Hopefully this snapshot can explain:
Notice in comparison default sell and buy signal now close in average after 3 days. What's best is when we also have confirmation from higher TF. It's like targeting higher TF by entering from smaller TF.
As also mention in the study, we can still experiment via original HMA by putting same value for minimum-maximum period setting. This is experimental EU 1H with Major xHMA+: 144-144, Flat market 13, Distance multiplier 3.6, with 2nd order activated.
Kiwi was a bit surprising for me. It's flat market is effectively below 6, with quite far distance zone of 3.5. Probably because I'm using big numbers in adaptive period.
---
The result you see in strategy tester report below for EURUSD 15m is using just default settings you see in code, as follow:
0,1 lot for each order (which is the smallest allowed by my broker).
No pyramiding. Commission: 0.5 usd per order. Slippage: 3
Opening position is only using basic strategy #1 (RSI exit). Additional exit not activated.
Minimum Profit: 1. TP: 3.
SL use: Half-distance zone. Max SL: 4.5.
Major xHMA+: 172-233. minor xHMA+: 89-121
Distance Zone Multiplier: 2.7
RSI: Standard 14.
(From our forward-testing, the difference we get from net profit is because of the spread, our entry isn't exactly at the close/open price. Not so much though, but not the same. If somebody can direct me to any example where we can code our entry via current bid/ask price, that would be awesome!)
It's already a long post (sorry), think I'm gonna pause here. Check out the code :)
---
DISCLAIMER: Past performance is no guarantee of future results , and so on.. you know the drill ;)
Please read whole description first before using, don't take 1-2 paragraph and claim it's the whole logic, you are responsible of your own actions and understanding.

Flawless Victory Strategy - 15min BTC Machine Learning StrategyHello everyone, I am a heavy Python programmer bringing machine learning to TradingView. This 15 minute Bitcoin Long strategy was created using a machine learning library and 1 year of historical data in Python. Every parameter is hyper optimized to bring you the most profitable buy and sell signals for Bitcoin on the 15min chart. The historical Bitcoin data was gathered from Binance API, in case you want to know the best exchange to use this long strategy. It is a simple Bollinger Band and RSI strategy with two versions included in the tradingview settings. The first version has a Sharpe Ratio of 7.5 which is amazing, and the second version includes the best stop loss and take profit positions with a Sharpe Ratio of 2.5 . Let me talk a little bit more about how the strategy works. The buy signal is triggered when close price is less than lower Bollinger Band at Std Dev 1, and the RSI is greater than a certain value. The sell signal is triggered when close price is greater than upper Bollinger Band at Std Dev 1, and the RSI is greater than a certain value. What makes this strategy interesting is the parameters the Machine Learning library found when backtesting for the best Sharpe Ratio. I left my computer on for about 28 hours to fully backtest 5000 EPOCHS and get the results. I was able to create a great strategy that might be one of TradingView's best strategies out on the website today. I will continue to apply machine learning to all my strategies from here on forward. Please Let me know if you have any questions or certain strategies you would like me to hyper optimize for you. I'm always willing to create profitable strategies!
P.S. You can always pyramid this strategy for more gains! I just don't add pyramiding when creating my strategies because I want to show you the true win/loss ratio based buying one time and one selling one time. I feel like when creating a strategy that includes pyramiding right off the bat falsifies the win rate. This is my way of being transparent with you all. Have fun trading!

Ultimate Strategy TemplateHello Traders
As most of you know, I'm a member of the PineCoders community and I sometimes take freelance pine coding jobs for TradingView users.
Off the top of my head, users often want to:
- convert an indicator into a strategy, so as to get the backtesting statistics from TradingView
- add alerts to their indicator/strategy
- develop a generic strategy template which can be plugged into (almost) any indicator
My gift for the community today is my Ultimate Strategy Template
Step 1: Create your connector
Adapt your indicator with only 2 lines of code and then connect it to this strategy template.
For doing so:
1) Find in your indicator where are the conditions printing the long/buy and short/sell signals.
2) Create an additional plot as below
I'm giving an example with a Two moving averages cross.
Please replicate the same methodology for your indicator wether it's a MACD, ZigZag, Pivots, higher-highs, lower-lows or whatever indicator with clear buy and sell conditions
//@version=4
study(title='Moving Average Cross', shorttitle='Moving Average Cross', overlay=true, precision=6, max_labels_count=500, max_lines_count=500)
type_ma1 = input(title="MA1 type", defval="SMA", options= )
length_ma1 = input(10, title = " MA1 length", type=input.integer)
type_ma2 = input(title="MA2 type", defval="SMA", options= )
length_ma2 = input(100, title = " MA2 length", type=input.integer)
// MA
f_ma(smoothing, src, length) =>
iff(smoothing == "RMA", rma(src, length),
iff(smoothing == "SMA", sma(src, length),
iff(smoothing == "EMA", ema(src, length), src)))
MA1 = f_ma(type_ma1, close, length_ma1)
MA2 = f_ma(type_ma2, close, length_ma2)
// buy and sell conditions
buy = crossover(MA1, MA2)
sell = crossunder(MA1, MA2)
plot(MA1, color=color_ma1, title="Plot MA1", linewidth=3)
plot(MA2, color=color_ma2, title="Plot MA2", linewidth=3)
plotshape(buy, title='LONG SIGNAL', style=shape.circle, location=location.belowbar, color=color_ma1, size=size.normal)
plotshape(sell, title='SHORT SIGNAL', style=shape.circle, location=location.abovebar, color=color_ma2, size=size.normal)
/////////////////////////// SIGNAL FOR STRATEGY /////////////////////////
Signal = buy ? 1 : sell ? -1 : 0
plot(Signal, title="🔌Connector🔌", transp=100)
Basically, I identified my buy, sell conditions in the code and added this at the bottom of my indicator code
Signal = buy ? 1 : sell ? -1 : 0
plot(Signal, title="🔌Connector🔌", transp=100)
Important Notes
🔥 The Strategy Template expects the value to be exactly 1 for the bullish signal , and -1 for the bearish signal
Now you can connect your indicator to the Strategy Template using the method below or that one
Step 2: Connect the connector
1) Add your updated indicator to a TradingView chart
2) Add the Strategy Template as well to the SAME chart
3) Open the Strategy Template settings and in the Data Source field select your 🔌Connector🔌 (which comes from your indicator)
From then, you should start seeing the signals and plenty of other stuff on your chart
🔥 Note that whenever you'll update your indicator values, the strategy statistics and visual on your chart will update in real-time
Settings
- Color Candles : Color the candles based on the trade state (bullish, bearish, neutral)
- Close positions at market at the end of each session : useful for everything but cryptocurrencies
- Session time ranges : Take the signals from a starting time to an ending time
- Close Direction : Choose to close only the longs, shorts, or both
- Date Filter : Take the signals from a starting date to an ending date
- Set the maximum losing streak length with an input
- Set the maximum winning streak length with an input
- Set the maximum consecutive days with a loss
- Set the maximum drawdown (in % of strategy equity)
- Set the maximum intraday loss in percentage
- Limit the number of trades per day
- Limit the number of trades per week
- Stop-loss: None or Percentage or Trailing Stop Percentage or ATR
- Take-Profit: None or Percentage or ATR
- Risk-Reward based on ATR multiple for the Stop-Loss and Take-Profit
This script is open-source so feel free to use it, and optimize it as you want
Alerts
Maybe you didn't know it but alerts are available on strategy scripts.
I added them in this template - that's cool because:
- if you don't know how to code, now you can connect your indicator and get alerts
- you have now a cool template showing you how to create alerts for strategy scripts
Source: www.tradingview.com
I hope you'll like it, use it, optimize it and most importantly....make some optimizations to your indicators thanks to this Strategy template
Special Thanks
Special thanks to @JosKodify as I borrowed a few risk management snippets from his website: kodify.net
Additional features
I thought of plenty of extra filters that I'll add later on this week on this strategy template
Best
Dave

Backtest Custom HiLo StrategyThis script implements the HiLo trend follower strategy for backtesting the HiLo indicator. It comes with some custom options. Among them is the Type option that allows to choose between the moving averages for the highs and lows (HiLo), or highest and lowest values for those moving averages, respectively (HiLo Activator).