Inside Bar Highlighter by nkChartsOverview:
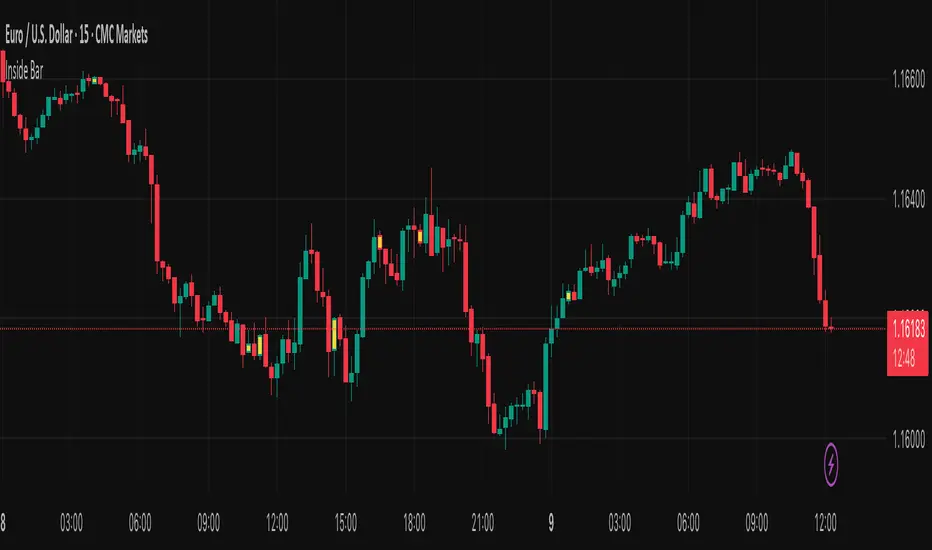
The Inside Candle Highlighter is a simple yet powerful TradingView indicator designed to identify inside bars (inside candles) on your chart. An inside candle is defined as a candle whose high is lower than the previous candle's high and low is higher than the previous candle's low, meaning it forms entirely within the range of the preceding candle.
Inside candles are commonly interpreted by traders as periods of market consolidation or indecision and often precede breakouts or significant price moves. This indicator highlights these candles directly on your chart, making them easy to spot at a glance.
Features
Detects Inside Candles: Automatically identifies bars that are fully contained within the previous bar’s high-low range.
Confirmed Bar Coloring: Colors the candle after it closes, ensuring no repainting occurs during formation.
Style Tab Customization: Users can adjust the candle color directly from the Style tab, allowing seamless integration with your chart theme.
Clean & Minimal: Only inside candles are highlighted, keeping charts uncluttered.
How Traders Can Use It
Identify Consolidation Zones: Quickly spot periods where the market is contracting.
Prepare for Breakouts: Inside candles often signal an upcoming directional move; traders can plan entry or exit points based on breakouts from the inside candle range.
Combine With Other Indicators: Use alongside trend indicators, volume tools, or support/resistance levels to enhance trade confirmation.
Recommended Use
Works on all timeframes — from intraday charts to daily or weekly charts.
Particularly useful in price action trading, swing trading, and trend-following strategies.
Ideal for traders who want a visual cue for consolidation and potential breakout areas without adding complexity to the chart.
Note: This indicator only highlights inside candles. Interpretation and trading decisions are left to the user.
Cari dalam skrip untuk "bar"
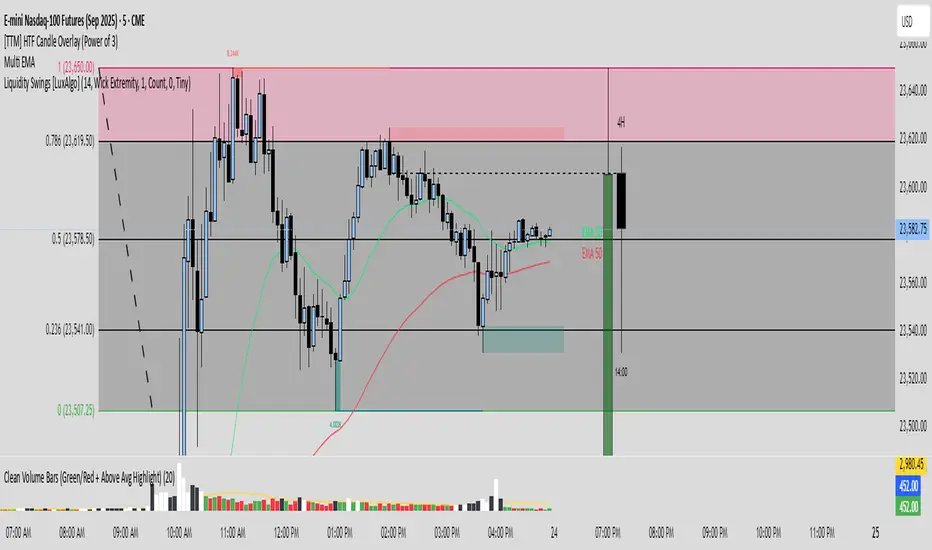
Clean Volume Bars (Green/Red + Above Avg Highlight)📊 Clean Volume Bars (Green/Red + Above Avg Highlight)
This script provides a clearer view of market volume by combining standard green/red volume bars with dynamic highlights for above-average activity.
Features:
✅ Green / Red Volume Bars – standard visualization:
Green when the candle closes higher than it opened
Red when the candle closes lower than it opened
✅ Average Volume Line – a simple moving average (default 20 periods) to track relative volume.
✅ Above Average Highlights – bars that exceed the average volume are emphasized:
White for above-average bullish volume
Black for above-average bearish volume
How to Use:
Look for white volume spikes during up candles → potential strong bullish activity.
Watch for black volume spikes during down candles → potential strong bearish pressure.
Combine with price action, trend, or other indicators for confluence (this is not a standalone trading system).
Coefficient of Variance BarsThe script calculates the Coefficient of Variance (CV), which is the standard deviation (a measure of volatility) divided by the average price over a set period. In simple terms, it tells you how volatile the market is in relation to its current price level.
• Highlighting Volatility Increase: By default, the script colors the bars when this relative volatility makes a new high. This suggests that the market is "waking up" and that a significant price move could be starting.
• Highlighting Low Volatility (Inverse Mode): When you uncheck the box in the settings, it highlights periods where volatility is not making a new high. This is useful for spotting quiet, consolidating markets.
________________________________________
How to Use It in Trading
This indicator is a complementary tool and should be used with other forms of analysis, like price action or trend indicators.
1. Spotting Potential Breakouts
The most common use is to anticipate breakouts. When the price is moving in a tight range (consolidation) and you suddenly see a highlighted bar, it signals a surge in volatility. This is often the catalyst that pushes the price out of the range.
• Strategy: Look for a period of price consolidation. When a bar is colored, indicating a volatility spike, look for a confirmation of a breakout (e.g., a candle closing above resistance or below support) and consider entering a trade in that direction.
2. Identifying Ranging Markets
By switching to the inverse mode, you can easily see when the market is quiet and range-bound.
• Strategy: When the bars are consistently highlighted in inverse mode, it confirms a ranging market. This is the ideal environment for strategies that capitalize on sideways movement, such as using oscillators (like RSI or Stochastics) to trade between support and resistance levels.
3. Gauging Trend Strength and Exhaustion
In a strong, ongoing trend, you'll likely see intermittent volatility spikes confirming the momentum. However, a sudden, massive spike in volatility after a very long trend might signal a "climax," potentially indicating the trend is exhausted and a reversal could be near.

Retracement Bar🔍 Retracement Bar – RB
The Retracement Bar (RB) indicator is designed to highlight potential reversal zones by identifying candles where price shows a clear rejection from the extremes. It helps traders spot moments where institutional inventory rebalancing may be occurring — often a precursor to a strong move in the opposite direction.
RB highlights bars that:
Have a relatively small real body compared to the total candle range.
Show a long wick (upper or lower) that exceeds a user-defined percentage of the candle range.
Suggest a potential rejection of price — upward or downward — based on candle structure.
When these conditions are met, a triangle symbol is plotted:
🔻 Red triangle above a candle suggests a possible short opportunity.
🔺 Green triangle below a candle suggests a possible long opportunity.
This indicator does not repaint and triggers only at candle close.
📈 Example – Long Entry
Signal: A green triangle appears below a candle (suggesting rejection of lower prices).
Steps:
Wait for the current RB candle to close.
On the next candle:
Enter long if price breaks above the high of the RB candle.
Alternatively, wait for a pullback and enter based on confirmation (e.g., bullish engulfing, hammer, trendline bounce).
Place a stop-loss just below the low of the RB candle.
Set a target:
Based on a 2:1 risk-reward ratio.
Or use the next resistance/Fibonacci level.
📉 Example – Short Entry
Signal: A red triangle appears above a candle (suggesting rejection of higher prices).
Steps:
Wait for the current RB candle to close.
On the next candle:
Enter short if price breaks below the low of the RB candle.
Or wait for confirmation (e.g., bearish engulfing, shooting star, breakdown from a level).
Place a stop-loss just above the high of the RB candle.
Set a target:
2:1 risk-reward ratio.
Or the next support/Fibonacci zone.
✅ Recommended Filters for Better Results:
Confluence with support/resistance zones.
Trend alignment or reversal context.
Additional confirmation from price action patterns or oscillators.
Volume analysis for entry strength.
🙏 Acknowledgment
Special thanks to Rob Hoffman for inspiring this concept through his original Inventory Retracement Bar (IRB) idea — this indicator is a reinterpretation meant to visually and practically support discretionary price action traders.

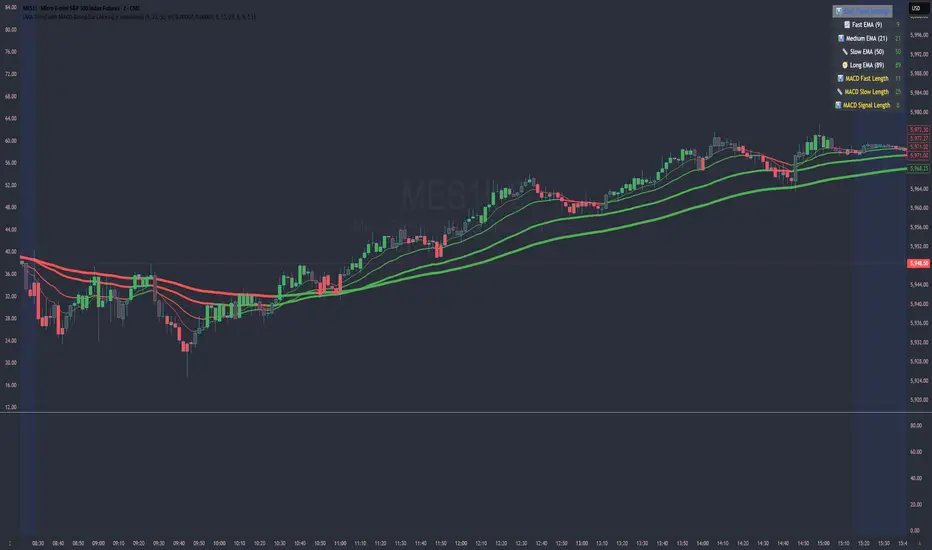
EMA Trend with MACD-Based Bar Coloring (Customized)This indicator blends trend-following EMAs with MACD-based momentum signals to provide a visually intuitive view of market conditions. It's designed for traders who value clean, color-coded charts and want to quickly assess both trend direction and overbought/oversold momentum.
🔍 Key Features:
Multi-EMA Trend Visualization:
Includes four Exponential Moving Averages (EMAs):
Fast (9)
Medium (21)
Slow (50)
Long (89)
Each EMA is dynamically color-coded based on its slope—green for bullish, red for bearish, and gray for neutral—to help identify the trend strength and alignment at a glance.
MACD-Based Bar Coloring:
Candlesticks are colored based on MACD's relationship to its Bollinger Bands:
Green bars signal strong bullish momentum (MACD > Upper Band)
Red bars signal strong bearish momentum (MACD < Lower Band)
Gray bars reflect neutral conditions
Compact Visual Dashboard:
A clean, top-right table displays your current EMA and MACD settings, helping you track parameter configurations without opening the settings menu.
✅ Best Used For:
Identifying trend alignment across short- to medium-term timeframes
Filtering entries based on trend strength and MACD overextension
Enhancing discretion-based or rule-based strategies with visual confirmation
Live Risk/Reward Lines (Dynamic Update: Tick or Bar Close)This script displays dynamic Risk and Reward target lines directly on the chart.
You can choose whether the updates happen live with each price tick or only once a bar closes.
It supports both long and short trading directions, with customizable risk and reward percentages.
Key Features:
Dynamic live updates (per tick or per bar close).
Choose Long or Short trade direction.
Customize risk and reward percentages individually.
Adjustable line length and color.
Option to show or hide risk and reward lines.
How It Works:
For long trades: Risk = Close Price * (1 - Risk %), Reward = Close Price * (1 + Reward %).
For short trades: Risk = Close Price * (1 + Risk %), Reward = Close Price * (1 - Reward %).
Lines are automatically centered around the current bar.
Why It Is Unique:
Unlike static risk/reward indicators, this script allows traders to see real-time dynamic changes based on the latest tick or bar close.
It offers full flexibility for scalpers and swing traders by allowing manual control over update timing and visualization style.
Usage Instructions:
Select your trade direction (Long or Short) from the settings.
Set your preferred risk and reward percentages.
Choose whether lines should update with every tick or only on bar close.
Optionally adjust the length and colors of the lines.
Important:
The script focuses on visualizing risk and reward directly on the price chart without giving buy or sell signals.
Disclaimer:
This tool is intended for educational and informational purposes only and should not be considered financial advice.

7 Inside Bars with Full Range Box (15m)his indicator detects periods of extreme price compression by identifying 7 consecutive inside bars on the 15-minute timeframe. An inside bar is a candle that forms within the high and low of the previous candle. When 7 such bars occur in a row, it's a strong signal of market indecision and potential breakout.
What it does:
Detects if the last 7 candles are all inside the range of the 8th candle (the outer bar).
Highlights the consolidation zone by drawing a fuchsia-colored box from the high to low of the outer candle.
Marks the final candle in the sequence with a small "7IN" label below the bar.
This setup can help traders spot high-probability breakout zones and prepare for potential volatility after extended consolidation.
🔍 Best Used For:
Breakout trading
Volatility expansion strategies
Trade setups following tight consolidation
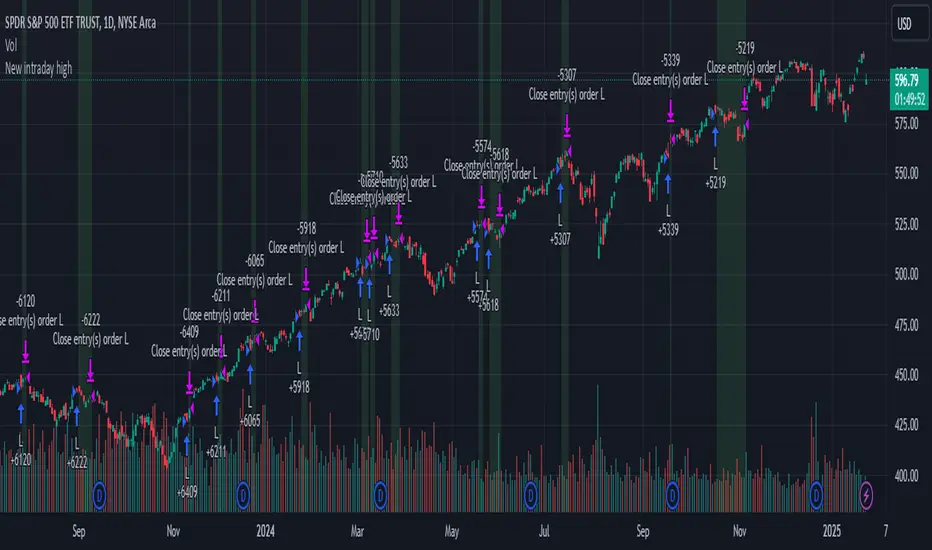
IBS (Internal Bar Strength) Trading Strategy for SPY and NDQImplementation by AlgoTradeKit
Overview
The IBS Trading Strategy is a daily bars long-only trading system, based on the concept of Internal Bar Strength (IBS). The strategy aims to identify potential reversals by monitoring how the previous bar’s close positions itself within its high-low range. It is suitable for stock and US indices. The default parameters are optimized for SPY/SPX and NDQ/QQQ
Strategy Concept
The Internal Bar Strength (IBS) is calculated using the formula:
IBS = (Previous Close - Previous Low) / (Previous High - Previous Low)
This value always lies between 0 and 1. An IBS value below 0.2 is typically interpreted as an oversold condition, while a value above 0.9 suggests an overbought state.
Trading Rules
- Long Entry :
- Condition 1 : IBS is below the user-defined entry threshold (default is 0.2).
- Condition 2 : The current price is above an N-period Exponential Moving Average (EMA) (default period is 252).
- Note : You can disable the EMA condition by setting the EMA period to 0.
- Long Exit
- The position is closed when IBS rises above the user-defined exit threshold (default is 0.9).
Customization Options
- IBS Entry Threshold : Adjust to set the sensitivity for entering a long trade based on oversold conditions.
- IBS Exit Threshold : Customize to define the exit point when the market becomes overbought.
- EMA Period : Set the lookback period for the EMA to align with your trend bias; disable this condition by setting the period to 0.
Risk Management & Trading Considerations
- Designed for daily charts, the strategy captures higher timeframe trends and minimizes noise.
- The entry and exit conditions are straightforward, aiming to avoid over-trading while letting clear signals dictate trade management.
- Always use proper risk management techniques and test the strategy thoroughly on historical data and in a simulated environment before applying it in live markets.
Disclaimer
This strategy is for educational and informational purposes only and does not constitute financial advice. Trading involves risk, and past performance is not indicative of future results. Always conduct your own research and consider your risk tolerance before making any trades.

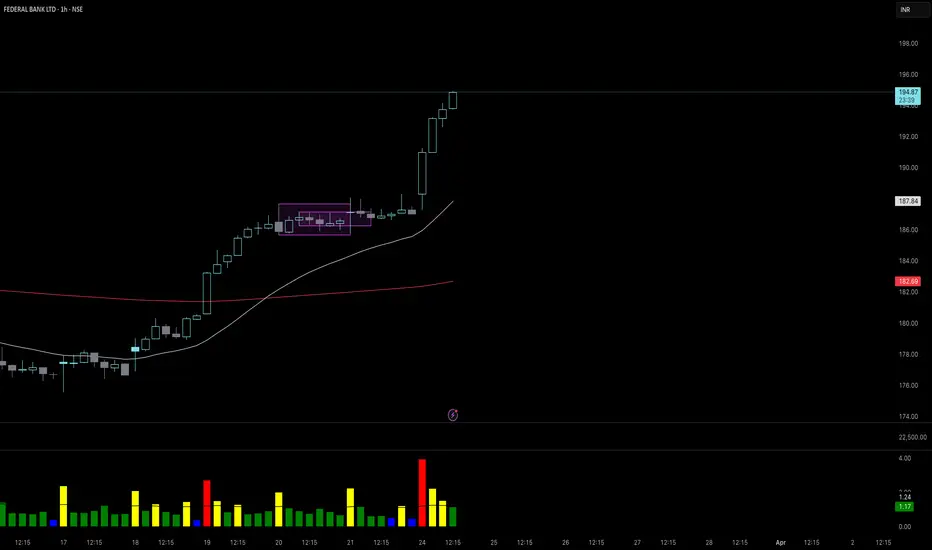
New intraday high with weak barStrategy Logic:
The strategy checks if the current bar’s high is the highest high of the last 10 bar and if internal bar strength is less than 0.15.
Position is closed when close is greater than the previous bar’s high.
When a position is open, the script applies a light green background on the chart to signal that you are in a trade.
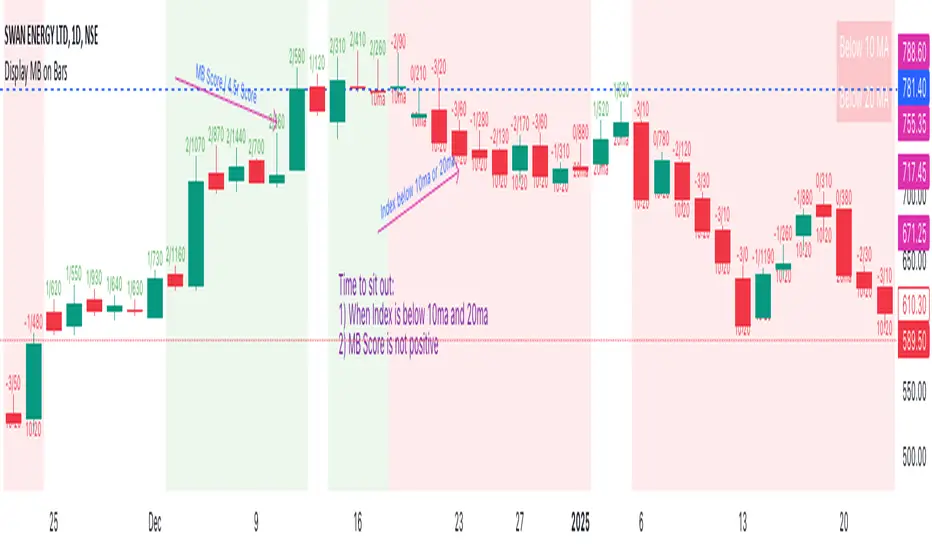
Display MB on BarsDescription
The "Display MB on Bars" Pine Script indicator is designed to visually represent Market Breadth values and R4.5 scores on trading charts. This script enables traders to highlight and analyze key market behavior using pre-defined thresholds for MB scores and dynamically calculated R4.5 values. Additionally, it includes a moving average status table to assess price levels relative to the 10-day and 20-day moving averages.
Features:
1. COB Date Matching: Displays data corresponding to specific "COB dates" provided by the user.
2. MB Value Visualization:
o Highlights bars with a background color based on MB values:
Red if MB ≤ MB_Red (default: -1).
Green if MB ≥ MB_Green (default: 3).
3. R4.5 Scores Display:
o Creates a label on the chart with the MB and R4.5 values when conditions are met (e.g., R4.5 > 200 or specific MB thresholds).
4. Index Moving Average Comparison:
o Calculates 10-day and 20-day moving averages for the selected symbol (default: NSE:NIFTYMIDSML400).
o Shows the price position relative to these moving averages in a table.
How to Use:
1. Configure Inputs:
o COB Dates: Enter a comma-separated list of dates in the format DD-MM-YYYY.
o MB Values: Provide the corresponding MB scores for the COB dates.
o R4.5 Values: Provide the R4.5 scores for the COB dates.
o Set the thresholds for MB values (MB Red<= and MB Green>=).
o Toggle features like MB, RS (R4.5), and the moving average status table.
2. Interpret the Output:
o Observe background colors on the bars:
Red: Indicates MB is less than or equal to the lower threshold.
Green: Indicates MB exceeds the upper threshold.
o Check labels above bars for R4.5 and MB values when conditions are met.
o Refer to the status table on the top-right corner to understand price positions relative to 10-day and 20-day moving averages.
This script is especially useful for traders seeking insights into custom metrics like MB and R4.5, enabling quick identification of key patterns and trends in the market.
Counting Positive and Negative BarsCounting Positive and Negative Bars: It goes through a specified number of bars and counts how many are positive (close above the previous value) and how many are negative (close below the previous value).
Imbalance Criterion: If the count of negative bars exceeds that of positive bars by a configurable margin (such as 60%), it signals a possible buy (Long) condition. The opposite applies for sell (Short) conditions..

Custom MACD Oscillator with Bar ColoringCustom MACD Oscillator with Bar Coloring
This custom MACD indicator is a fusion of two powerful MACD implementations, combining the best features of both the MACD Crossover by HPotter and the Multiple Time Frame Custom MACD Indicator by ChrisMoody. The indicator enhances the traditional MACD with customizable options and dynamic bar coloring based on the relationship between the MACD and Signal lines, providing a clear visual representation of momentum shifts in the market.
Key Features:
MACD Oscillator: Built on the core MACD principle, showing the difference between two Exponential Moving Averages (EMA) for momentum tracking.
Signal Line: A Simple Moving Average (SMA) of the MACD, helping to identify potential entry/exit points through crossovers.
Multiple Time Frame Support: Allows users to view MACD and Signal data from different timeframes, giving a broader view of the market dynamics.
Bar Coloring: Bars are colored green when the MACD is above the Signal line (bullish), red when the MACD is below (bearish), and blue during neutral conditions.
Histogram with Custom Colors: A customizable histogram visualizes the difference between the MACD and Signal lines with color-coding to represent changes in momentum.
Cross Dots: Visual markers at points where the MACD crosses the Signal line for easy identification of potential trend shifts.
This indicator is a versatile tool for traders who want to visualize MACD-based momentum and crossover signals in multiple timeframes with clear visual cues on price bars.

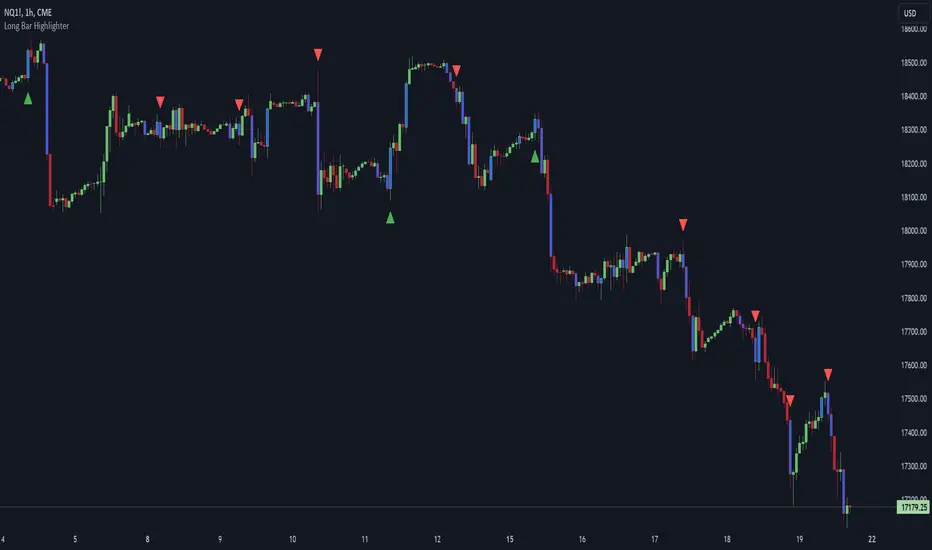
Long Bar Highlighter @shrilssThe Long Bar Highlighter is designed to detect long bars that exhibit significant price expansion beyond recent price levels. It highlights bars that exceed the length of the previous four bars, marking them for their potential importance in market movements. Additionally, the indicator plots directional shapes based on the closing prices, which helps traders visualize potential upward or downward momentum. An optional ATR crossover setting refines these signals, focusing on stronger trends for more optimal trading opportunities.
Ouside Bar First high/low DetectorIndicator wenting to the lower time frame(if compare with current chart time frame) and seek what happened first, the low of previouse bar was updated first or the high of previouse bar.
In some trading strategies need to know exactly sequence of actions for outside bars to program the logic for testing on deep history.
If first was updated the high of previouse bar indicator will draw green diamond above the outside bar. If first was updated the low of previouse bar then indicator will draw red diamon below the ouside bar.
In cases where both side diamonds is plotted it meant the current Lower time frame resolution is not enough to clear figure out what was first Low of High, need choose lower resolution.
I did not found ready to use examples and made my own.
I hope it will be usefull for you.
Best Regards.

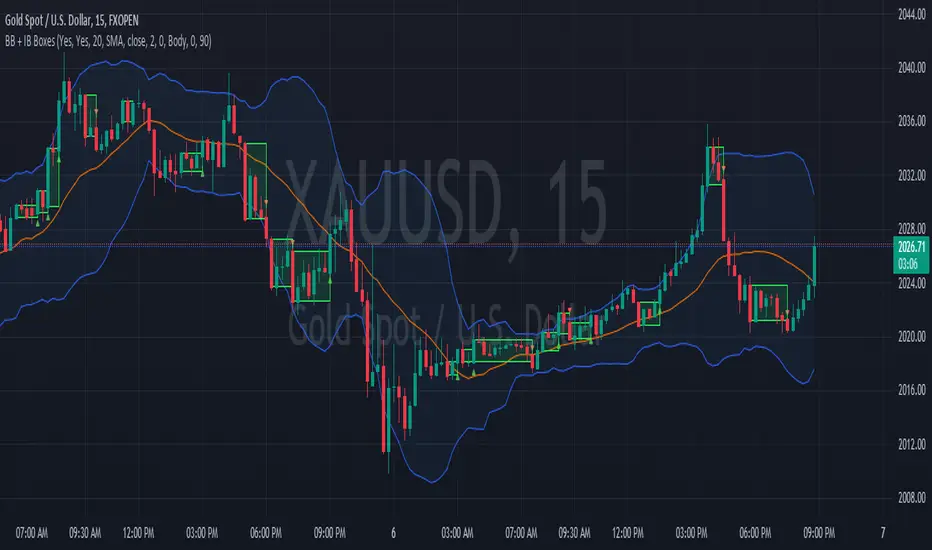
Bolingger Bands + Inside Bar BoxesBollinger Bands are a technical analysis tool consist of three bands—an upper, middle, and lower band—that are used to spotlight extreme short-term prices in a security. The upper band represents overbought territory, while the lower band can show you when a security is oversold. Most technicians will use Bollinger Bands® in conjunction with other analysis tools to get a better picture of the current state of a market or security.
An Inside Bar is a two-bar price action trading strategy in which the inside bar is smaller and within the high to low range of the prior bar. Inside bars show a period of consolidation in a market. They often form following a strong move in a market, as it ‘pauses’ to consolidate before making its next move. However, they can also form at market turning points and act as reversal signals from key support or resistance levels.
UDI barCandle has been divide into 3 types up bar, down bar and inside bar,
These bar classified comparing previous candle high low to current candle close.
This method used to ride the trend without exiting position.
We can use this candle color as a stop loss and take profit.
Previous candle H&L Vs Cur. Candle Close
I
U
D
------------------------
I - Inside Candle
U - Up Candle
D - Down Candle

Inside Bar FinderInside bars occur when the range of a candlestick falls entirely within the previous candlestick's range. This indicates volatility contraction which often leads to volatility expansion, i.e. large price movements.
This indicator includes options such as:
- The number of consecutive inside bars required to trigger the indicator
- Signal lines to indicate the high and low of the outermost or innermost bars
Try out this indicator with different options on different timeframes to see if inside bars increase the probability of identifying the direction of price movements. Breaks or closes outside the inside or outside signal lines can be used to trigger trade signals.

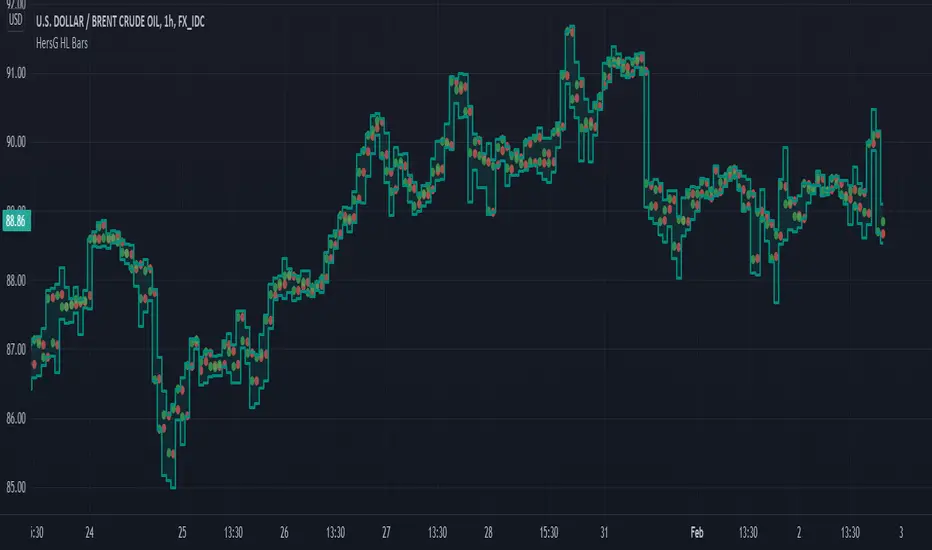
HersG High Low Bar Charts Layout
Hello friends,
The following indicator will create a new form of chart layout in High & Low as candle-like full bars instead of Open and Close. There are no wicks, only full bars highlighting High and Low of the select time frame. Two dots inside a bar will represent Open (Red dot) and Close (Green dot).
How can it help you as a trader?
High and Low candle-like bars will clear the noise from charts in identifying support & resistance, higher-highs and lower-lows will be clearly visible thus helping you make trades.
First add the indicator and then hover the mouse pointer over the ticker in the charts and click on the “eye-shaped” symbol to hide the candlesticks chart pattern.
The type of chart layout is standard charts. Data are not re-calculated or manipulated.
Regards!
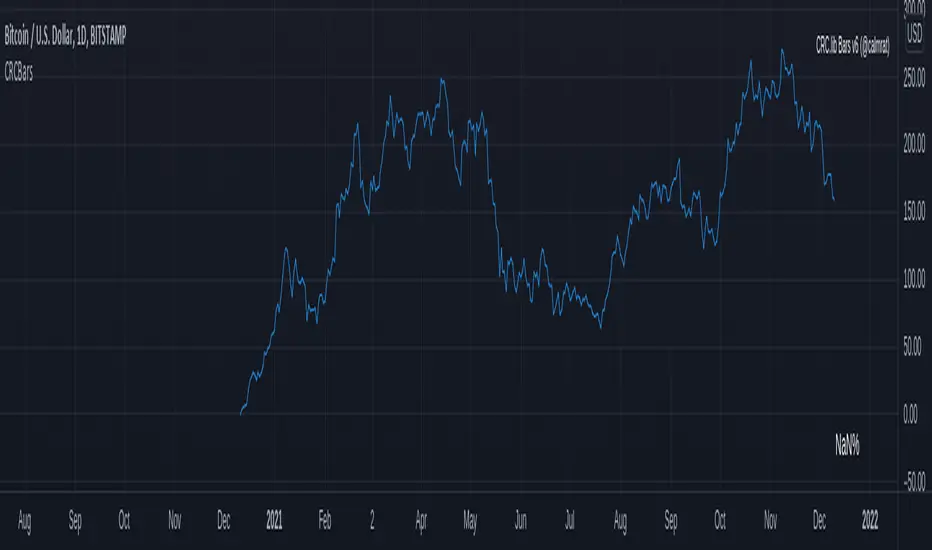
CRC.lib Bars - Bar FunctionsLibrary "CRCBars"
min_max(open, open) Get bar min (low) and max (high) price points
Parameters:
open : Open price data
open : Close price data
Returns:
is_bullish_bearish(open, open) Get bar bullish/bearish boolean signals
Parameters:
open : Open price data
open : Close price data
Returns:
sizes(open, open, open, open) Get bar sizes based on open/high/low/close data
Parameters:
open : Open price data
open : High price data
open : Low price data
open : Close price data
Returns:
10X Bars - Directional TrendsMy interpretation of John Carter's popular Simpler Trading 10X Bars indicator.
Momentum is displayed to quickly see the quality and strength of a trend based on a calculation of the Directional Movement Index (DMI). The DMI is an indicator developed by J. Welles Wilder in 1978 that identifies in which direction the price of an asset is moving. The DMI is calculated by comparing prior highs and lows and produces 2 measurements illustrating the strength of the current trend:
-> a positive directional movement line (+DI); and
-> a negative directional movement line (-DI).
The average directional index (ADX) measures the strength of the current trend, either +DI or +DI; a reading above 20 typically indicates a strong trend.
-> Green bars indicate an uptrend i.e. when +DI is above -DI and ADX is greater than 20 - there is more upward pressure than downward pressure in the price;
-> Red bars indicate a downtrend i.e. when -DI is above +DI and ADX is greater than 20 - there is more downward pressure on the price; and
-> Yellow bars indicate no strong directional trend and potential for a reversal.
Volume spikes 50% above average volume are then flagged as dots at the bottom of the chart (although you can change this location), confirming the momentum further.
This indicator should compliment other popular indicators, as confirmation whether to stay in a position or not.

Pin Bar//Pin Bar at the edge of BB
//Conditions to check
// 1. It must be a Pin Bar
// 2. Price Above/Below 200 SMA
// 3. Volume must be above 20 SMA
// 4. Low/High of the Pin Bar must cut across the BB upper/lower band
// 5. The very next candle closes above/below the high/low of the pin bar candle
Recommended timeframe - Daily and Weekly

4 SMAs & Inside Bar (Colored)SMAs and Inside Bar strategy is very common as far as Technical analysis is concern. This script is a combination of 10-20-50-200 SMA and Inside Bar Candle Identification.
SMA Crossover:
4 SMAs (10, 20, 50 & 200) are combined here in one single indicator.
Crossover signal for Buy as "B" will be shown in the chart if SMA 10 is above 20 & 50 and SMA 20 is above 50.
Crossover signal for Sell as "S" will be shown in the chart if SMA 10 is below 20 & 50 and SMA 20 is below 50.
Inside Bar Identification:
This is to simply identify if there is a inside bar candle. The logic is very simple - High of the previous candle should be higher than current candle and low of the previous candle should be lower than the current candle.
If the previous candle is red, the following candle would be Yellow - which may give some bullish view in most of the cases but not always
If the previous candle is green, the following candle would be Black - which may give some bearish view in most of the cases but not always
Be Cautious when you see alternate yellow and black candle, it may give move on the both side
Please comment if you have any interesting ideas to improve this indicator.

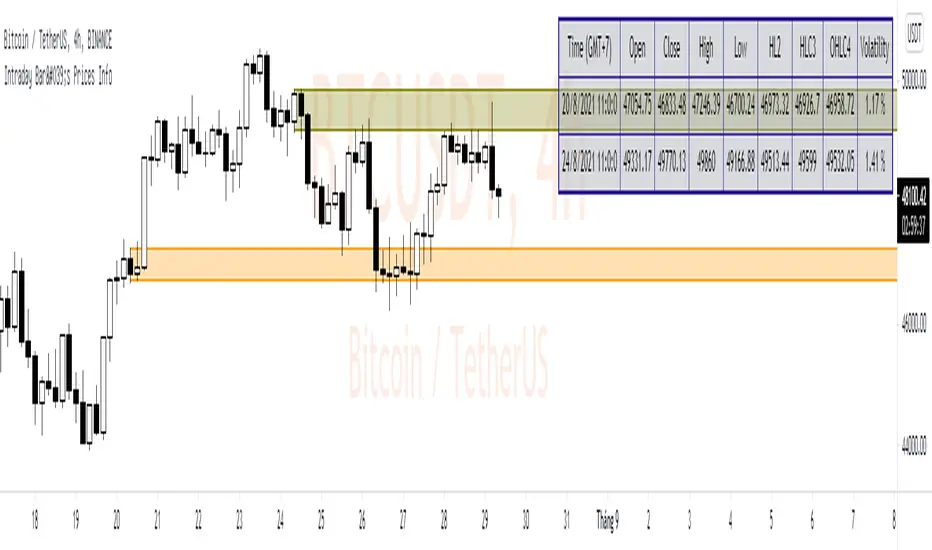
Intraday Bar's Prices Info* Intraday Bar's Prices Info display all prices type of a bar intraday and highlight Price Zone on Chart.
* These informations may useful for place Pending Order at exact price level.
* This simple script can show info of 2 bars at one time and setup as below:
1. GMT: default is GMT+7 and adjustable
2. Time setting: Date - Month - Year - Hours - Minutes - Seconds
3. Color setting: Can adjust color for each bar