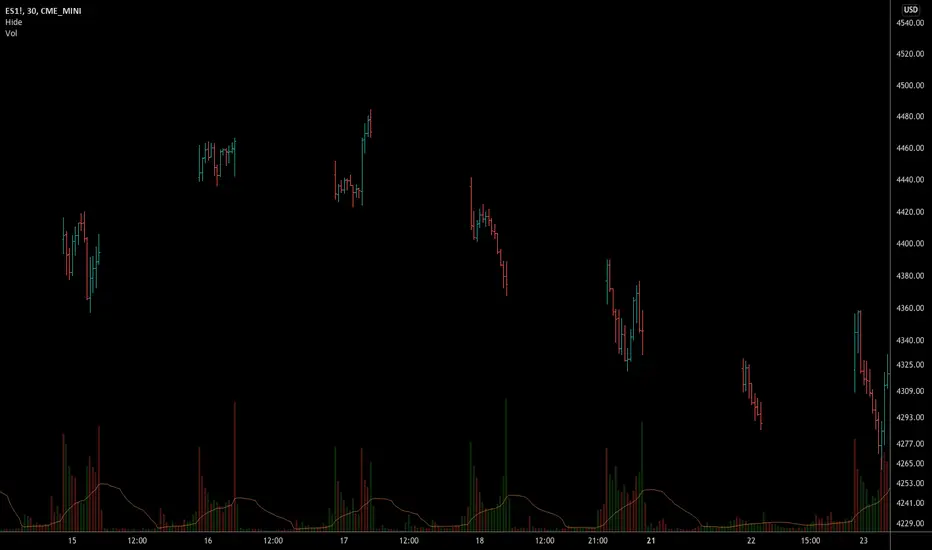
Hide extended hours/non-intraday barsEspecially for future users, such as ES/NQ/RTY/YM, etc., this script can hide the extended hours/non-intraday bars and leave the intraday bars only.
With this script , you can find the intraday support/resistance quite easily!
Example, if you are a ES investor, you can easily find the intraday support/resistance level ,which is almost equal to SPY, with this script, and no need to check SPY separately again , saving your time a lot.
Note: Please couple this script with American Bars. If you use candle charts, the upper/lower pins of the candle can't be hidden with the bars together, which is restricted by the code editor itself...
Cari dalam skrip untuk "bar"
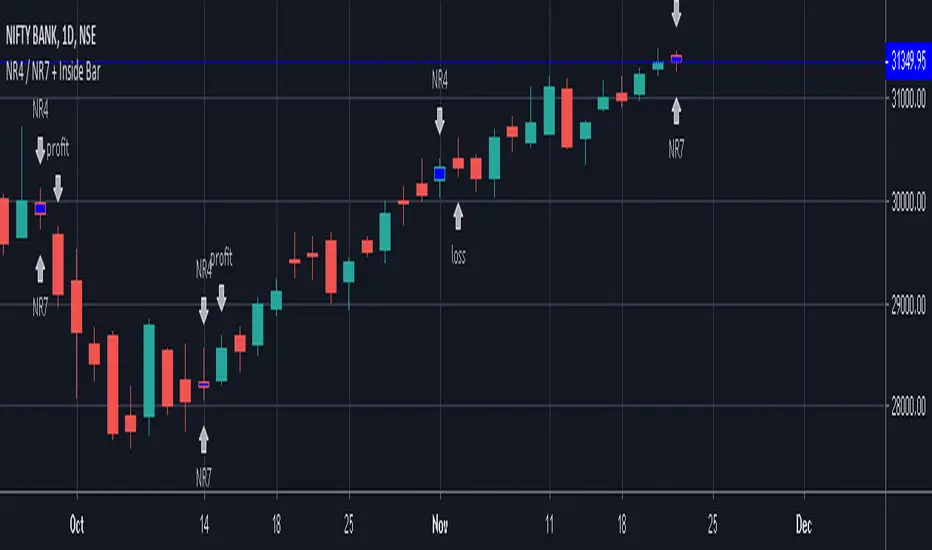
NR4 / NR7 + Inside BarIndicator Script for identifying Narrow Range 4 / 7 + Inside Bar
It also helps to check whether NR4 / NR7 breakout trading has been profitable or not in the past in a particular instrument.
It has helped me to select profitable scripts and avoid losing ones. Can be used for anytime frame.
SIGNAL
NR4 == Narrowest range of 4 periods + signal day is an inside bar
NR4 & NR7 == Narrowest range of 7 periods + signal day is an inside bar
SIGNAL "PROFIT" -
Prior day was NR4 / NR7 and next day price broke out of prior day range in 1 direction and closed in the direction of breakout away from breakout price, resulting in a profit trade.
SIGNAL "LOSS" -
Prior day was NR4 / NR7 and next day price broke out of prior day range and returned back to close inside the narrow zone OR went in opposite direction after the initial breakout, resulting in a loss trade.
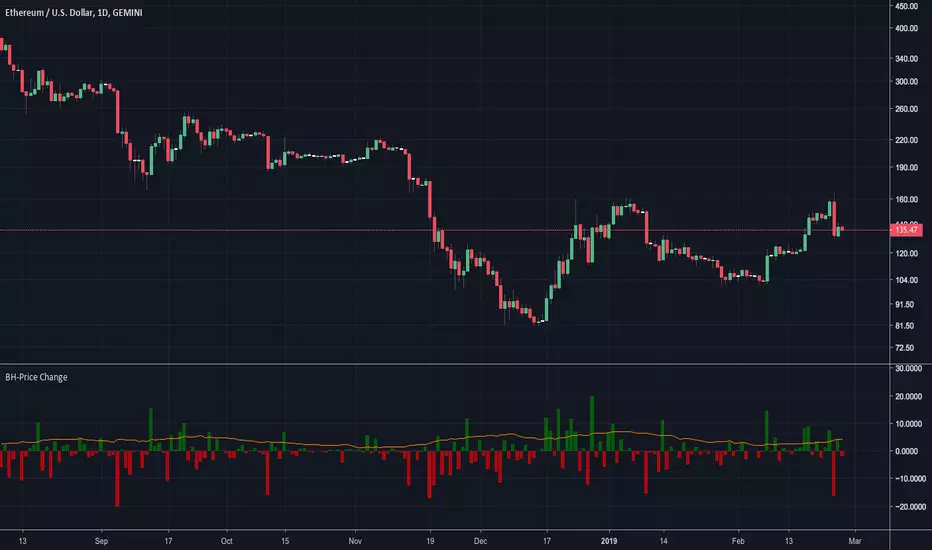
BossHouse - Price ChangeBossHouse - Price Change
What it is:
In the stock market, a price change is the difference in trading prices from one period to the next or the difference between the daily opening and closing prices of a share of stock.
Here you have a timeline with a bar price change. In seconds you can see if the selected market has good and high price changes or not.
The values are in percentage and you have a limiter in the settings, so you can show only bar/values above a value. Ex. 2.4%.
Why it Matters:
Price changes are a core component of financial analysis, and predicting price changes can be as, if not more, important than an actual price change.
It is important to remember, however, that percent-based price changes are useful only in the context of the number of dollars involved.
A 75% change in the price of a company X, for example, may only involve a few dollars while a 75% change in the price of company Y may involve thousands of dollars.
Settings:
Show the SMA 21 line
Minimum Limit - Set the minimum value to show a bar
Calculation:
For example, let's say Company XYZ shares opened at $25 this morning and closed at $24.
The price change is -$1, or -$1/$25 = -4%.
Any help and suggestions will be appreciated.
Marcos Issler @ Isslerman
Volume Profile: Intra-bar VolumeThis indicator was developed as part of a free blog post tutorial on the Backtest-Rookies website for detailed code commentary, head over there.
Scope
The indicator shall attempt to do the following:
Look at a lower time-frame. E.g 5 minutes when on a 1-hour chart.
Create a function to loop through through candles and make an assessment.
If the candle it closed up, the volume will be categorized as buying volume. Conversely, if it closed down, the volume will be categorized as selling volume
The function will then be passed to the security() function to run on a lower timeframe.
All buying volume and selling volume from the lower time-frame shall be summed and displayed on the main chart.
Important Note
This indicator will not give you genuine buying or selling volume. It simply follows the assumption that if price closed up, there must have been more buyers than sellers and if it closed down we assume the opposite.
Usage
In order to use this indicator, users will need to calculate how many lower time-frame bars are contained in the time-frame on the main chart. So for example, the default settings are configured for the indicator to be run on the 1H chart. As a result, we need to set the "Bars on Lower Timeframe" input to 12. This is because there are 12 x 5-minute bars in 60 minutes.

draw line at bar on condition, up to 40 bars in lengthDraws line at bar on condition, up to 40 bars in length.
Well, that's not a line, but a set of `—` characters. But it looks like a line, so it is line.
Green BarsA simple script to count the number of up days, or intraday bars, (Green Bars) for a given Look Back period.
Inputs are: Look Back Period and Increment.
Use 0 for the Increment to count only the up days, or bars.
Use -1 to include the down days, or bars, in the sum.

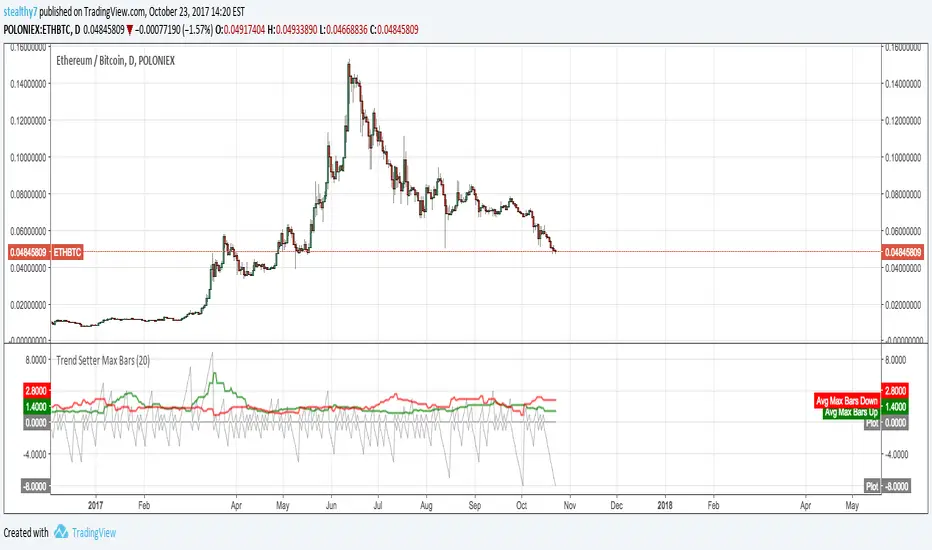
Trend Setter Max BarsThis script allows you to visualize trends. It counts continuous bars in the same direction, then makes an average of the maximum count in the look back period. If Green is above Red, its strength is upward and vice versa. This doesn't use returns or measure price moves.
*Positive Gray is current up bars count. Negative Gray down current down bars count
*Green and Red are average max counts.
This info could possibly be used to gauge trends or momentum.
Note: I finally figured out how to use loops and mutable variables in V3.
[RS]Dollar Basket - Bar by Bar Percent ChangeDisplays a horizontal selection of instruments Vs the dollar, value is percent change from bar to bar with option to smooth the data with a simple average.

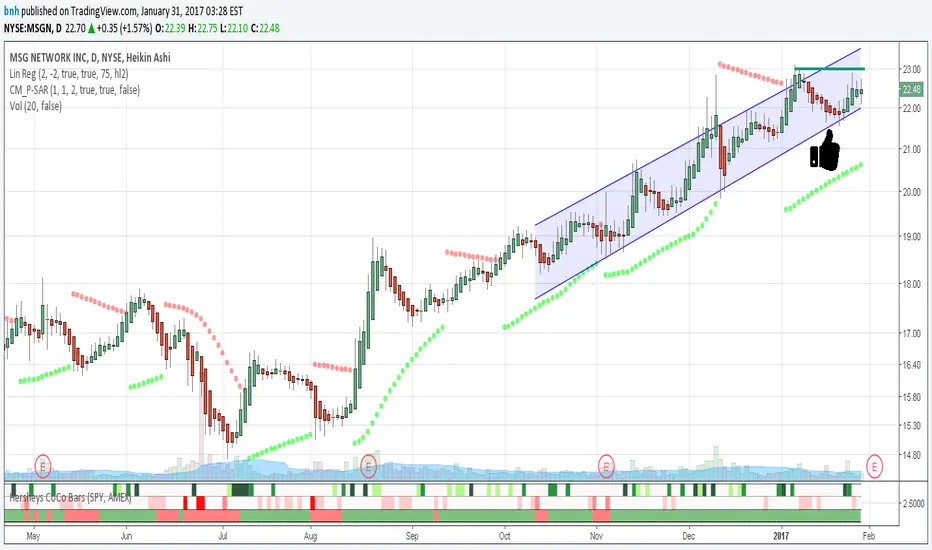
Hersheys CoCo BarsThis is my latest attempt to show price movement differences between symbols. I want to see the buying and selling pressure... is that price movement going with the market or is it moving alone? It's VERY interesting to watch this indicator and see how things play out!
In my previous versions the arrows on the chart were too much clutter, while the single row of color under the chart was not enough info. Also, I removed the calculations to build a world index because the correlation between US and world markets is a hard nut to crack, plus it took many seconds to calculate.
So here is "CoCo Bars", which clearly show price moves with or against another symbol. The default symbol is the US index SPY. The coolest thing here is there are three rows of data in ONE INDICATOR! Many thanks to user rollas for helping with that code.
"CoCo" stands for correlation coefficient, which is what I was studying when I got the idea for this project.
GREEN bars in row #1 = Symbol up, US up, Symbol up more than US
RED bars in row #2 = Symbol down, US down, Symbol down more than US
In rows 1 and 2 the color intensity is based on the biggest difference, light, medium and dark colors.
green/red colors in bottom row are a 7 period average of the sum of price changes of both symbol and index, green = positive, red = negative
Enjoy, and good trading!
Brian Hershey
Price Action Awesome IndicatorThis indicator is everything you need to do Price Action Trading.
It provides signals about:
Inside Bars
Pin Bars
Fakey Pin Bars (background color red or green for bearish or bullish fakeys)

Fakey pattern (Inside Bar False Breakout)Inside Bar + False-Breakout = Fakey pattern
A Fakey pattern can have a pin bar as the false-break bar or not. Fakey’s are a very important and potent price action trading strategy because they can help us identify stop-hunting and provide us with a very good clue as to what price might do next.

UCS Squeeze BarThis indicator is a request from tvmember jackvmk. Credits to jackvmk.
Squeeze bar = a bar which encompasses 5, 10, 15, 20, 30, 40 SMA
Squeeze bars high and lows are support and resistance. when price break one of them, this direction is direction of explosion.
I have added a further more customization
1. Using EMA instead of SMA
2. Using Heikin Ashi Optimization
3. Using Realbody (ignore wicks)
4. Plot the MA Ribbon

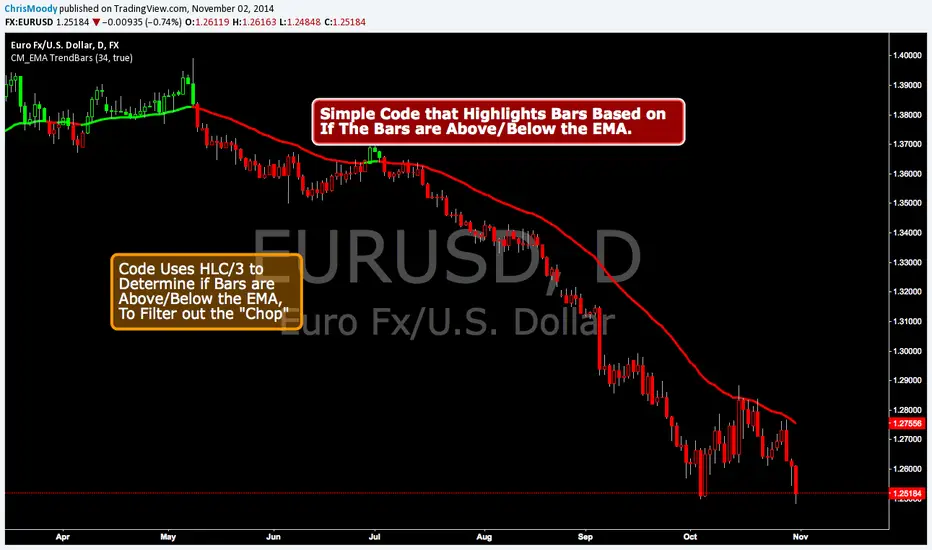
CM EMA Trend BarsThis Code Simply Changes the Bar Colors based on if the Bar is Above or Below the EMA.
Inputs via the Inputs Tab:
Ability to change the EMA Period.
Ability to Turn On/Off the EMA Plotted on the Screen
***Note - I used the HLC/3 To determine if the bar/candle is above or below the EMA. This Filters out the Chop and gets rid of many of the False Breaks above or below the EMA.
Pivot Levels Real-Time Latest Bar (Skip Current, With Zones)ddPivot Levels Real-Time Indicator with Shaded Zones
Author: Ammar Hasan
Overview
The Pivot Levels Real-Time Indicator is a TradingView Pine Script (v5) indicator that plots classic pivot levels using the most recently confirmed bar while skipping the currently forming bar.
It enhances the chart with shaded zones between pivot levels to help visualize potential support, resistance, and price reaction areas.
Key Features
Uses the latest confirmed bar only (no repainting)
Plots Pivot, S1, S2, S3 and R1, R2, R3
Displays shaded zones between levels
Automatically removes old drawings to keep the chart clean
Lightweight and suitable for lower timeframes
No labels for a clean visual layout
Pivot Level Calculations
Pivot (P) = (High + Low + Close) / 3
Support Levels
S1 = 2 x Pivot - High
S2 = Pivot - (High - Low)
S3 = Low - 2 x (High - Pivot)
Resistance Levels
R1 = 2 x Pivot - Low
R2 = Pivot + (High - Low)
R3 = High + 2 x (Pivot - Low)
All values are calculated using the last confirmed candle to ensure stable, non-repainting levels.
Visual Components
Lines
The pivot line is drawn in yellow and slightly thicker for emphasis.
Support lines are drawn in red.
Resistance lines are drawn in green.
Shaded Zones
Resistance Zones
R3 to R2
R2 to R1
R1 to Pivot
Support Zones
Pivot to S1
S1 to S2
S2 to S3
These zones help visualize supply and demand areas and potential price reaction zones.
Use Cases
Intraday trading
Scalping
Support and resistance analysis
Price action confirmation
Notes and Limitations
Levels update once per confirmed candle
Zones are drawn only for a short forward range by default
This indicator is not intended to be used as a standalone trading system
Conclusion
The Pivot Levels Real-Time Indicator with Shaded Zones provides a clean and reliable visualization of key market levels while avoiding repainting. The shaded zones add depth and context, helping traders better understand price behavior around important levels.
Developed by Ammar Hasan

Print Bar DataThis script print out the recent bar data. You can configure the position, bar numbers, of the data


Al Brooks - Bar CountIndicator Purpose:
This indicator displays bar counts on the chart to help traders identify important time nodes and cycle transitions
Features smart session filtering with automatic futures/stock detection and appropriate trading session counting
Core Features:
Smart asset detection: Auto-detect futures and stocks
Session filter toggle: Choose all-day or session-specific counting
Auto timezone handling: Chicago time for futures, NY time for stocks
Flexible display control: Customizable display frequency and label size
Session Settings:
8:30-15:15 (CT) / Futures mode: Chicago time 8:30-15:15 (CT)
9:30-16:00 (ET) / Stock mode: New York time 9:30-16:00 (ET)
All-day mode: Count from first bar of the day
Timeframe Correspondence:
Multiples of 3: Correspond to 15-minute chart update cycles
Multiples of 12: Correspond to 1-hour chart update cycles
18: Key nodes, important time turning points

Price Action - Bar CountDrawing from Al Brooks' emphasis on session rhythms in his books, this counts bars from market opens, resetting at US (0930-1600 ET), HK (0930-1200,1300-1600 HKT), or London (0800-1630 GMT) if selected. Labels every N bars (default 2) below, with custom colors per session and after-hours gray. Up to 79 in regular color, then faded. Helps track opening range tests and two-legged moves—focus on first hour dynamics for high-probability trades.

Price Action - Trend BarFrom Al Brooks' "Trading Price Action Trends," this indicator colors strong trend bars. Bull trend bars (green body ≥50%, close ≥60% up range, larger than 1.5x average) highlight buyer control, while bear trend bars (red body ≥50%, close ≤40% down range) show seller dominance. Use to identify trend resumption or climaxes. Philosophy: Trends persist until tested—focus on high-probability entries after pullbacks, avoiding barbwire noise.

Price Action - Reversal BarInspired by Al Brooks' "Trading Price Action Reversals," this indicator detects potential bull and bear reversal bars. Bull reversals require a green bar with close above mid-range, small upper tail (≤30%), large lower tail (≥30%), and low below previous low without significant overlap. Bear reversals are the opposite. Triangles mark these setups for early reversal signals in trends or climaxes. Remember, markets test extremes—use with trend lines for confirmation, as single bars are often traps without a second leg.

EMA20 (Cur/1H/D) + 5m Bar CountPlots EMA20 for current TF, 1H, and Daily, plus a 5-minute bar counter starting from 09:30 NY time, showing every Nth bar (default 2).

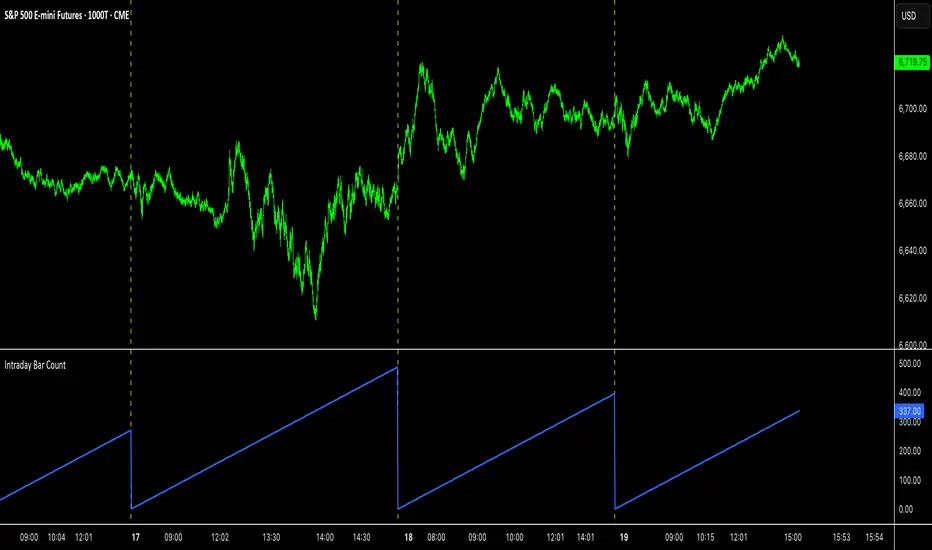
Intraday Bar CounterThis indicator plots a counter on the chart that tracks the number of bars since the beginning of the current day.
The counter resets to zero on the first bar of each new calendar day (midnight). This functionality is provided only on intraday and tick charts.
The indicator is designed to operate on a wide range of symbols without requiring manual adjustments for specific trading sessions.
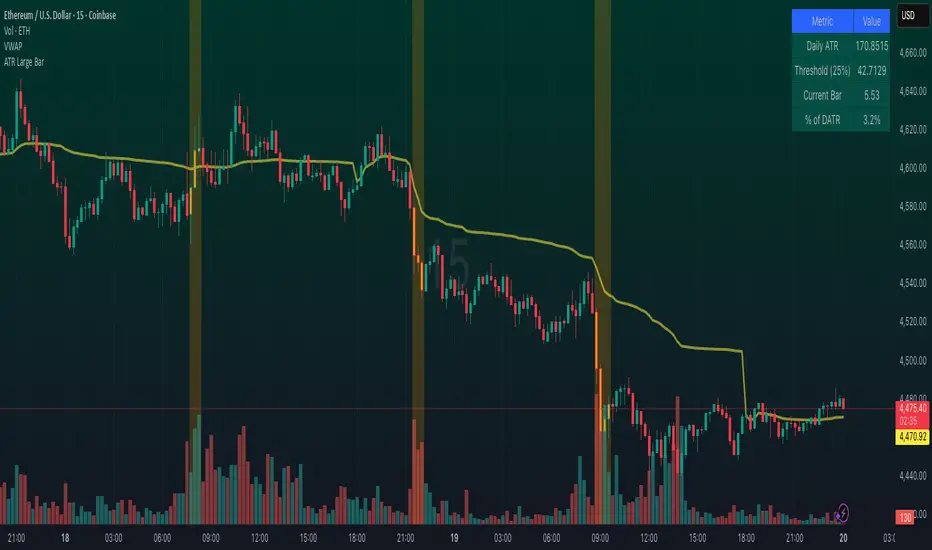
Large Bar ATR HighlighterAn advanced volatility indicator that highlights bars based on their size relative to Daily ATR (Average True Range).
Features configurable lookback periods to detect cumulative volatility across multiple bars, with visual highlighting, background coloring, shape markers, and comprehensive status line data. Perfect for identifying significant price movements and volatility clusters in any timeframe. Includes real-time table with threshold monitoring and alert capabilities.