three bar breakout diegothree bar breakout linda
this indicator ienables me to see this chart pattern, inside day within two previous bars
Cari dalam skrip untuk "bar"
Inside Bar HighlightInside Bar have at least 2 candles.
They include one mother candle and multiple child candles. Mother candle will cover whole child candles ( child candles have high and low within mother candle)
This script will highlight Inside Bars
How to use :
When we analyze market structure, we can combine mother candle and children candles and see them as a candle.
This script will help us do this easily.

% Per BarThis script compute the average price swing per bar (between High and low)
It does not include gaps between bars in the calcul

ADX Color Coded BarI use the Average Directional Index quite a lot in my trading both manual and automatic trading so i thought i would make it a little easier for myself and others to see if the ADX is above or below a certain value and to allow space on the chart for other indicators. This is done by plotting a green and red bar, green when the ADX is above a certain value and red when the ADX is below it.
Trading in the direction of a strong trend reduces risk and increases profit potential. The ADX is used to determine when the price is trending strongly. In many cases, it is the ultimate trend indicator. After all, the trend is your friend. ADX is usually plotted as a single line with values ranging from a low of zero to a high of 100. ADX is non-directional and registers trend strength whether price is trending up or down.
When the value of the ADX is going up above 20 which is the threshold i like to use, it means that there is more likely to be a confident move. So if you get an entry signal when the ADX bar is red the price is more likely to be in an area of consolidation where fakeouts could happen. It might be a good idea to stay away from entering trades here or remember to take some profits early and set the stop loss to break even.
Keep in mind that the ADX is a lagging indicator and not leading.

No Active BarThis is probably the only script on TradingView that's clinically proven to lower your blood pressure!***
This script in conjunction with some chart settings changes can completely hide the active candle, only showing historic candles, thus, reducing risk of cardiac arrest and or panic attack.
What to do:
0. Make sure you are using a candlestick chart or this script won't work properly
1. Right click the chart and select "Settings..."
2. Select "Symbol" under the "Chart Settings" menu
3. Disable every item EXCEPT for the "Body"
4. Click on the boxes next to "Body" to access the color picker then change both box's transparency settings down to 0
(the script only colors closed bars, so the active bar will be present just transparent)
5. Right click on the price scale on the far left or far right side of the screen and hover the mouse over "Labels". If any selections have a check mark next to them click them to disable them (especially the "Ask & Bid" price setting since it tracks current price)
That's it! Instead of wicks the High & Low prices are plotted above and below the candles using a step line. It looks a bit strange at first but you'll get used to it. Check out the indicator settings to change the color and style of the High & Low lines.
***The statement could prove true for some but is mostly complete bullshit

Bollinger Band with Moving Average & Pin BarsThis indicator was specifically built to be used for trading the Scalpius Trading System promoted by @scottphillipstrading. Additionally I've added Daily and Weekly Highs, Lows and Central Pivot lines
The central indicators used in the Scalpius trading system which are included here are: The Bollinger Band, chart plotting of Pin Bars (Hammers & Shooting Stars) and an Exponential Moving Average.
In the settings the user has the option select EMA, SMA or WMA along with desired length, the default settings are 8EMA as per the Scalpius system rules. Also the Bollinger Band settings can be amended by the user and the Pin Bar chart plots and daily + weekly high and low plots can be removed by the user.

Aggregated Volume Based Coloured Bars - InFinitoModified version of Kivanc's Volume Based Colored Bars that colors the bars with Aggregated Volume Data.
Aggregation code originally from Crypt0rus
***The indicator can be used for any coin/symbol to aggregate volume , but it has to be set up manually***
***The indicator can be used with specific symbol data only by disabling the aggregation option, which allows for it to be used on any symbol***
- Calculated based on Aggregated Volume instead of by symbol volume . Using aggregated data makes it more accurate and allows to see if the move was supported (Volume-wise) in all exchanges.
- As well, in order to make the data as accurate as possible, the data from each exchange aggregated is normalized to report always in terms of 1 BTC . In case this indicator is used for another symbol, the calculations can be adjusted manually to make it always report data in terms of 1 contract/coin.

High Volume BarsThis script colors bars whenever their volume has exceeded more than a standard deviation (or multiples of it) from a given amount of bars in the past.
Volume is commonly used as confirmation for a break of a significant level, or as indicative of offside positions when a level fails to be defended. Conviction or Excess, depending on the context.

RedK Dual VADER with Energy Bars (VADER-DEB)VADER-DEB is not really a new indicator - This is a "visually enhanced" version of the Volume-Accelerated Directional Energy Ratio (VADER) I recently published - here's the direct link to read more about how RedK VADER works and how to use it (click the chart below to visit the link)
The visual improvements I added in VADER-DEB helps bring more insight about the market action by
1) exposing the dual/long VADER plot by default (which we use as a proxy for sentiment) - and it shows now as an area (instead of a histogram) - You can still hide the sentiment plot in indicator settings
and
2) by using directional "energy bars" (instead of energy lines in v3.0). Optional Red/Green DER Lines are available in study settings and are hidden by default.
So this is Dual VADER w/ Energy Bars -- or VADER-DEB for short.
These changes may be considered by some as small, but in my view, I found them to be more visually appealing and better for "driving action" - This works better for me as a visual person - so i thought to share with others who may be like me .. This is why i decided to publish this as a separate version and not as an update to the existing indicator - so you can make the choice which one you prefer to use.
There's no change in the core calculation within the code. As shown by the chart above where we compare both VADER versions side-by-side.
If you're happy with VADER v3.0, please feel free to continue to use it.
good luck !

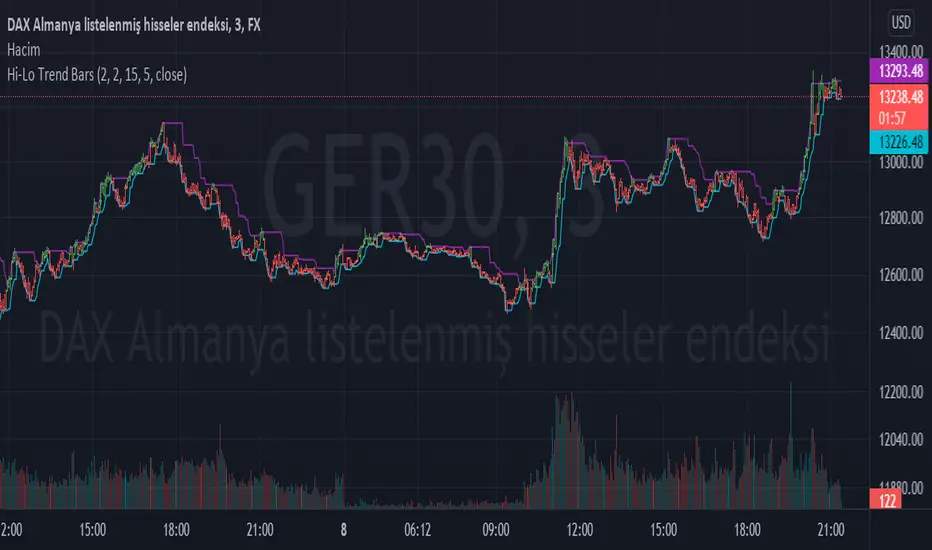
Hi-Lo Trend BarsI present to you a simple but useful indicator.
The basic logic is an indicator that tracks the high of the high bars in the specified range and the low of the low bars in the specified range.
I used two multipliers in order to go out of certain ranges and I tried to provide precision by subtracting this multiplier value from the lowest and highest values.
I set the steps of the multipliers to 0.01 so that it is easy to use on instruments that require finer tuning.
Because every instrument has its own dynamics. You should change the multiplier values according to the instrument dynamics.
For example, under Spot, these multiplier values work efficiently with a large multiplier such as 2.0. It is more efficient in the range of 0.1 - 0.2 in the stock market.
I hope your transactions will be of some use in directional evaluation.
Thanks.
Naked Bar Upward ReversalAMEX:SPY
The Naked Bar Upward Reversal is a three bar candlestick pattern with an inside candle as a entry point. This pattern is bullish since it has a candle closing red from the previous candle; the most bearish pattern possible. The following inside candle is a reversal of its previous candle with an open above the previous candle's close. Look to buy the next open above the inside candle's close.
This is a bullish reversal pattern and should be used in this context. Successful entries are found in corrections along an upward trend, or buying into a dip. Performance drops when the pattern appears at tops. To improve profitability, use a cluster of evidence to enhance the performance of this pattern. The intended time frame is within the daily and weekly.

How Old Is this Bull Run Getting? Check MA Test Bars SinceThere are many price-based techniques for anticipating the end of a move. However, the simple passage of time can also help because bull markets don’t last forever. While old age doesn’t necessarily cause investors to sell, a reversal becomes more likely the longer a trend lasts.
So, how long have prices been going up? There are various ways to measure that. Our earlier script, MA streak , offered one solution by counting the number of bars that a given moving average has been rising or falling.
Today’s script takes a different approach by counting the number of candles since price touched or crossed a given moving average. It tracks the 50-day simple moving average (SMA) by default. It can be adjusted to other types like exponential and weighted with the AvgType input.
In the chart above, Bars Since MA Test was adjusted to use the 200-day SMA. Viewing the S&P 500 with this study helps put the current market into context.
We can see that prices last touched the 200-day SMA 386 sessions ago (June 29, 2020). That’s relatively long based on history, but not unprecedented. For example, the indicator was at 407 in February 2018 as the market pulled back. It also hit 475 in October 2014 (following the breakout above 2007 highs).
Additionally, the S&P 500 is nearing the record of the 1990s bull market (393 candles on July 12, 1996).
Before that, you have to look all the way back to the 1950s, when it twice peaked at 627.
The conclusion? The current run without a test of the 200-day SMA is above average, but not yet record-setting. It may be interesting to watch as earnings season approaches and the Federal Reserve looks to tighten monetary policy.
TradeStation is a pioneer in the trading industry, providing access to stocks, options, futures and cryptocurrencies. See our Overview for more.
Important Information
TradingView is not affiliated with TradeStation Securities Inc. or its affiliates. TradeStation Securities, Inc., TradeStation Crypto, Inc., and TradeStation Technologies, Inc. are each wholly owned subsidiaries of TradeStation Group, Inc., all operating, and providing products and services, under the TradeStation brand and trademark. When applying for, or purchasing, accounts, subscriptions, products and services, it is important that you know which company you will be dealing with. Please click here for further important information explaining what this means.
This content is for informational and educational purposes only. This is not a recommendation regarding any investment or investment strategy. Any opinions expressed herein are those of the author and do not represent the views or opinions of TradeStation or any of its affiliates.
Investing involves risks. Past performance, whether actual or indicated by historical tests of strategies, is no guarantee of future performance or success. There is a possibility that you may sustain a loss equal to or greater than your entire investment regardless of which asset class you trade (equities, options, futures, or digital assets); therefore, you should not invest or risk money that you cannot afford to lose. Before trading any asset class, first read the relevant risk disclosure statements on the Important Documents page, found here: www.tradestation.com .

Price Action: Inside Bar BoxesThis script automatically draws rectangles around bars inside IB pattern.
Note :: because Pinescript does not allow changes to already drawn charts on historical bars, checkbox "show only last box" doesn't work for arrows

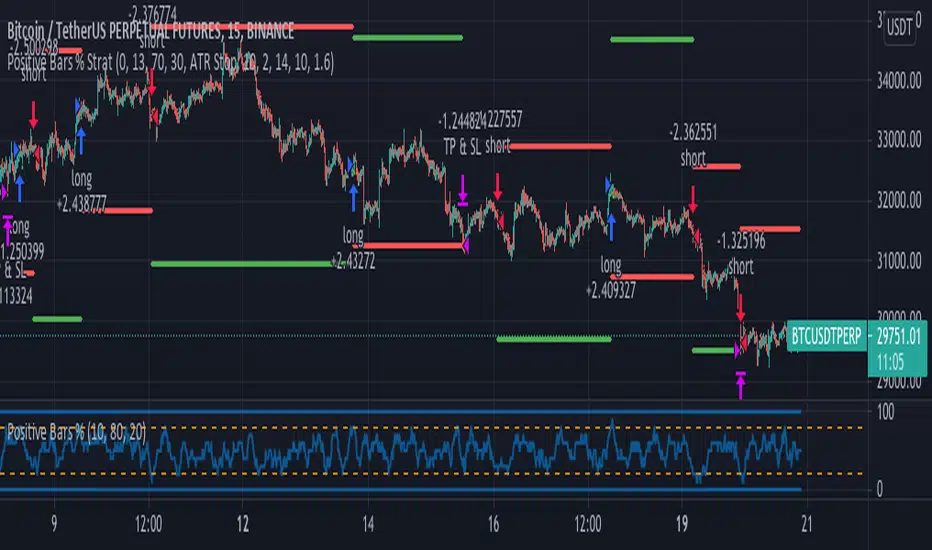
Positive Bars % StrategyBased on the calculations by ZenAndTheArtOfTrading. I added stop loss, take profit and reverse code lines.
The Positive Bars % calculates the number of green (positive) bars, relative to a look back period, defined
by the user. If the percentage is low, it means that there was a bigger number of red candles in the
lookback period. The strategy goes long when the percentage is high and short when it's low.
This logic can be reversed with positive results on different time frames.
Three Bar ReversalA three bar (3 bar) reversal strategy.
A down candles tick
The next candlestick has its low below the first candlestick and will be the lowest low of the pattern
The third candle closes above the middle candlestick
--> reverse logic for short

Green and Red Bar Difference - Intra Day Simple Indicator which plots the total of all green bars and red bars as the day progress. On a trending day there will be difference between the two lines , on a range bound day both the lines will be very close. If both the lines are far apart for some time but start moving towards each other it is a signaling end of the trend .

MTF Bars Back FunctionDesigning higher timeframe tools is challenging. Particularly when you want to apply the higher timeframe lookback to the viewing timeframe.
Here are the problems you run into when you want to use a higher timeframe input:
The output is a string.
On the daily, weekly, or monthly timeframes, the output of the input.resolution variable is "1D", "1W", and "1M".
The 1 minute, 1 day, 1 week, and 1 month timeframes all have an output of 1. Same for the 2m, 2d, 2w, 2m and so on.
I designed this function to automatically calculate the number of candles back that you would need to go back on the timeframe you're viewing to cover the lookback distance on the higher.
It checks if there's a letter on the end of the string and cuts it off, leaving just the number, then converts it from a string to a number.
From there it converts the viewing timeframe and higher timeframe into minutes, divides the two to determine their relationship to one another, then it multiplies the lookback distance of the higher timeframe with the factor and the output is the higher timeframe lookback distance converted into the equivalent bar count on the lower timeframe.
I tried to write it in a way that would make what the function does clear to coders and non-coders so it can be modified to suit your purpose. My initial use case was to us this as way of determining a lower timeframe offset for lines that were cast based on previous high timeframe bars. You could use it for any kind of MTF indicator where you want to know how many bars back you need on the low timeframe to achieve the higher timeframe equivalent. For example, if you wanted to create a multi-timeframe moving average, you would use the output as the length of the moving average.
I used a tuple output for the purpose of demonstration, but this can be reduced to a single relevant output.
Hope you find it useful. It's nice when you don't have to fight against multiple resolutions.
Let me know what you think. Is there a better way to go about it?
Trade well.
NSDT Heiken-Ashi Direction Bar MTFA simple script that places a bar at the bottom of the chart to indicate the direction of Heiken-Ashi candles - while still using traditional candles on the main chart. Try setting the bar on a higher timeframe to see the overall direction of the trend, while using traditional candles for entries/exits.
EMA Cross 9,21,50,80,200 + Inside barEste script faz o seguinte:
1. Plota 5 EMAs (9,21,50,80,200)
2. Faz crossover da 9x21 e 21x50
3. Colore inside bar em amarelo (é possível ainda colorir diferentemente bullish e bearish inside bar)

Past and Upcoming Forex and NYSE Start/End Bar HighlighterThis script highlights the start and end of past sessions and also for upcoming sessions of the current day. Additionally, the start/end bars of the current day can be marked with a text label.
Time zone parameters are available for all time parameters, so that local exchange times can be configured, without the need for manual time zone or daylight saving time (DST) adjustments. Tradingview’s internal time calculations take care of the conversion.
For ease of use, the script comes preconfigured with the start/end times of the Forex and NYSE trading sessions. If you need more highlighted bars, just add the script multiple times and adapt the configuration as needed.


Lookback Highlight BarSimple script to highlight a bar X bars in the past. Default lookback is 59 bars.

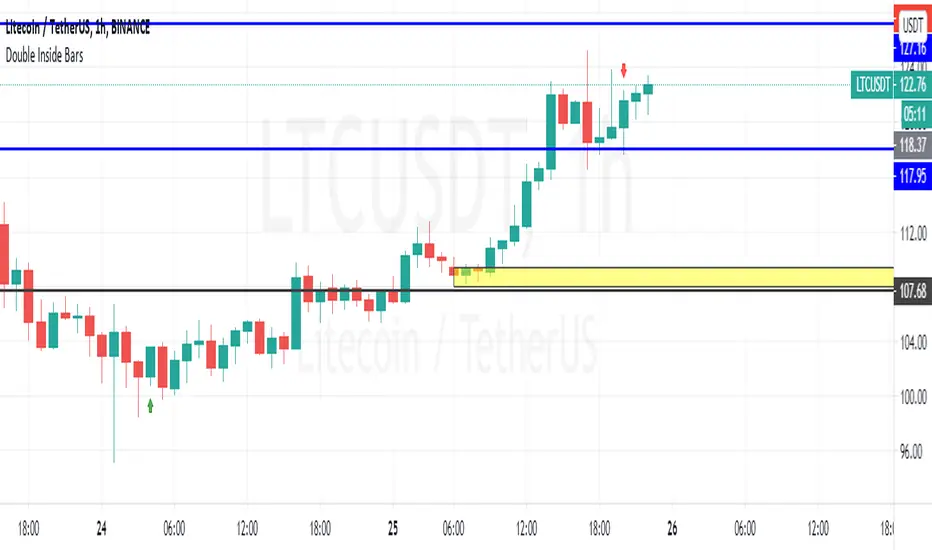
Double Inside BarsShows possible 4th bar movement direction based on 2 previous bars inside the 1st one