Cari dalam skrip untuk "bar"

Near N Bars Real Body High and Low Support and Resistance
This indicator dynamically identifies support and resistance levels based on the highest and lowest values of the real bodies (open and close prices) of the most recent N bars. Users can interactively select the starting bar by clicking on the chart, and the script calculates the highest high and lowest low within the specified range, drawing horizontal support and resistance lines accordingly. The lines can be extended to the left and right according to user inputs. This tool helps traders visually identify key price levels for technical analysis based on recent price action.

EMA 50/200 Pullback + RSI (BTC/USDT 15m - 2 Bar Logic)I recognize that combining indicators requires clear justification on how the components interact Therefore the new scripts description will explicitly detail the strategys operational logic
Objective The strategy is a Trend Following Pullback System designed for high frequency time frames 15m
Synergy The EMA50 EMA200 defines the primary Trend Direction Trend Filter It then utilizes a 2 Bar Pullback Logic to find an entry point where the price has momentarily reversed against the trendline and the RSI 14 serves as a Momentum Filter RSI greater than 50 for Long RSI less than 50 for Short to minimize false signals

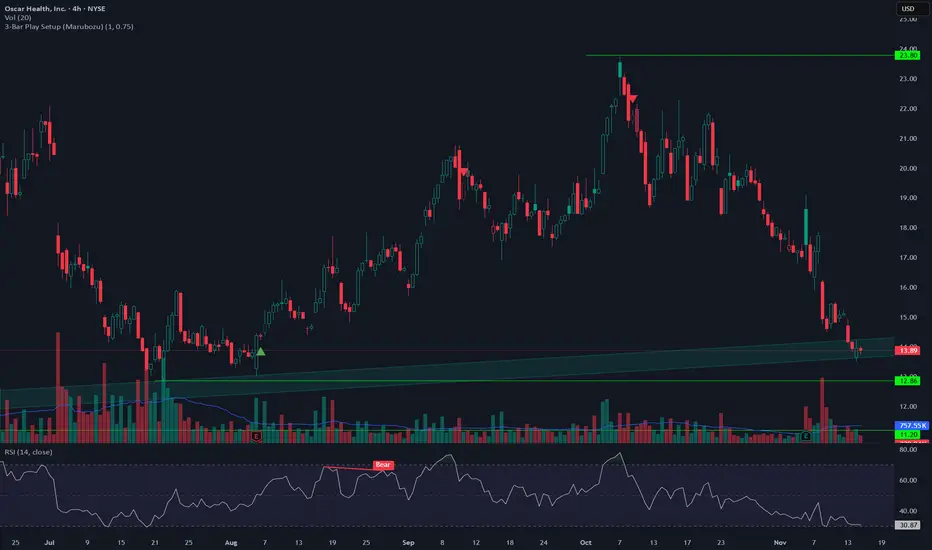
Three Bar Play Setup SignalsJust a simple indicator that will mark the inside candle on a potential 3 Bar Play, higher timeframe for more confirmation. If having any issues with indicators not pinning to chart just right click one of the indicators and choose "pin to right scale". Enjoy!
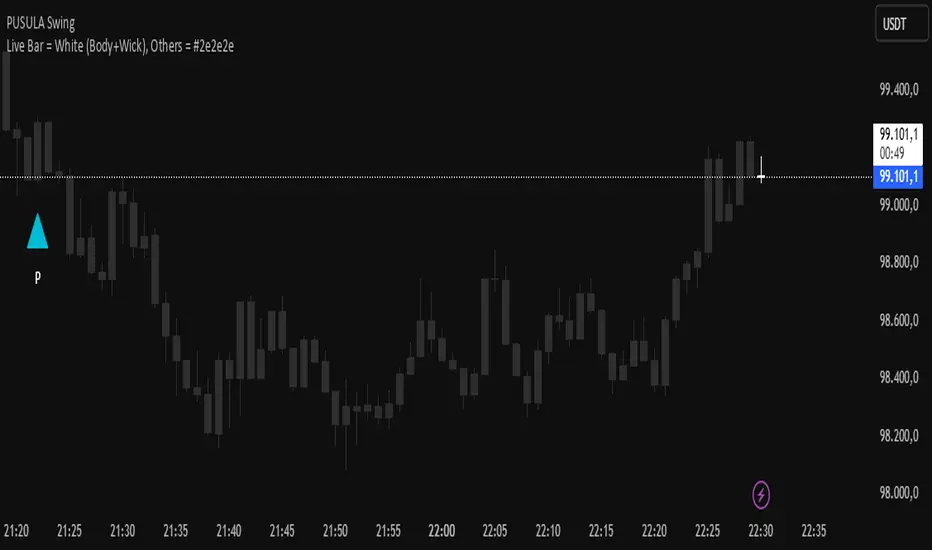
Live Bar = White (Body+Wick), Others = #2e2e2eThis script turns all candles gray, except for the last bar, which is the candle that hasn't closed and whose price is changing live. It makes that candle white so you can always spot the last candle on the chart more clearly. Enjoy!
POC Volume Bar (Highest Volume in Range)What the highlighted POC bar means
🔶 1. Institutional interest
A POC often identifies where big money stepped in.
🔶 2. Support or resistance pivot
Large volume often signals:
• A reversal
• A breakout
• Or the beginning of a trend
🔶 3. Liquidity magnet
Price tends to revisit high-volume bars.
They act like magnets.
🔶 4. Trend confirmation or exhaustion
High volume on:
• Green candle → bullish participation
• Red candle → distribution / aggressive selling

Breakout an Reversal Signal Detector with Colored in Bar TrendsThe script detects breakouts and/or reversals: when candles close outside the recent period high or low, it prompts a signal, indicating a change in market trend.
You can customize the bar color to indicate trending phases.
It can be used effectively to identify both breakouts and reversals, making it a versatile tool for trend and reversal analysis.
Simple yet effective.
Enjoy!

JTW BAR Size Warning This simple script checks bar size and if it exceeds a certain number, it will turn the candle yellow. Option to determine an oversized candle from the high to the low or from the open to the close (ignoring the wick).
Heikin Ashi 3-Bar Momentum Alert by nqbrooksTrying some stuffz out yahuuur, HIKEYNASHIEEEHH 3 bar -4h momemtum aelerTT

Green & Red Bar AlertsThis indicator identifies when a bar (candle) closes green or red and provides visual markers plus alert notifications.

3/4-Bar GRG / RGR Pattern (Conditional 4th Candle)This indicator can be used to identify the Green-Red-Green or Red-Green-Red pattern.
It is a price action indicator where a price action which identifies the defeat of buyers and sellers.
If the buyers comprehensively defeat the sellers then the price moves up and if the sellers defeat the buyers then the price moves down.
In my trading experience this is what defines the price movement.
It is a 3 or 4 candle pattern, beyond that i.e, 5 or more candles could mean a very sideways market and unnecessary signal generation.
How does it work?
Upside/Green signal
Say candle 1 is Green, which means buyers stepped in, then candle 2 is Red or a Doji, that means sellers brought the price down. Then if candle 3 is forming to be Green and breaks the closing of the 1st candle and opening of the 2nd candle, then a green arrow will appear and that is the place where you want to take your trade.
Here the buyers defeated the sellers.
Sometimes candle 3 falls short but candle 4 breaks candle 1's closing and candle 2's opening price. We can enter on candle 4.
Important - We need to enter the trade as soon as the price moves above the candle 1 and 2's body and should not wait for the 3rd or 4th candle to close. Ignore wicks.
I have restricted it to 4 candles and that is all that is needed. More than that is a longer sideways market.
I call it the +-+ or GRG pattern.
Stop loss can be candle 2's mid for safe traders (that includes me) or candle 2's body low for risky traders.
Back testing suggests that body low will be useless and result in more points in loss because for the bigger move this point will not be touched, so why not get out faster.
Downside/Red signal
Say candle 1 is Red, which means sellers stepped in, then candle 2 is Green or a Doji, that means buyers took the price up. Then if candle 3 is forming to be Red and breaks the closing of the 1st candle and opening of the 2nd candle then a Red arrow will appear and that is the place where you want to take your trade.
Sometimes candle 3 falls short but candle 4 breaks candle 1's closing and candle 2's opening price. We can enter on candle 4.
We need to enter the trade as soon as the price moves below the candle 1 and 2's body and should not wait for the 3rd or 4th candle to close.
I have restricted it to 4 candles and that is all that is needed. More than that is a longer sideways market.
I call it the -+- or RGR pattern.
Stop loss can be candle 2's mid for safe traders ( that includes me) or candle 2's body high for risky traders.
Back testing suggests that body high will be useless and result in more points in loss because for the bigger move this point will not be touched, so why not get out faster.
Important Settings
You can enable or disable the 4th candle signal to avoid the noise, but at times I have noticed that the 4th candle gives a very strong signal or I can say that the strong signal falls on the 4th candle. This is mostly a coincidence.
You can also configure how many previous bars should the signal be generated for. 10 to 30 is good enough. To backtest increase it to 2000 or 5000 for example.
Rest are self explanatory.
Pointers
If after taking the trade, the next candle moves in your direction and closes strong bullish or bearish, then move SL to break even and after that you can trail it.
If a upside trade hits SL and immediately a down side trade signal is generated on the next candle then take it. Vice versa is true.
Trades need to be taken on previous 2 candle's body high or low combined and not the wicks.
The most losses a trader takes is on a sideways day and because in our strategy the stop loss is so small that even on a sideways day we'll get out with a little profit or worst break even.
Hold targets for longer targets and don't panic.
If last 3-4 days have been sideways then there is a good probability that day will be trending so we can hold our trade for longer targets. Target to hold the trade for whole day and not exit till the day closes.
In general avoid trading in the middle of the day for index and stocks. Divide the day into 3 parts and avoid the middle.
Use Support/Resistance, 10, 20, 50, 200 EMA/SMA, Gaps, Whole/Round numbers(very imp) for identifying targets.
Trail your SL.
For indexes I would use 5 min and 15 min timeframe.
For commodities and crypto we can use higher timeframe as well. Look for signals during volatile time durations and avoid trading the whole day. Signal usually gives good targets on those times.
If a GRG or RGR pattern appears on a daily timeframe then this is our time to go big.
Minimum Risk to Reward should be 1:2 and for longer targets can be 1:4 to 1:10.
Trade with small lot size. Money management will happen automatically.
With small lot size and correct Risk-Re ward we can be very profitable. Don't trade with big lot size.
Stay in the market for longer and collect points not money.
Very imp - Watch market and learn to generate a market view.
Very imp - Only 4 candles are needed in trading - strong bullish, strong bearish, hammer, inverse hammer and doji.
Go big on bearish days for option traders. Puts are better bought and Calls are better sold.
Cluster of green signals can lead to bigger move on the upside and vice versa for red signals.
Most of this is what I learned from successful traders (from the top 2%) only the indicator is mine.

Week Start/End Bar CoordinatesGive the Bar Index for the First and Last of the Week,
input the coordinates directly into the Fixed Range Volume Profile


vwap inside bar jmrjm vwap inside bar which helps to take guage trend with vwap and and help to understand when market taking pause due to bulls and bears fight. Then we can take a trade in trend with winners.

OC Mean +/- Std Dev (last N bars) - v6tells you the value of the current close-open value to the past n bars. helpful to determine if current bar is more than 1 std dev off the average close-open

Outside Bar AMA 分类标记Classify outside bar based on Ali Moin Afshari's AMA_Breakout_PB Indicator.
根据 Ali Moin Afshari' 的 AMA_Breakout_PB 指标区分不同的吞没k线。

Trading Stats BarSimple statistics bar designed to give important values for swing trading
Most of the values are self explanatory
Float Grade
Combines float and float % designed to give a sense if the stock has the potential to move quickly. If the float is less than 20 million and float % less than 50, this has a high potential to make fast moves.
Volume Run Rate
Concept is to focus on the opening x minutes and average this value over the previous y days

Trend Bar MarkerThis indicator identifies and highlights strong trend candles based on configurable body ratio, ATR multiplier, IBS range, and minimum price difference. It supports drawing lines for open, close, high, low, and midpoint levels, with customizable color, style, and extension. Marked candles can be color-coded for bullish and bearish bars, and optional shape markers can be added for quick visualization of strong trend positions.

GEXStrik BarS EUR USDGEX strike bars on the left side measure the prevailing amount of positive or negative gamma. On the right side, the volume of calls and puts traded in the region.

Inside Bar With Alert - RajThis indicator helps you reduce your screen time by giving you consistent alerts on the formation of inside bar candle and it gives you bullish and bearish alerts on breakout of the mother candle. So if you believe in inside strategy this indicator will be helpful for you.

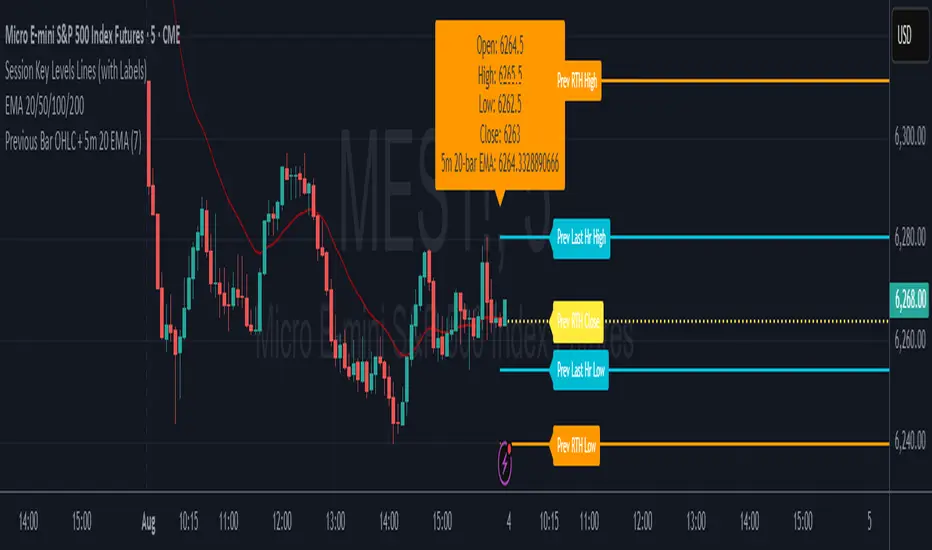
7* Previous Bar OHLC + 5m 20 EMAincreased label height for 7* Previous Bar OHLC + 5m 20 EMA. hope it helps :)
Volume Bars - Shubhashish DixitThis helps you to identify volume based on your given period and it solves the issues which we are unable to see units in the main bar of Volume default chart

Previous Bar OHLC + 5m 20 EMAThis shows previous bar OHLC + 5m 20 EMA in one single text box, so you dont have to find it yourself. hope it helps :)
