Mark specific candle (e.g. bar 20)This Pine Script indicator, "Mark specific candle (e.g. bar 20)" (short title "Mark candle"), is a simple yet powerful tool to visually highlight a particular candle on your chart.
What it does:
It marks a specific candle (e.g., the 20th, 10th, or any number you choose) counting backwards from the most recent candle on your chart. The marked candle will be colored in a subtle light grey and also feature a tiny, matching grey arrow pointing down from above it.
Why it's useful:
This indicator helps you quickly identify and track a consistent reference point in recent price action. It's great for strategies that depend on fixed look-back periods or for simply keeping an eye on a specific historical candle's position as new data comes in.
Key Features:
Adjustable Candle Number: Easily change which candle is marked (e.g., 20th, 10th, 5th) directly from the indicator settings using the "Candle Number to Mark (from end)" input.
Clear Visuals: Both the candle color and a small arrow provide a subtle, yet effective, visual cue.
How to use:
Simply add this script to your TradingView chart. Then, open the indicator's settings to set your desired candle number.
Cari dalam skrip untuk "bar"

Hide Current Bara lightweight overlay indicator designed to hide the color of the active (unconfirmed) candle on the chart.
Key Features:
Purpose: Hide the color of the currently forming bar (i.e., the active candle) on the price chart.
Psychological Benefit of Hiding the Active Candle’s Color
Hiding the color of the active candle can have notable psychological benefits for traders:
Reduction of Bias: The color of a forming candle often fluctuates as prices move up and down during its formation. This can trigger emotional responses such as fear or greed. By removing the color, traders avoid overreacting to incomplete information and are less likely to jump to conclusions based on transient price moves.
Focus on Confirmed Data: Since only completed candles are relevant for most technical analysis, hiding the color of the active candle encourages traders to make decisions based on fully formed and reliable data rather than noise.
Improved Discipline: By not seeing the color of the active candle, traders are less tempted to enter or exit trades impulsively in reaction to price flickers. This promotes a more systematic and disciplined approach.
Minimized Overtrading: Visual cues like bright green or red candles can prompt hasty trades, particularly in fast-moving markets. A transparent active candle helps reduce the temptation to trade every minor tick, fostering patience.
In summary, by hiding the color of the active candle, this script helps traders maintain emotional neutrality and focus on confirmed price action, leading to better, more rational trading decisions.

7:30 AM ET Bar HighlighterHow it works
Step Explanation
1️⃣ hour(time, targetTZ) and minute(time, targetTZ) convert each bar’s opening time to America/New_York and check for 7 : 25.
2️⃣ When both match, isTargetBar becomes true.
3️⃣ bgcolor() paints that candle red, and plotshape() draws the white dot just above it.
Multi-Time Frame DMI with Gradient Bar ColoringDisplays a table showing the Directional Movement Index (DMI) sentiment for multiple time frames based on the Average Directional Index (ADX) value for each time frame.
Table Position and Text Size are configurable, with two styles (vertical or horizontal) available.
Time frame labels can be toggled off for color-only table.
Bars are colored based on the ADX value using a color gradient between the bullish and bearish color inputs. The neutral color is independent of the gradient for contrast.

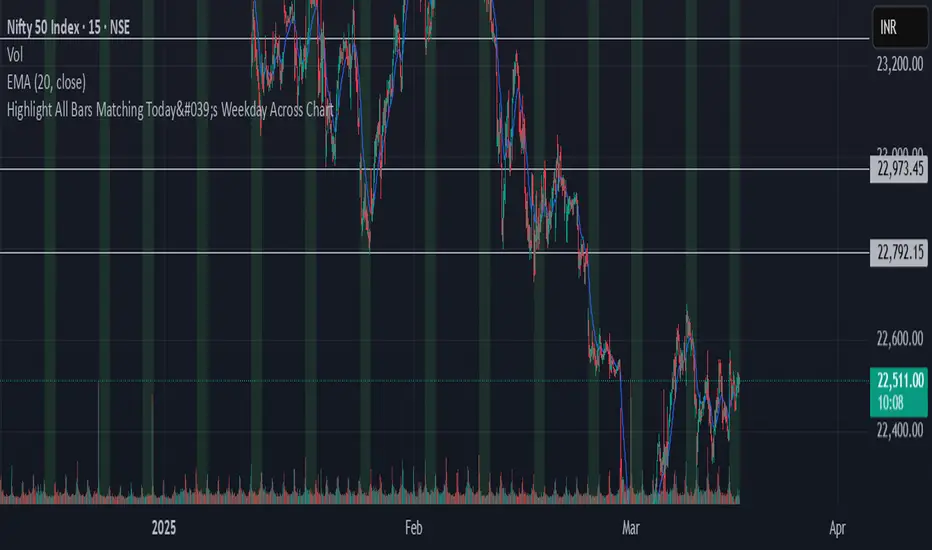
Highlight All Bars Matching Today's Weekday Across ChartThis indicator highlights all bars on the chart that correspond to the same weekday as today. It is designed to help traders identify recurring patterns or behaviors that may appear consistently on specific weekdays.
By visually marking these repeating days, traders can more easily observe potential time-based market tendencies and enhance pattern recognition in their analysis.
IU BBB(Big Body Bar) StrategyDESCRIPTION
The IU BBB (Big Body Bar) Strategy is a price action-based trading strategy that identifies high-momentum candles with significantly larger body sizes compared to the average. It enters trades when a strong bullish or bearish move occurs and manages risk using an ATR-based trailing stop-loss system.
USER INPUTS:
- Big Body Threshold – Defines how many times larger the candle body should be compared to the average body ( default is 4 ).
- ATR Length – The period for the Average True Range (ATR) used in the trailing stop-loss calculation ( default is 14 ).
- ATR Factor – Multiplier for ATR to determine the trailing stop distance ( default is 2 ).
LONG CONDITION:
- The current candle’s body is greater than the average body size multiplied by the Big Body Threshold.
- The closing price is higher than the opening price (bullish candle).
SHORT CONDITION:
- The current candle’s body is greater than the average body size multiplied by the Big Body Threshold.
- The closing price is lower than the opening price (bearish candle).
LONG EXIT:
- ATR-based trailing stop-loss dynamically adjusts, locking in profits as the price moves higher.
SHORT EXIT:
- ATR-based trailing stop-loss dynamically adjusts, securing profits as the price moves lower.
WHY IT IS UNIQUE:
- Unlike traditional momentum strategies, this system adapts to volatility by filtering trades based on relative candle size.
- It incorporates an ATR-based trailing stop-loss, ensuring risk management and profit protection.
- The strategy avoids choppy market conditions by only trading when significant momentum is present.
HOW USERS CAN BENEFIT FROM IT:
- Catch Strong Price Moves – The strategy helps traders enter trades when the market shows decisive momentum.
- Effective Risk Management – The ATR-based trailing stop ensures that winning trades remain profitable.
- Works Across Markets – Can be applied to stocks, forex, crypto, and indices with proper optimization.
- Fully Customizable – Users can adjust sensitivity settings to match their trading style and time frame.

BBr1 Candle Range Volitility Gap IndicatorModified Candle Range Volatility Gap Indicator
1. Useful to analyze bars body and wicks and volatility of security.
2. Added a Percentage Option - easier to analyze across different securities.
2. Added a Standard Deviation ("1 std dev= 68.2%, 2 std dev=95.4%, 3 std dev=99.7%, etc") based upon user defined lookback period.
3. Added the ability to include Gaps in Analysis. (Gaps are when the prior closing cost does not equal opening price)
4. Possible Uses setting up stop losses, trailing entries/exits (inside range or outside range).
5. Use it with other indicators in determining if to make an entry or close entry.
Reposted Original Description by © ka66 Kamal Advani
Visually shows the Body Range (open to close) and Candle Range (high to low).
Semi-transparent overlapping area is the full Candle Range, and fully-opaque smaller area is the Body Range. For aesthetics and visual consistency, Candle Range follows the direction of the Body Range, even though technically it's always positive (high - low).
The different plots for each range type also means the UI will allow deselecting one or the other as needed. For example, some strategies may care only about the Body Range, rather than the entire Candle Range, so the latter can be hidden to reduce noise.
Threshold horizontal lines are plotted, so the trader can modify these high and low levels as needed through the user interface. These need to be configured to match the instrument's price range levels for the timeframe. The defaults are pretty arbitrary for +/- 0.0080 (80 pips in a 4-decimal place forex pair). Where a range reaches or exceeds a threshold, it's visually marked as well with a shape at the Body or Candle peak, to assist with quicker visual potential setup scanning, for example, to anticipate a following reversal or continuation.

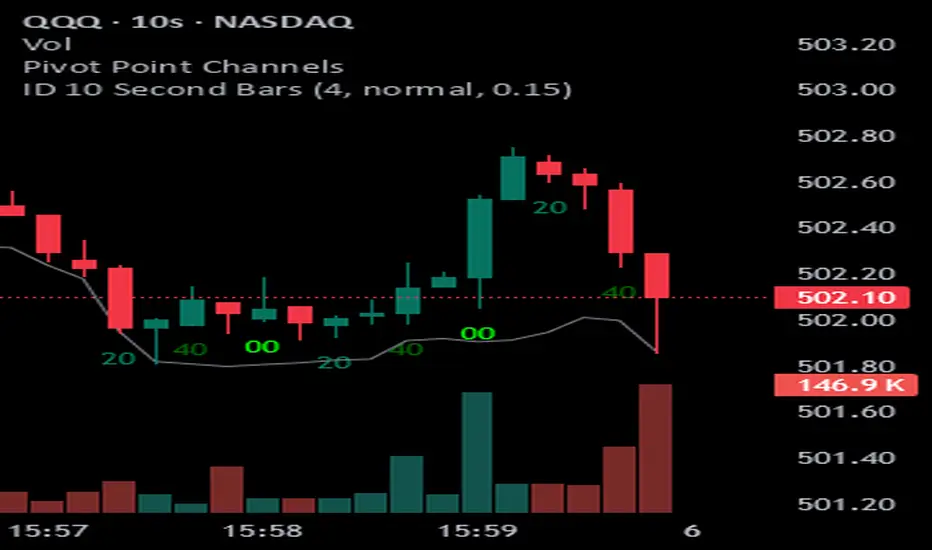
ID 10 Second BarsEnters numbers 1, 3 and 5 under the appropriate bars on the 10 second chart and permits you to adjust the colors of each number.
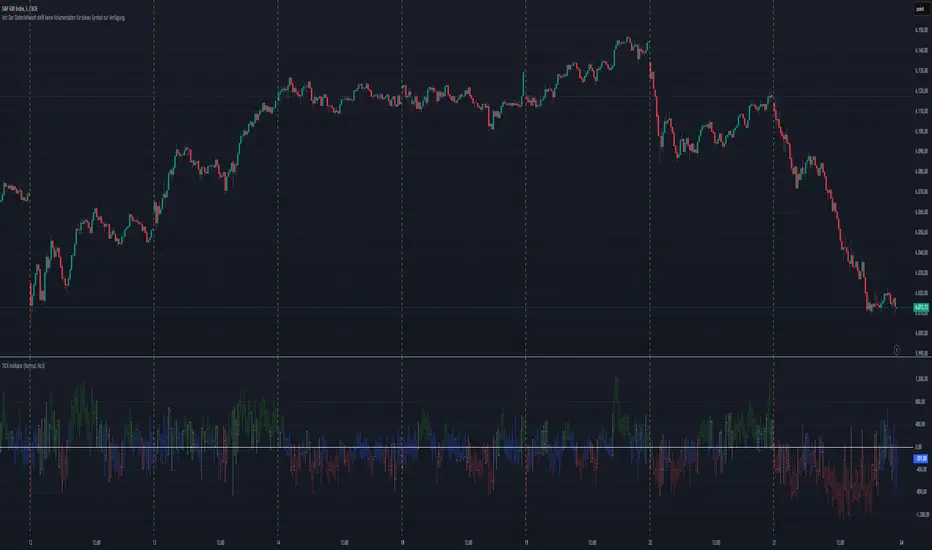
TICK Indikator
English:
The TICK Indicator measures in real time the number of up ticking stocks minus the number of down ticking stocks on the New York Stock Exchange (NYSE). It can display either the current TICK value ("Normal" mode) or the cumulative TICK values over the trading day ("Cumulative" mode). Positive values indicate market strength, while negative values signal weakness. Colored bars visualize momentum: green shades for rising, red for falling values. The zero line acts as a reference between buying and selling pressure.
Interpretation:
> +1000 and/or continuos lows above 0 → strong buying pressure
< -1000 and/or continuos highs below 0 → strong selling pressure
Around 0 → balanced market
Deutsch:
Der TICK Indikator misst in Echtzeit die Anzahl der Aktien, die an der New York Stock Exchange (NYSE) steigen, minus der Anzahl der fallenden Aktien. Der Indikator kann im "Normal"-Modus den aktuellen TICK-Wert anzeigen oder im "Cumulative"-Modus die kumulierten TICK-Werte über den Tag hinweg summieren. Positive Werte deuten auf eine allgemeine Markstärke hin, während negative Werte Schwäche signalisieren. Farbige Balken visualisieren die Dynamik: grüne Töne bei steigenden, rote bei fallenden Werten. Die Nullinie dient als Referenzpunkt zwischen Kauf- und Verkaufsdruck.
Interpretation:
> +1000 und/oder mehrere aufeinander folgende Tiefs über 0 → starker Kaufdruck
< -1000 und/oder mehrere aufeinander folgende Hochs unter 0 → starker Verkaufsdruck
Nahe 0 → ausgeglichener Markt
Custom Time K-barCustom Time K-bar Indicator
This custom indicator highlights specific times on the chart, helping traders identify key moments based on user-defined time intervals. The script is designed to highlight two distinct times with different colors, which can be customized to suit the trader's needs.
Features:
Custom Time Inputs: Set two specific times in hours and minutes (e.g., 09:00 and 22:30).
Highlighting on Chart: The chart background changes color when the current time matches the defined times. Green for the first time and red for the second time.
Dynamic Labels: Labels display the exact time at the lowest and highest points of the corresponding candles, showing the user-defined times in a clear and visible format.
Timezone Adjustment: The indicator is adjusted for the GMT+8 timezone.
Customization:
Easily adjust the two key times and customize the colors for highlighting.
The script allows for easy tracking of key time events, which can be crucial for strategies that rely on specific timings during market hours.
This indicator is ideal for traders who want to track and visualize important times dynamically on the chart. Whether you're focusing on specific market events or just want to see certain time intervals highlighted, this script can help streamline your analysis.

Failed 2D & Failed 2U BarsI created this indicator to plot a triangle when a candle is either 1) a failed 2 down--the candle breaks the low of the prior candle but closes green (or higher than its opening price) and doesn't break the high of the previous candle; and 2) a failed 2 up--high of the prior candle is broken but the bar is red and does not break the low of the prior candle.
It has alerts which you can set up in the alert system.
I think that this candle is one of the most telling and powerful when it comes to candle analysis.
R.I.P. Rob Smith, Creator of The Strat.
Elephant Bars
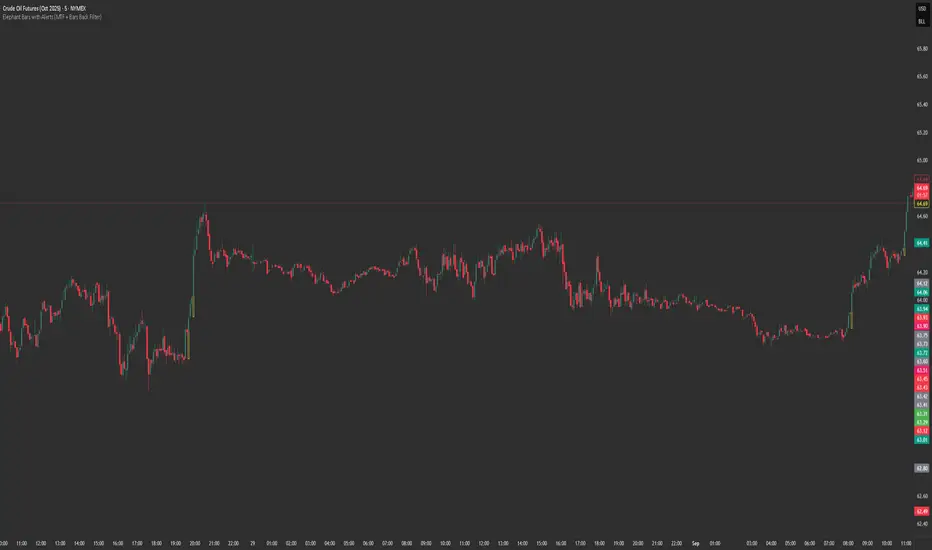
**Elephant Bars Indicator**
This indicator identifies and highlights candlesticks that are significantly larger than the recent average candlestick size. It helps traders quickly spot strong price movements.
- **Percentage Threshold:** The candlestick must be this much larger than the average of the last 5 candles (default is 50%).
- **Body Percentage Threshold:** The candle body must be at least this percentage of the total candle size (default is 80%).
- **Border Color:** Sets the color of the highlighted candle's border.
- **Border Thickness:** Sets the thickness of the border around the highlighted candle.
**How It Works:**
1. The script calculates the size of the current candlestick and its body.
2. It computes the average size of the last 5 candlesticks.
3. The indicator highlights candles that are both significantly larger than the average size and have a body that is a substantial portion of the total candle size.
This indicator is particularly useful for identifying potential breakout or reversal points, as large candlesticks often signify strong market sentiment.
Feel free to tweak the description to better fit your needs! 🚀
MFS-3 Bars Pattern Strategy3 Bar Pattern Strategy
Detects an Ignite Candle followed by a Pullback Candle followed by a Confirmation Candle.
A Box will be drawn around the setup and three arrows will identify I, P, C (Ignite, Pullback, Confirmation) the setup.
The strategy will calculate a Stop Loss below the Low Price of the Ignite candle and a Take Profit at 2 times the Stop Loss giving a Risk to Reward Ratio of 1:2.
Extra conditions are included to reduce false triggers:
- A down trend must be detected using 3 SMA (Long, Medium, Short) that should be aligned from Long to Short one above the other.
- The Ignite Candle's body must be BELOW the Short SMA
An input form is available to adjust some strategy parameters.
Performance Note
----------------------
Trading conditions are very strict, so most of the time, no signals will be detected in the Strategy window.
This strategy should only be one of many strategies used for trade setups.
Hope you enjoy it.

Volume Z-Score Bar ColorA simple script help you identify significant upticks in volume for a particular candle.
Using the standard z-score calculation you can change the bar color based on the user selected standard deviation range.
Calculation
z = (x - μ) / σ, where:
z: is the z-score
x: is the current volume
μ: is the mean volume
σ: is the standard deviation
Options include setting the bottom and top end of the deviation range. This will allow you to see a moderated uptick in volume as well as an extreme uptick. You can also choose the colors for the moderate bull/bear volume and extreme bull/bear volume.

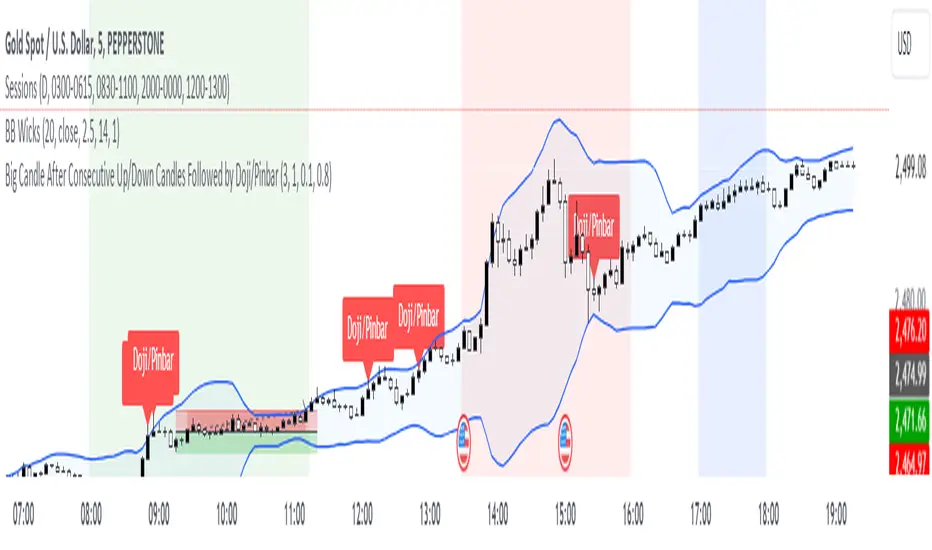
Big Bar Followed by Doji/PinbarUsed find doji/pinbars after a Big candle showing the potential Morning/Evening star formation after x amount of consecutive up moves.
1. Doji Threshold (dojiThreshold)
What is a Doji?: A doji is a candlestick pattern where the opening and closing prices are very close to each other. It represents indecision in the market.
Threshold Explanation: The dojiThreshold is used to define what qualifies as a doji by comparing the size of the candle's body (the difference between the opening and closing prices) to the total range of the candle (the difference between the high and low prices).
How it works:
The formula in the script checks if the absolute difference between the close and open is less than or equal to a percentage of the entire candle's range.
Example: If the dojiThreshold is set to 0.1 (or 10%), this means that for a candle to be considered a doji, the size of the body (the difference between the open and close) must be 10% or less of the total candle's range (the difference between the high and low prices).
In other words, if the body is small enough (based on the threshold), the candle is considered a doji.
2. Pinbar Body Size (pinbarBodySize)
What is a Pinbar?: A pinbar (short for "pinocchio bar") is a candlestick pattern with a small body and a long wick (or shadow) on one side, indicating a potential reversal. The longer wick represents a rejection of a certain price level.
Body Size Explanation: The pinbarBodySize defines the maximum proportion of the candle's total range that the body can occupy for the candle to be considered a pinbar.
How it works:
The script compares the size of the body to the total range of the candle.
Example: If pinbarBodySize is set to 0.3 (or 30%), the body of the candle must be 30% or less of the total range for it to be considered a pinbar. This ensures that the candle has a small body and, therefore, a relatively long wick on one side.
The script then checks whether the longer wick is on the upper or lower side of the candle to determine if it's a valid pinbar pattern.
Summary:
Doji: The dojiThreshold parameter sets how close the open and close prices need to be relative to the candle's range for the candle to be considered a doji.
Pinbar: The pinbarBodySize parameter sets the maximum size of the body relative to the candle's total range to qualify it as a pinbar.
Both of these thresholds are adjustable in the script, allowing you to fine-tune what qualifies as a doji or pinbar based on your trading style and the market conditions you're analyzing.
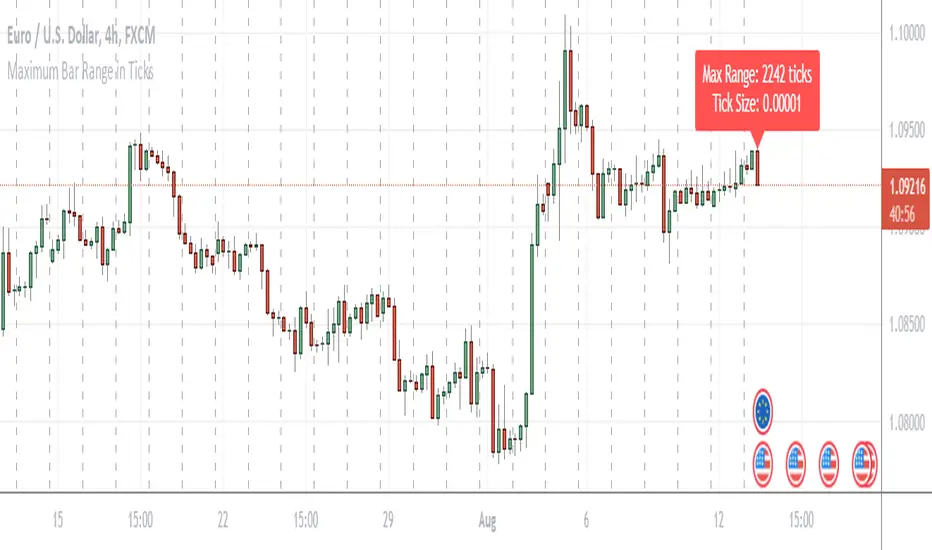
Maximum Bar Range in TicksThis is a simple indicator that gives the maximum range of any bar on the chart in ticks. I found it useful when sizing arrays and it might also be valuable when working out risk parameters.
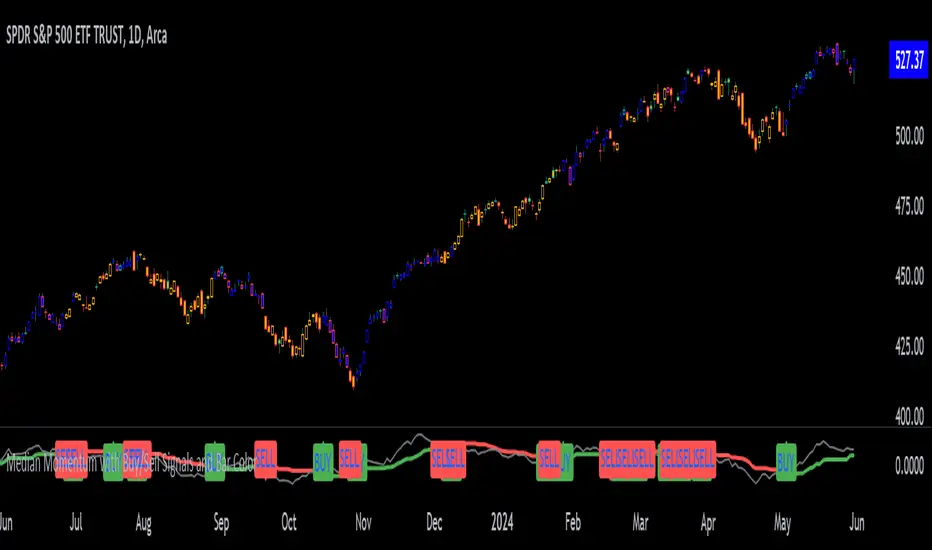
Median Momentum with Buy/Sell Signals and Bar ColorMomentum Calculation:
Momentum is calculated as the difference between the current close price and the close price momentum_length periods ago: momentum = close - close .
Highest and Lowest Momentum:
The highest and lowest momentum values over the specified length are calculated.
Median Momentum:
The median momentum is calculated as the average of the highest and lowest momentum values.
Color Setting:
medianColor is set based on whether the momentum is above, below, or equal to the median momentum.
barColor is set similarly for bar coloring.
Plotting:
The script plots the median momentum and the actual momentum values.
Buy and sell signals are generated when momentum crosses over or under the median momentum.
The script also plots the buy and sell signals with arrows on the chart.
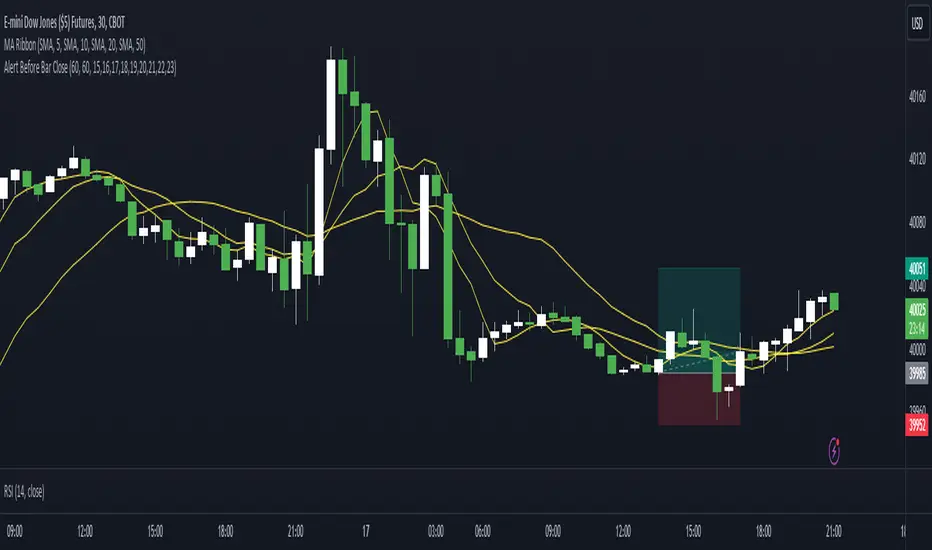
Alert Before Bar Closei.imgur.com
Alert Before Bar Close
==========================
Example Figure
Originality and usefulness
This indicator/alert mechanism is unique in two ways. First, it provides alerts before the close of a candlestick, allowing time-based traders to prepare early to determine if the market is about to form a setup. Second, it introduces an observation time mechanism, enabling time-based traders to observe when the market is active, thereby avoiding too many false signals during electronic trading or when trading is light.
Detail
Regarding the settings (Arrow 1). The first input is to select the candlestick period you want to observe. The second is to notify a few seconds in advance. The third input sets the observation time. For example, if you set "1,2,3,4,5," the alert mechanism will only be activated during the period from 01:00:00 to 05:59:59, consistent with the time zone you set in TradingView. Additionally, I have set it so that the alert will only trigger once per candlestick, so don't worry about repeated alerts.
The alert setup is very simple, too. Follow the steps (Arrow 2, 3) to complete the setup. I have tested several periods and successfully received alerts on both mobile and computer. If anyone encounters any issues, feel free to let me know.
True stock performance based on EY Bar divergenceI created this indicator to be used in conjunction with my other indicator "True stock performance based on Earnings Yield". I've detailed in that description how true performance is calculated. In short it measures how much EY is moving in relation to the stock price. The theory is that if stock price is moving heavily while EY isn't you have a sentiment driven trend and the stock isn't traded on fundamentals.
This indicators marks bars when stock performance divergences from true performance.
Green upward triangle = The true performance closes lower than previous while stock price is closing higher. This indicates a optimistic sentiment as stock price is pushed up even though price based on EY is moving down.
Red downward triangle = The true performance closes higher than previous while stock price closing lower. This indicates a negative sentiment as stock price is pushed down even though price based on EY is moving up.
How do I use it?
I use it to confirm when sentiment has taken taken over a stock. If you have a fair uptrend (when both stock performance and true performance are doing higher highs), optimistic divergencies are welcome. I've used NVIDIA from 2017 to 2019 to demonstrate.
But if true performance starts to make lower highs while stock performance keeps going up and you see optimistic divergencies, you can tell that the market is getting overoptimistic.
When the stock had crashed it eventually bottomed and started to make higher lows together with an uptrend of true performance, which I count as a fair uptrend. Regardless of that you start to see some negative divergencies indicating that people are scared that the stock will drop again and oversell. These opportunities can be good places to buy more.
But i don't care about earnings, I'm a technical trader. Do i have any use for it?
You possibly could, yes. If you want to follow the crowd, optimistic divergencies confirms that the market is still interested in the stock and may keep pushing the price up. But be careful. Negative divergencies almost never marks any tops, it often confirms downtrends and may indicate bottoms. Often the optimistic divergencies marks the top so don't buy more blindly using this indicator.

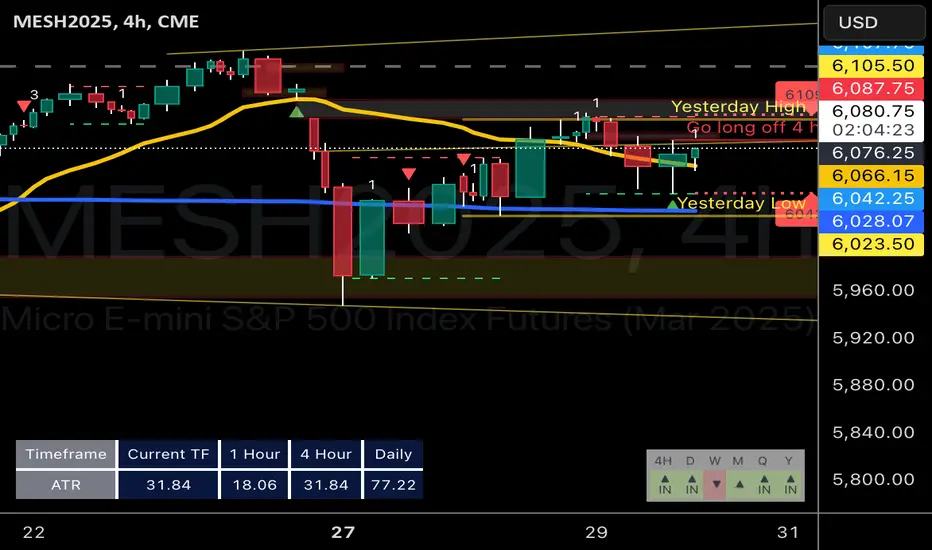
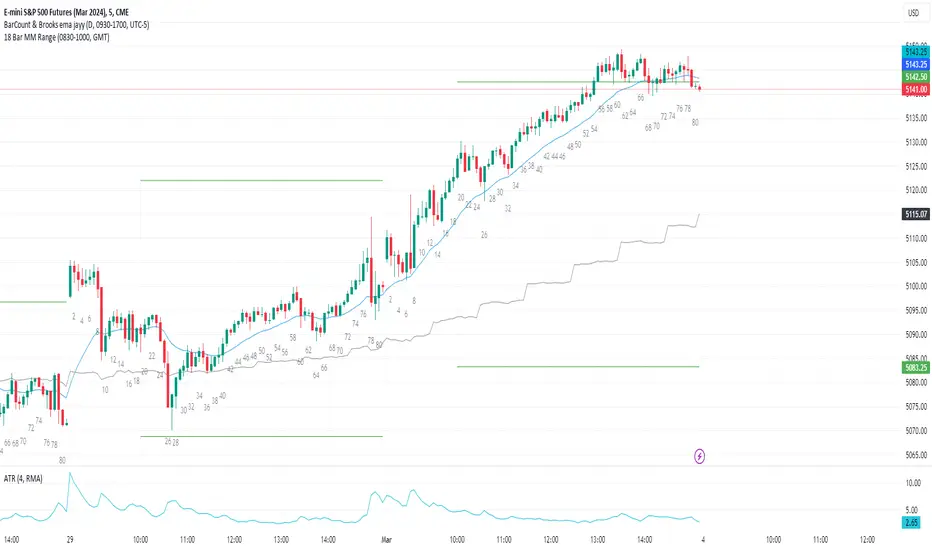
18 Bar MM RangeFirst Indicator in a (hopefully) many indicators to help bring Al Brook's methodoligies to Pine Script.
This indicator plots the highest and lowest close from the first 18bars of the NY session and uses them to plot the 18bar MM. Most days, a BO of the 18bar range is met. This is help to keep track of that key price action on your chart.
It doesn't plot until bar 18 has closed.
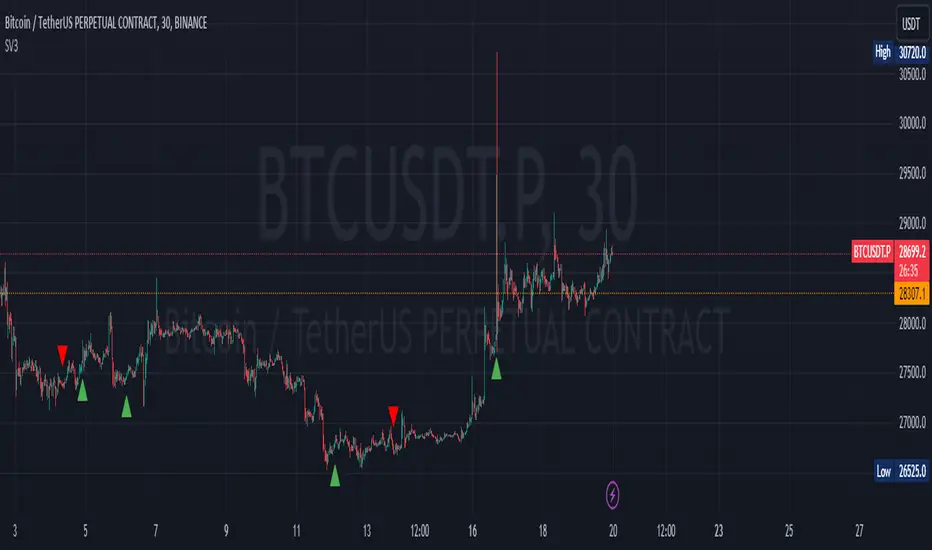
Sequence Volume BarsThis script in TradingView is designed to identify sequences of bars with increasing volume. It creates two indicators: one for bullish trends (green sequence) and another for bearish trends (red sequence).
Green Sequence: The script considers a green sequence when the current closing price is higher than the previous one, and the volume is increasing. When the green sequence approaches a user-defined length, it highlights it on the chart with a green triangle below the bar.
Red Sequence: Similarly, the script looks for a bearish sequence when the current closing price is lower than the previous one, and the volume is increasing. When the red sequence approaches the specified length, it highlights it with a red triangle above the bar.
Both indicators can also send alerts when their respective sequences reach the specified length minus one. This script can be useful for traders seeking entry points based on specific volume patterns in the market.
P.S. I'm not sure how this can be useful to you, but sometimes a pump and dump can be predicted. Maybe you'll come up with ideas on how to refine this concept.
-----------
Этот скрипт для TradingView предназначен для выявления последовательностей баров с ростом объема. Он создает два индикатора: один для бычьих трендов (зеленая последовательность) и другой для медвежьих трендов (красная последовательность).
Зеленая последовательность: Скрипт считает, что происходит зеленая последовательность, если текущая цена закрытия выше предыдущей, а объем увеличивается. Когда зеленая последовательность по длине приближается к заданной пользователем, он выделяет это на графике зеленым треугольником под баром.
Красная последовательность: Аналогично скрипт ищет медвежью последовательность, когда текущая цена закрытия ниже предыдущей, а объем растет. Когда красная последовательность приближается к указанной длине, он выделяет это красным треугольником над баром.
Оба индикатора могут также отправлять предупреждения, когда соответствующая последовательность достигает заданной длины минус один. Этот скрипт может быть полезен для трейдеров, ищущих входные точки, основанные на определенных шаблонах объема в рынке.
Не знаю как вам может это пригодиться, но иногда предсказывается пам и дамп. Может у Вас появится идея как доработать эту идею
Highlight BarHighlight bars in the past. I use this to show the start of moving average calculations - very helpful to anticipate the change in slope of moving averages. You can change color as well as how far back in time to highlight. The defaults are 20, 50 and 200.
I learned of the idea from Brian Shannon - thanks!

The Opening Range / First Bar By Market Mindset - Zero To EndlesThe script shows the opening range of the instrument based on different resolutions and timeframes.
Inputs :
1. Resolution
It decides the calculation frequency of the script.
In Auto resolution, Standard values have been used.
2. Timeframe
It decides the timeframe for the OHLC values.
By default, it will use the chart timeframe and so chart OHLC values.
3. Lookback
It decides the no. of ranges shown on the chart.
Middle Line can be hidden from the settings.
The script can be used for any instrument and on any timeframe.
If price is above the opening range or the middle line, a trader should look for long opportunities.
If price is below the opening range or the middle line, a trader should look for short opportunities.
A sideways or choppy move is exoected if Middle line is crossed again and again.
For trading, wait for atleast 1st bar to close. and let the opening range build up first.
Happy Trading
