(Quartile Vol.; Vol. Aggregation; Range US Bars; Gaps) [Kioseff]Hello!
This indicator is a multifaceted tool that's, hopefully, useful for price action and volume analysis.
(This script makes use of the newly introduced "text_font" parameter)
With this script you'll have access to:
Range US Chart
Volume Aggregation Chart
Gaps Chart
Volume by Quartile
Consequently, you'll have access to:
First Quartile Volume Threshold
Second Quartile Volume Threshold
Third Quartile Volume Threshold
90th Percentile Volume Threshold
Fourth Quartile Volume Threshold
Q2 - Q1 Dispersion
Q3 - Q2 Dispersion
Q4 - Q3 Dispersion
Quartile Deviation
Interquartile Range
Avg. "n" bar return following "high" volume
Avg. "n" bar positive return following "high" volume
Avg. "n" bar negative following "high" volume
# of Positive Returns Following a Gap
# of Negative Returns Following a Gap
# of Gaps
# of Up Gaps
# of Down Gaps
Average # of bars to fill Up Gaps
Average # of bars to dill Down Gaps
Average Gap Up % increase
Average Gap Down % decrease
Cumulative % increase of all Up Gaps
Cumulative % decrease of all Down Gaps
Sort gaps by distance from price
Hide gaps that price substantially deviates from (gaps will reappear when price trades near the gap)
Segment Range US bars by date
Manually configure Range US price thresholds
Identify "congestion" areas with Range US bars
Range US Levels that must be exceeded for a new Range US bar to produce
Manually configure cumulative volume threshold for Volume Aggregation bars
Segment Volume Aggregation bars by date
Largest Volume Aggregation bar increases
Largest Volume Aggregation bar decreases
Calculate log returns after "high" volume sessions
Quartile Volume
The Quartile Volume portion of the script segments price/volume intervals by quartile.
The image above shows features of the indicator.
For statistics, the following metrics are recorded:
First Quartile
Second Quartile
Third Quartile
90th Percentile
Fourth Quartile
Q2 - Q1 Dispersion
Q3 - Q2 Dispersion
Q4 - Q3 Dispersion
Quartile Deviation
Interquartile Range
Color-coordinated price bars (by volume quartiles)
The percent rank for the volume of the current bar
Avg. "n" bar return following "high" volume
Avg. "n" bar positive return following "high" volume
Avg. "n" bar negative following "high" volume
The script colors bars via gradient.
By default, bars are colored lime when volume for the interval is "high" (exceeds upper quartile thresholds). The greener the bar, the higher the volume for the interval.
Bars are colored red when volume for the interval is "low" (fails to exceed lower quartile thresholds). The redder the bar, the lower the volume for the interval.
Naturally, brownish-colored bars reflect a volume interval that concluded near the median.
The image above exemplifies the process. This feature might be useful to categorize / objectively define high-volume clusters, low-volume clusters, high-volume price moves, low-volume price moves, etc.
For greater precision, you can select to color bars by volume quartile they belong to.
The image above shows color-coordinated price bars. More details shown in the image.
Additionally, you can select to plot the quartile/percentile that a price bar belongs to on the chart.
The image above shows price bars numbered by the volume quartile they belong to.
The script will distinguish successive 90th percentile violations, superimpose a linear regression channel atop the data sequence, and record pertinent statistics.
The image above shows the process.
Lastly, the user can plot an anchored VWAP using a built-in time function.
The image above shows the anchored VWAP.
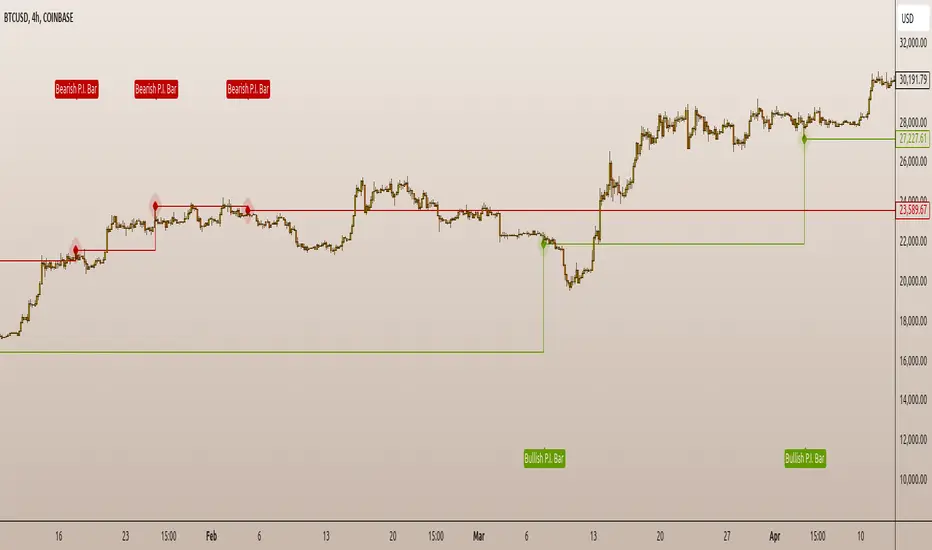
Range US Chart
A Range US chart operates irrespective of time and volume - simply - bars produce after a user-defined price move is achieved/exceeded in either direction. A range us chart produces “trend candles” and “reversal candles”. A reversal candle always moves against the most immediate bar; a trend candle always moves in favor of the most immediate bar. The user defines the dollar amount price must travel up/down for a trend candle to fulfill, and for a reversal candle to fulfill.
Note: if a “down reversal” candle (red) Is produced, it’s impossible for the next candle to also be a down reversal candle - for the downside move to continue the criteria for a down trend candle must be fulfilled. Similarly, if an “up reversal” candle (green) Is produced, it’s impossible for the next candle to also be an up reversal candle - for the upside move to continue, the criteria for an uptrend trend candle must be fulfilled. Consequently, Range US bars frequently trade at the same level for extended periods. This is intentional, as this chart type is theorized to “filter noise” (whether Range US charts fulfill this theory is to your discretion).
Lastly, if an up trend candle (green) is produced, the next candle cannot be up a reversal up candle - only a trend up candle or reversal down candle can produce - vice versa for a trend down candle (the subsequent candle cannot be a reversal down candle). In this sense, an uptrend continues on successive trend up candles; a down trend continues on successive trend down candles.
The image above exemplifies Range US chart functionality.
The lower-right stats table shows the requisite price move for a "Trend" candle to produce and for a "Reversal" candle to produce.
The default settings for this chart time automatically calculate the required "Trend" candle price move and the required "Reversal" candle price move. However, both settings are configurable.
The image above shows manually configured parameters for a trend bar and reversal bar to produce. This feature allows the user to replicate the Range US chart hosted on extrinsic charting platforms.
However, please consider that this script does not use tick data; 1-minute OHLC data is used for calculations.
Consequently, configuring the trend bar and reversal bar requirement too low may return inaccurate data. For instance, if you set trend candles to form after a $1 price move then trend candles will form if price moves up $1 from a green Range US bar or down $1 from a red Range US bar. This is sufficient for lower priced assets; however, if you were trading, for instance, Bitcoin - a $1 price move can happen numerous times in one minute. This script can’t plot bars and record data until a 1-minute bar closes and a new 1-minute bar opens. Further, if Bitcoin moves up $1 twenty times and down $1 twenty times in a 1-minute bar - your Range US chart will record such variations as one price move. This data is inaccurate and likely useless.
To counter this quandary, a warning message will appear if you configure trend bar price moves or reversal bar price moves too low.
The image above shows the concealable warning message.
The image above is a flow diagram (made with shaky hands) illustrating the Range US bar formation process.
A google search will return additional information on the Range US chart type.
Volume Aggregation Bars
TradingView user and member of the TradingView Discord server @ferreirajames informed me of the Volume Aggregation chart type. The user commented in the "Suggestions" channel for the TradingView Discord server asking for the Volume Aggregation chart type. As an interim fix, I tried my hand at recreating the process, which is available in this script.
Similar to the Range US chart type, Volume Aggregation bars aren’t bound to a time-axis; the bars form after a user-defined, cumulative amount of volume is achieved or exceeded. Consequently, once the cumulative amount of volume is achieved or exceeded - a bar is produced at the corresponding price level.
Underlying theory: The chat type is conducive to identifying price levels where traders are “trapped”. Whether the process adequately distinguishes this circumstance is to your discretion.
The image above exemplifies the Volume Aggregation chart type.
Regardless of the current price, Volume Aggregation bars for after a requisite amount of volume is achieved/exceeded. Tick data isn't used; therefore, remainder values are carry over.
By default, the script automatically calculates a proportional cumulative volume total to dictate the formation of Volume Aggregation bars. However, the cumulative threshold is configurable.
The image above shows Volume Aggregation bars forming subsequent a user-defined cumulative volume total being exceeded.
Note: This chart type uses OHLC data from the timeframe of your chart. Therefore, for instance, setting the volume threshold too low will produce inaccurate, useless data.
A warning message will appear for such occurrence.
Gaps
The indicator incorporates a "Gaps" chart type.
The image above shows accompanying features.
A list of all unfilled gaps is accessible - gaps for this list are sorted by distance from current price.
Partially filled gaps are displayed in the corresponding gap box - the percentage amount the gap was filled is also displayed.
Gap statistics show:
# of Gaps
# of Up Gaps
# of Down Gaps
Average # of bars to fill Up Gaps
Average # of bars to dill Down Gaps
Average Gap Up % increase
Average Gap Down % decrease
Cumulative % increase of all Up Gaps
Cumulative % decrease of all Down Gaps
Naturally, there may be gaps formed thousands of bars ago that aren't close to price. Showing these gaps on the chart will "scrunch" the y-axis and make prices indistinguishable.
I've added a setting that allows the user to hide gaps that are "n" % away from the current price. The gap, if unfilled, will reappear when price trades within the user-defined percentage.
The image above shows an example. There's an unfilled down gap that's "hidden" because the current price is a further % away from price than what I've specified in the settings (1%). When prices trade back within 1% of the gap - it will reappear.
The image above shows the process in action. Prices moved back within 1% (can be any %) of the gap; therefore, it reappeared on the chart.
You can also set the % distance a gap must achieve for it to be considered a gap, recorded and plotted. Additionally, you can select to "visualize" gaps. Similar to the Range US chart and the Volume Aggregation chart, this setting will bars reflecting the most recent sequence of gaps - date and percentage distance of the gap are superimposed atop the bar.
Let me know if there's anything else you'd like included!
Note: The initial compilation time for this script is.... high. However, once the script's compiled, calculation load times are quick and you can sift through assets and timeframes relatively quick.
There's also a setting to "Improve Load Times" in the user-inputs table. This setting only improves the load times for post-compilation calculations and plots. The initial compilation load time is unchanged. Simply, once the indicator has "first loaded", all subsequent loads are quick.
Thank you! (:
Cari dalam skrip untuk "bar"

Session Opening Bar RangeSession Opening Bar Range (OBR) - Advanced Opening Range Indicator with Statistical Analysis
Overview
The Session First Bar Range (FBR) indicator is a comprehensive tool that captures and projects key levels based on the first bar of a user-defined trading session. Unlike traditional daily opening range indicators, this script allows traders to focus on specific session windows (New York RTH, London, Asia, etc.) and analyze price behavior relative to the initial momentum established in that session's opening bar.
What makes this indicator unique is its combination of three distinct projection methodologies: statistical analysis based on historical range data, Fibonacci extensions, and fixed-point rotation levels commonly used by institutional traders. To our knowledge, this is the only opening range indicator that incorporates statistical standard deviation levels calculated from historical first bar ranges, making it both a technical and probabilistic tool.
Core Concept
The opening range concept is based on the principle that the initial price action of a trading session often sets the tone for the remainder of that session.
Professional traders have long observed that:
The first bar's high and low act as key reference points
Price often respects or breaks these levels with significance
Expansion beyond the opening range tends to occur in measurable increments
This indicator takes these observations and enhances them with:
Historical probability analysis - "Based on the last 60 sessions, price typically extends X standard deviations beyond the opening range"
Proportional projections - Fibonacci-based extensions showing where measured moves typically target
Fixed-point rotations - Institutional rotation levels (e.g., 65 points for NQ, 15 points for ES)
How It Works
Session Detection & First Bar Capture
The indicator uses Pine Script's time() function with timezone support to precisely detect when a trading session begins. When the first bar of the selected timeframe occurs within the session window, the script captures:
High (H): The high of the first bar
Low (L): The low of the first bar
Mid (M): The midpoint (hl2) of the first bar
Critical Detail: These levels are fixed from the first bar only - they do not update as the session progresses. This differs from many "opening range" indicators that use a time period (e.g., first 30 minutes). Here, you select the bar timeframe (default 5-minute), and only that single first bar's range is captured.
Statistical Level Calculation
The indicator maintains a rolling array of the last N session's first bar ranges (default: 60 sessions). For each new session, it calculates:
Average Range: Mean of historical first bar ranges
Standard Deviation: Volatility of those ranges
Projection Levels: High/Low ± (Average Range + Std Dev × Multiplier)
This provides probability-based levels. For example, a +2σ level suggests: "Historically, price extending this far beyond the opening range is a 2-standard-deviation event (approximately 95th percentile)."
Fibonacci Extensions
Using the first bar range as the base unit (100%), the indicator projects Fibonacci levels:
100% extension: One full range above the high / below the low
1.618x extension: (Default) Golden ratio projection
2.618x, 3.618x extensions: Additional Fibonacci levels
Calculation: Range = H - L, then Target = H + (Range × Multiplier) for upside projections.
OR Rotation Levels
These are fixed-point increments from the first bar's high and low. Unlike percentage-based methods, rotations use absolute point values:
NQ traders often use 65-point increments
ES traders often use 15-point increments
Gold/bonds use different values
The indicator draws 5 levels above the high (R+1 through R+5) and 5 below the low (R-1 through R-5), each separated by your specified point increment.
Features:
Session Options
Pre-configured Sessions:
New York RTH (9:30am - 4:00pm)
New York Futures (8:00am - 5:00pm)
London (2:00am - 8:00am)
Asia (7:00pm - 2:00am)
Midnight to 5pm
ZB/Gold/Silver OR (8:20am - 4:00pm)
CL OR (9:00am - 4:00pm)
Custom Session: Define your own start/end times in HHMM format
Timezone Support: All sessions respect the selected timezone (default: America/New_York)
Customizable Timeframe
Select any timeframe for the first bar (1min, 5min, 15min, etc.)
Default: 5-minute bars
Important: This is the timeframe for the first bar capture, independent of your chart's timeframe
Display Options
Historical Ranges: Show/hide past session ranges (with configurable limit to manage performance)
Line Styles: Choose between Solid, Dashed, or Dotted for range lines and midline
Label Position: Left or Right side of range
Show Prices: Optionally display actual price values on labels
Custom Colors: Fully customizable colors for all components
Statistical Levels
Lookback Period: Number of historical sessions to analyze (default: 60)
Two Multiplier Levels: Default 1σ and 2σ, fully adjustable
Separate styling: Different line styles (dashed vs dotted) for each sigma level
Optional Labels: Show/hide sigma notation labels
Fibonacci Extensions
Four Extension Levels: 100%, 1.618x, 2.618x, 3.618x (all customizable)
Bidirectional: Projections both above and below the opening range
Optional Labels: Toggle percentage/multiplier labels
OR Rotation Levels
Configurable Increment: Set the point value for your instrument
Five Levels Each Direction: R±1 through R±5
Dynamic Labels: Show both rotation number and point value (e.g., "R+1 (65)")
Three Line Styles: Solid, Dashed, or Dotted
How to Use
Setup
Add the indicator to your chart
Select your trading session from the dropdown
Set the timeframe for first bar capture (typically 5-15 minutes)
Configure which projection methods you want to see (Statistical, Fibonacci, and/or Rotations)
For Day Traders
Scenario: Trading NQ during New York RTH
Session: Select "New York RTH (9:30am - 4:00pm)"
Timeframe: 5-minute (captures 9:30-9:35 bar)
Enable: OR Rotations with 65-point increments
Strategy:
Watch for acceptance/rejection at rotation levels
Use R+1/R-1 as initial profit targets
R+2/R-2 as extended targets
Statistical levels show when price is in "outlier" territory
and rotation levels
Performance Notes
The indicator limits objects to stay within TradingView's constraints (500 max)
If you enable all features, reduce "Maximum Historical Ranges" to prevent slowdown
Typical configuration: 10-20 historical ranges with all features enabled works well
Settings Guide
Session Settings
Session: Choose from pre-configured sessions or "Custom"
Custom Session Start/End: HHMM format (e.g., "0930" for 9:30am)
Timezone: Critical for accurate session detection
Opening Bar Format
Timeframe: The bar size for capturing the first bar's range
Show Midline: Toggle the mid-point line
Show Historical Ranges: Display previous sessions (recommended: leave ON)
Maximum Historical Ranges: Limit history to manage performance (1-500)
Range Style / MidLine Style: Solid, Dashed, or Dotted
Position: Label placement (Left or Right)
Show Prices: Include actual price values on labels
Statistical Levels
Lookback Periods: How many historical first bar ranges to analyze (default: 60)
Std Dev Multiplier 1/2: The sigma levels to project (default: 1.0 and 2.0)
All visual settings (colors, line width, label size)
Fibonacci Extensions
Show Fib Extensions: Enable/disable Fibonacci projections
Measured Move Extensions 1-4: The multipliers (default: 1.618, 2.618, 3.618, 4.618)
Visual customization options
OR Rotations
Rotation Increment: The point value for your instrument
NQ: 65 points
ES: 15 points
Adjust for other instruments based on their typical rotation behavior
Show Rotation Labels: Display level numbers and point values
Visual customization options
Use Cases
Gap Trading: When price gaps away from previous day's close, the first bar range shows the initial gap acceptance/rejection zone
Breakout Confirmation: Price breaking and holding above the first bar high with volume suggests trend day potential. Rotation levels provide measured targets.
Reversal Identification: Price reaching +2σ statistical level = rare event, potential exhaustion
Range Bound Days: Price oscillating between first bar high/low suggests range-bound session; trade reversals at extremes
Institutional Level Awareness: OR Rotations at 65 points (NQ) align with levels professional traders watch
Technical Notes
The indicator uses request.security() with lookahead=barmerge.lookahead_on to ensure the first bar levels are captured correctly
All drawing objects (lines, labels, fills) are managed in arrays with automatic cleanup to prevent memory issues
The statistical calculations use array.avg() and array.stdev() for accurate probability estimates
Rotation levels use individual line variables (like Fibonacci) rather than loops for reliability
Summary
This indicator is original in its combination of three distinct methodologies for projecting levels from a session's opening range:
Statistical Analysis - No other opening range indicator (to our knowledge) calculates standard deviation projections from historical first bar ranges
Time-Based Session Flexibility - Most OR indicators use only daily or fixed time periods; this allows any custom session window
Multiple Projection Methods - Traders can use statistical, Fibonacci, AND rotation levels together or separately

Emmanuel Optuma Bar Colors v2This script colours TradingView’s Bar Chart to follow a simple, powerful bar-type logic used in Optuma-style analysis.
It makes the chart easier to read by showing the relationship between:
Up bars
Down bars
Outside bars
Inside bars
🔍 Bar Type Detection
Up Bar
Close > Previous close
→ Indicates upward strength
→ Coloured Green
Down Bar
Close < Previous close
→ Indicates downward pressure
→ Coloured Red
Outside Bar
High > Previous high and Low < Previous low
→ Market expands its range
→ Coloured Blue
Inside Bar
High < Previous high and Low > Previous low
→ Market contracts inside the previous bar
→ Follows previous bar’s colour
🎨 Colour Rules Summary
Bar Type Colour Meaning
Up Bar 🟩 Green Bullish pressure
Down Bar 🟥 Red Bearish pressure
Outside Bar 🔵 Blue Range expansion, bar resets structure
Inside Bar Same as previous bar Market indecision, continuation
🧠 Inside Bar Logic (Very Important)
Inside bars always copy the colour of the previous bar, which means:
If the previous bar was Green → inside bar becomes Green
If the previous bar was Red → inside bar becomes Red
If the previous bar was Blue → inside bar becomes Blue
This keeps the structure visually consistent and easy to read.
📈 Why This Helps Traders
This approach makes it easier to see:
✔ Trend continuation
Inside bars keep the trend colour, making swings clearer.
✔ Trend weakness
Inside bars after outside bars show contraction.
✔ Breakouts
Blue outside bars stand out as moments of range expansion.
✔ Market rhythm
The chart becomes easier to follow for beginners and advanced traders.
🧩 How to Use It
Set chart type to Bars
Add the script
Hide default colours (barcolor replaces them)
This instantly transforms TradingView into a teaching-friendly chart like Optuma.

Bullish/Bearish Reversal Bars Indicator [Skyrexio]Introduction
Bullish/Bearish Reversal Bars Indicator leverages the combination of candlestick reversal bar pattern and the Williams Alligator indicator to help traders in understanding where there is a high probability of market reversal or correction. Indicator works for both bearish and bullish cases. It visualizes the bearish and bullish reversal bars with red and green dots and also plots the Alligator's lips to make it more convenient for traders to understand if price is above or below lips line (more information in "Methodology and it's justification" paragraph).
Features
Market Facilitation Index(MFI) filter: with the specified parameter in settings user can choose to filter bullish and bearish reversal bars which passed the MFI condition.
Awesome Oscillator(AO) filter: with the specified parameter in settings user can choose to filter bullish and bearish reversal bars which passed the AO condition.
Alerts: user can set up the alert and have notifications when bullish/bearish reversal bar has been printed.
Methodology and it's justification
In the script’s methodology, we apply the concepts of bullish and bearish reversal bars introduced by Bill Williams in his book Trading Chaos. So, what exactly is a bullish or bearish reversal bar? At its core, it’s a candlestick pattern. A bullish reversal bar is a bar that closes in its upper half, while a bearish reversal bar closes in its lower half.
Why is this type of bar significant? Let’s look at the bullish reversal bar as an example. When the price is trending upward, forming higher highs with each candle, and we suddenly see a bullish bar that makes a new high but ultimately closes in its lower half, it signals a shift in control. Bears have taken control toward the end of that candle's period, pushing the price back down. This can be interpreted as a sign of trend weakness and a potential reversal (or at least a correction).
An additional key point is that a reversal bar often indicates a possible end to the trend. Therefore, for a reversal bar to be valid, several preceding candles should show lower highs (for bullish bars) or higher lows (for bearish bars), reinforcing the likelihood of a trend change.
The second step on methodology is the location of the bar related to Williams Alligator. The Williams Alligator Indicator, developed by Bill Williams, is a technical analysis tool that helps traders identify trends and potential turning points in the market. It consists of three lines, often called the jaw, teeth, and lips of the alligator, each representing different moving averages:
Jaw (Blue Line): A slower moving average, typically a 13-period smoothed moving average shifted 8 bars into the future.
Teeth (Red Line): A medium moving average, typically an 8-period smoothed moving average shifted 5 bars into the future.
Lips (Green Line): A faster moving average, usually a 5-period smoothed moving average shifted 3 bars into the future.
When the three lines are spread out and moving in the same direction, it suggests a strong trend (the "alligator" is "awake and feeding"). When they intertwine, the indicator suggests that the market is moving sideways, or in a range, signaling a lack of clear trend (the "alligator" is "sleeping"). Traders use the Alligator Indicator to enter trades in trending markets and avoid trades in choppy, non-trending markets.
If bullish reversal bar's high is not below and bearish reversal bar's low is not above all three Alligator's lines (jaw, lips, teeth) they cannot be interpreted as these types of bars. It can be explained as following: if we are waiting for the bullish reversal bar it shall be reversal from downtrend. If price is not below all three lines it can't be interpret as the downtrend according to this method. The opposite is true for the bearish reversal bar.
All described above are obligatory conditions for reversal bar, now let's discuss two not obligatory conditions. The first one is Market Facilitation Index (MFI) restriction. Let's briefly look what is MFI. The Market Facilitation Index (MFI) is a technical indicator that measures the price movement per unit of volume, helping traders gauge the efficiency of price movement in relation to trading volume. Here's how you can calculate it:
MFI = (High−Low)/Volume
MFI can be used in combination with volume, so we can divide 4 states. Bill Williams introduced these to help traders interpret the interaction between volume and price movement. Here’s a quick summary:
Green Window (Increased MFI & Increased Volume): Indicates strong momentum with both price and volume increasing. Often a sign of trend continuation, as both buying and selling interest are rising.
Fake Window (Increased MFI & Decreased Volume): Shows that price is moving but with lower volume, suggesting weak support for the trend. This can signal a potential end of the current trend.
Squat Window (Decreased MFI & Increased Volume): Shows high volume but little price movement, indicating a tug-of-war between buyers and sellers. This often precedes a breakout as the pressure builds.
Fade Window (Decreased MFI & Decreased Volume): Indicates a lack of interest from both buyers and sellers, leading to lower momentum. This typically happens in range-bound markets and may signal consolidation before a new move.
For our purposes we are interested in squat bars. This is the sign that volume cannot move the price easily. This type of bar increases the probability of trend reversal. In this indicator we added to enable the MFI filter of reversal bars. If potential reversal bar or two preceding bars have squat state this bar can be interpret as a reversal one.
The second additional filter is Awesome Oscillator. The Awesome Oscillator (AO), developed by Bill Williams, is a momentum indicator that measures market momentum by comparing recent price action to a longer historical context. It helps traders identify potential trend reversals and the strength of trends. Formula:
AO = SMA5(Median Price) − SMA34(Median Price)
where:
Median Price = (High + Low) / 2
SMA5 = 5-period Simple Moving Average of the Median Price
SMA 34 = 34-period Simple Moving Average of the Median Price
If AO is decreasing momentum is bearish, if increasing - bullish. According to Bill Williams approach reversal bars are the potential trades against the trend. As a result we added second filter for bullish reversal bars AO shall be decreasing, for bearish increasing.
How to use indicator
Apply it to desired chart and time frame. It works on every time frame.
Setup the filters with the "Enable MFI" and "Enable AO" checkboxes in the settings. By default they are turned on.
Analyze the price action. Indicator plotted the white line, this is the lips of an Alligator. It will help you to understand how price is moving in comparison to lips line. Indicator will print the green dot and text "BULL" below it current bar is bullish reversal. It will print the red dot and text "BEAR" above it if current bar is interpreted by algorithm as a bearish reversal.
Set up the alerts if it's needed. Indicator has two custom alerts called "Bullish reversal bar has been printed" and "Bearish reversal bar has been printed"
Disclaimer:
Educational and informational tool reflecting Skyrex commitment to informed trading. Past performance does not guarantee future results. Test indicators before live implementation.

3 Bar PlayThe "3 Bar Play" is a simple yet powerful pattern that traders look for as a signal of potential market movement. The pattern is defined by a sequence of three bars (or candlesticks) on the chart:
I saw Rake Trades post about this pattern. It not a new concept just wanted it to automatically be plotted on my chart rather then looking out for it.
Up 3 Bar Play: This pattern signals a potential upward movement.
The first bar (two bars ago from the current bar) must close higher than it opened, indicating a bullish bar.
The second bar (the previous bar) must close lower than it opened, indicating a bearish bar, but its low should be higher than the low of the first bar, showing that bears couldn't push the price much lower.
The third bar (the current bar) must open and close higher than the previous bar, closing above the high of the second bar, confirming the bullish sentiment.
Down 3 Bar Play: This pattern signals a potential downward movement.
The first bar (two bars ago from the current bar) must close lower than it opened, indicating a bearish bar.
The second bar (the previous bar) must close higher than it opened, indicating a bullish bar, but its high should be lower than the high of the first bar, showing that bulls couldn't push the price much higher.
The third bar (the current bar) must open and close lower than the previous bar, closing below the low of the second bar, confirming the bearish sentiment.
Plotting the Patterns
plotshape(): This function is used to plot shapes on the chart to visually highlight where the patterns occur.
For an "Up 3 Bar Play", a green triangle pointing upwards is plotted below the bullish pattern to indicate a potential buy signal.
For a "Down 3 Bar Play", a red triangle pointing downwards is plotted above the bearish pattern to indicate a potential sell signal.
Key Points
This script helps traders quickly identify potential entry points based on the 3 Bar Play pattern without manually scanning the charts.
It's important to remember that no single pattern guarantees market movements, and it's often used in conjunction with other indicators and analysis methods.
This script is a practical tool for those looking to incorporate the 3 Bar Play pattern into their trading strategy, offering a clear visual cue on the chart whenever the pattern is identified.
Please understand the 3 bar play and where you should set your stop loss

RedK Bar Strength Inspector / Bar Strength Index (BSI)Summary
=========
The Bar Strength Inspector / Bar Strength Index (BSI) is an indicator that evaluates each price bar against a user-selectable set of "strength categories" - BSI then calculates a combined score from these categories and provides an index - plotted as a centered oscillator - roughly similar to the way Relative Strength Index (RSI) works, which can be used to evaluate the strength of price move and the possibilities of trend continuation or reversal.
Background
=============
BSI is like a Swiss-army knife with many components - so apologies upfront if this guide gets long - and i know i will still miss few pieces that needs explaining. please alert me if something is not clear.
BSI is an advanced / re-built version of my Ultimate Trader Oscillator (UTO)
I continue to believe that one of the best trading tools that i can use, is a tool that can automate the visual inspection of the price chart - a tool that simulates (and quantifies in numbers/score) the way we visually look at a certain price bar, and make a judgement that "this is a strong bar, so I expect the trend down to possibly reverse" - BSI is a an attempt to achieve that. An attempt to answer a simple question (in a quantifiable manner):
how strong / weak is this price bar - how does it compare to previous bars ? what is the average of that strength (or weakness) for the last few bars ?(based on the trader's preferred timeframe)
How does BSI work
====================
* BSI will inspect and evaluate each bar against various (selectable) strength categories.
* BSI will give a -100/+100 score against each "strength category", then combine these scores into an index and create an average of that index
* the average index (also called BSI) will be calculated for both a short and long lengths
* the short length represents "local / short-term" strength - plotted as a blue/orange line (with an additional signal line to make easier to "read")
* the long-term reflects the broader bias (sentiment) - plotted as green/red area (or mountain)
How is BSI different from UTO
=============================
- I wrote BSI from the ground up to validate each scoring calculation and the resulting outcomes - so i would consider BSI to be more accurate than UTO
- i wrote BSI in a way to make it a lot more flexible. BSI allows me to choose which category to include in the "inspection"
- the strength categories are streamlined to reflect single bar strength, strength from bar-to-bar, and relative strength (range and volume) - they have also been chosen in a way that map to commonly used Technical Analysis concepts, to increase the value of BSI and the ability to compare with other common indicators (for example, BoP, Stochastic, Relative Volume and RSI)
- added the table view - which i use mainly to track the action within the current bar - and to learn more about how to evaluate strength vs weakness with various chart patterns
- UTO still represents the foundation of this work - but i will not update UTO any longer so all changes will be applied to the BSI- i have been using both UTO and BSI to guide my trading for the past few months.
- couple of other features in BSI:
- support for instruments with no volume data (even if the user chooses volume) - number of inspection categories will show as "7" in that case
- ability to plot the individual category scores, and the total weighted score (for the selected categories) - these plots are hidden by default
- ability to see the total score for all 8 (or 7 in case no volume data) categories regardless of how many are active - but only in the table view
- ability to be used as both a lower (independent) and a top indicator (on the price chart) -- see below examples.
Structure of the BSI Strength Categories
=====================================
The first 3 inspected strength categories focus on "single bar strength", they evaluate how the bar closes compared to the low, the Balance of Power (BoP) and the relative BoP
The next 3 categories focus on evaluating the bar-to-bar strength: how the bar closes compared to the low of the 2-bar range, how the bar closes compared to prior close - and the relative "shift"
The last 2 "strength" categories evaluate the relative range of bar compared to recent average range and the relative volume.
Understanding the bar inspection & scoring approach
==================================
During inspection for each category, a score is calculated with a value between 0 to 100, then it will be made "directional" - which means that +100 represents highest possible strength score and a value of -100 is the highest possible "weakness" score
Note that a 0 score doesn't mean "weak" - but rather "neutral" - this can be a bit confusing until we get used to the way BSI scoring works.
Example: in relative volume, a bar associated with the lowest volume observed during the lookback length, will have a 0 relative volume score -- while a bar associated with the highest volume observed will have either a +100 or a -100 score (depending on whether it's an up or down bar) - same thing for relative range.. and so on
Here are the 8 strength categories evaluated by the BSI
1 Bar closing score
2 Body : Spread (BoP) ratio
3 Relative BoP
4 2-bar Closing Score
5 2-bar Shift Ratio (Shift : 2R)
6 Relative Shift
7 Relative Range
8 Relative Volume
Specific meaning of keywords / concepts (within BSI context):
======================================================
Relative : compared to recently observed values (= within Lookback # bars)
Shift : the change in closing value vs prior bar
Bar Spread : high - low
Range : True Range ..... as in the tr() Pine function, so not to be confused with "spread"
More detailed notes about scoring and calculations for each strength category are included within the code
BSI Settings:
=============
Here is a chart showing the main sections in the BSI Settings box and how to configure it to your preference
Using the BSI:
================
- I use BSI for 2 main scenarios
(1) Guiding my Day-to-day trading: the usage here is roughly similar to a volume-weighted dual-period RSI .. with a lot more options - picking and choosing between the 8 strength categories in BSI allows for 255 variations of "strength evaluations" - a trader can choose to focus only on "single bar strength" score categories, so only picks the top 3 in the settings - another trader wants to track only the strength reflected by the relative range and relative volume, so picks the lower 2 categories. another trader wants to use BSI as a volume weighted Balance of Power.. and so on. Many combinations are possible.
i have added couple of charts that explain some of the "signals" we can expect from BSI (below chart) - note that i use the "Green/Red mountain plot" as the "prevailing sentiment" - as it confirms the longer term strength (or weakness). the BSI line plot reflects the short term strength and not necessarily tied directly to how the price is moving (see example in the chart - and also compare to how RSI works)
- 2 important points here if you plan to use BSI in trading: set BSI up on a 1-min or 5-min chart and watch how it works to learn how it evaluates each bar - and always use BSI in combination with other indicators that you are familiar with to validate and confirm any signals
(Important note: do not react to the values in the table as they change in real time - i found that to be very tempting - rather look at the broader context and the flow of the BSI / sentiment) - you can also test BSI with Paper Trading in TV - it's like a new car that you need some time to get used to :)
(2) Use BSI to help learn chart / pattern analysis - watch BSI print scores against the various categories in real time to hone your chart (pattern) reading skills and how to evaluate strength of various bar shapes - for example, a bar that closes at the high but does not reach the mid point of the prior bar - strong or weak ? how about a doji or a hammer ? ...etc
Chart showing main usage scenarios
Example BSI in real time:
======================
I hope this work helps few fellow traders hone their trading skills, or help inspire other ideas - please let me know if you have feedback or suggestions.

Red and Green Ignored Bar by Oliver VelezOn this occasion I present a script that detects Ignored Red Candles and Ignored Green Candles, basically it is a Price Action event that indicates a possible continuation of the current trend and gives the opportunity to climb it with a Very tight risk, before delving into detail I would like to leave this note:
Note: the detection of this event does not guarantee that the signal will be good, the trader must have the ability to determine its quality based on aspects such as trend, maturity, support / resistance levels, expansion / contraction of the market, risk / benefit, etc, if you do not have knowledge about this you should not use this indicator since using it without a robust trading plan and experience could cause you to partially or totally lose your money, if this is your case you should train before If you try to extract money from the market, this script was created to be another tool in your trading plan in order to configure the rules at your discretion, execute them consistently and have AUTOMATIC ALERTS when the event occurs, which is where I find more value because you can have many instruments waiting for the event to be generated, in the time frame you want and without having to observe the mer When the alert is generated, the Trader should evaluate the quality of the alert and define whether or not to execute it (higher timeframes, they can give you more time to execute the operation correctly).
Let's continue….
This event was created by Oliver Velez recognized trader / mentor of price action, the event has a very interesting particularity since it allows to take a position with a very limited risk in trend movements, this achieves favorable operations of good ratio and small losses when taking An adjusted risk, if the trade works, a good ratio is quickly achieved and we agree with a key point in the “Keep small losses and big profits” trading, this makes it easier to have a positive mathematical hope when your level of Success is not very high, so leave you in the field of profitability.
THE EVENT:
The event has a bullish configuration (Ignored Red Candle) and a bearish configuration (Ignored Green Candle), below I detail the “Hard” rules (later I explain why “Hard”):
1- Last 3 bars have to be GREEN-RED-GREEN (possible bullish configuration) or RED-GREEN-RED (possible bearish configuration), the first bar is called Control Bar, the second is called Ignored Bar and the third Signal Bar as shown in the following image:
2- Be in a trend determined by simple moving averages (Slow of 20 periods and Fast of 8 periods), as a general rule you can take the direction of MA20 but the Trader has to determine if there is a trend movement or not.
3- Control bar of good range, little tail and with a body greater than 55%.
4- Ignored bar preferably narrow range, little tail and that is located in the upper 1/3 of the control bar.
5- Signal bar cannot override the minimum of the ignored bar.
6- Activation / Confirmation of event by means of signal bar in overcoming the body of the ignored bar.
Some examples of ignored bars (with “Hard” and “Flexible” rules):
Features and configuration of the indicator:
To access the indicator settings, press the wheel next to the indicator name VVI_VRI "Configuration options".
- Operation mode (Filtering Type):
• Filtering Complete: all filters activated according to the configuration below.
• Without Filtering: all filters deactivated, all VRI / VVI are displayed without any selection criteria.
• Trend Filter only: shows only VRI / VVI that are in accordance with what is set in “Trend Settings”
- Configuration Moving Averages:
• See Slow Media: slow moving average display with direction detection and color change.
• See Fast Media: display of fast moving average with direction detection and color change.
• Type: possibility to choose the type of media: DEMA, EMA, HullMA, SMA, SSMA, SSMA, TEMA, TMA, VWMA, WMA, ZEMA)
• Period: number of previous bars.
• Source: possibility to choose the type of source, open, close, high, low, hl2 hlc3, ohlc4.
• Reaction: this configuration affects the color change before a change of direction, 1 being an immediate reaction and higher values, a more delayed reaction obtaining les false "changes of direction", a value of 3 filters the direction quite well.
- Trend Configuration
• Uptrend Condition P / VRI: possibility to select any of these conditions:
o Bullish MA direction
o Quick bullish MA direction
o Slow and fast bullish MA direction
o Price higher than slow MA
o Price higher than fast MA
o Price higher than slow and fast MA
o Price higher than slow MA and bullish direction
o Price higher than fast MA and bullish direction
o Price higher than slow, fast MA and bullish direction
o No condition
• Condition P / VVI bear trend: possibility of selecting any of these conditions:
o Slow bearish MA direction
o Fast bearish MA direction
o Slow and fast bearish MA direction
o Price less than slow MA
o Price less than fast MA
o Price less than slow and fast MA
o Price lower than slow MA and bearish direction
o Price less than fast MA and bearish direction
o Price less than slow, fast MA and bearish direction
o No condition
- Control bar configuration
• Minimum body percentage%: possibility to select what body percentage the bar must have.
• Paint control bar: when selected, paint the control bar.
• See control bar label: when selected, a label with the legend BC is plotted.
- Configuration bar ignored
• Above X% of the control bar: possibility to select above what percentage of the control bar the ignored bar must be located.
• Paint ignored bar: when selected, paint the ignored bar.
- Signal bar configuration
• You cannot override the minimum of the ignored bar: when selected, the condition is added that the signal bar cannot override the minimum of the ignored bar.
• Paint signal bar: when selected, paint the signal bar.
• See arrow: when selected it shows the direction arrow of the possible movement.
• See bear and arrow: when selected it shows bear and arrow label
• See bull and arrow: when selected it shows bull and arrow label
The following image shows the ignored bar and painted signal:
- Take profit / loss
The profit / loss taking varies depending on the trader and its risk / monetary plan, the proposal is a recommendation based on the nature of the event that is to have a small risk unit (stop below the minimum of the ignored bar), look for objectives in ratios greater than 2: 1 and eliminate the risk in 1: 1 by taking the stop to BE, all parameters are configurable and are the following:
• See recommended stop loss and take profit: trace the levels of Stop, BE, TP1 and TP2, as well as their prices to know them quickly based on the assumed risk
• To: select which event you want to draw the SL and TP (VRI, VVI)
• Extend stop loss line x bars: allows extending the stop line by x number of bars
• Extend take profit line x bars: allows extending the stop line by x number of bars
• Ratio to move to break even: allows you to select the minimum ratio to move stop to break even (default 1: 1)
• Take profit 1 ratio: allows you to select the ratio for take profit 1 (default 2: 1)
• Take profit 2 ratio: allows you to select the ratio for take profit 2 (default 4: 1)
- Alerts
• It is possible to configure the following alerts:
-VRI DETECTED
-VVI DETECTED
-VRI / VVI DETECTED
Final Notes:
- The term hard rules refers to the fact that an event is sought with the rules detailed above to obtain a high quality event but this brings 2 situations to consider, less
number of events and events that are generated in a strong impulse may be leaked, a very large control bar followed by an ignored narrow body away from moving averages, despite having a good chance of continuing, taking a stop very tight in a strong impulse you can touch it by the simple fact of the own volatility at that time.
- The setting of the parameters “Minimum body percentage% (control bar)”, “Above x% of the control bar (bar ignored)” and “Cannot override the minimum of the ignored bar” can bring large Benefits in terms of number of events and that can also be of high quality, feel free to find the best configuration for your instrument to operate.
- It is recommended to look for trending events, near moving averages and at an early stage of it.
- The display of several nearby VRIs or VVIs in an advanced trend may indicate a depletion of it.
- The alerts can be worked in 2 ways: at the closing of the candle (confirms event but the risk unit may be larger or smaller) or immediately the body of the ignored bar is exceeded, in case you are operating from the mobile and miss many events because of the short time I recommend that you operate in a superior time frame to have more time.
- The indicator is configured with “flexible” rules to have more events, but without any important criteria, each trader has to look for the best configuration that suits his instrument.
- It is recommended to partially close the operation based on the ratio and always keep a part of the position to apply manual trailing stop and try to maximize profits.
The code is open feel free to use and modify it, a mention in credits is appreciated.
If you liked this SCRIPT THUMB UP!
Greetings to all, I wish you much green!

Trend Bars with Counter Table# TradingView Trend Bar Indicator Explained
## Indicator Overview
This is a TradingView indicator designed to identify and count **Trend Bars**. It not only visually marks strong bullish and bearish bars on the chart but also displays a data table in the upper right corner that tracks the distribution of trend bars across different periods, helping traders quickly assess market bias.
## Core Concept: What is a Trend Bar?
The indicator defines two types of trend bars:
### Bull Trend Bar
- **Condition**: Close > Open (bullish candle)
- **Strength Requirement**: Body size ≥ 75% of total candle range
```
Body Length = |Close - Open|
Total Candle Range = High - Low
Criteria: Body Length ≥ 0.75 × Total Candle Range
```
This means both upper and lower wicks are very short, representing a very strong bullish candle.
### Bear Trend Bar
- **Condition**: Close < Open (bearish candle)
- **Strength Requirement**: Body size ≥ 75% of total candle range
Similarly, this represents a strong bearish candle with minimal wicks and a full body.
## Visual Markers
The indicator marks qualifying candles with:
- **Green upward arrow**: Bull trend bar, appears below the candle
- **Red downward arrow**: Bear trend bar, appears above the candle
## Statistical Function
The indicator uses a **rolling array** (storing up to 1000 trend bars) to track historical data, then counts trend bar distribution across 5 different periods:
| Period | Statistical Range |
|--------|------------------|
| Group 1 | Last 7 trend bars |
| Group 2 | Last 15 trend bars |
| Group 3 | Last 21 trend bars |
| Group 4 | Last 29 trend bars |
| Group 5 | Last 35 trend bars |
**Note**: This counts "the last N trend bars," not "the last N candles." Only candles meeting the trend bar criteria are included.
## Data Table Interpretation
The table in the upper right corner contains 5 columns:
1. **Last N**: The set statistical range (7, 15, 21, 29, 35)
2. **Total**: Actual number of trend bars counted (may be less than target initially)
3. **Bull**: Number of bull trend bars (displayed in green)
4. **Bear**: Number of bear trend bars (displayed in red)
5. **Bias**: Market bias
- "bull" (green): More bull trend bars
- "bear" (red): More bear trend bars
## Practical Applications
### 1. Assess Short-term Momentum
Check the distribution of the last 7 trend bars. If bull trend bars dominate (e.g., 5:2), it indicates strong short-term buying pressure.
### 2. Identify Trend Strength
If multiple periods show the same Bias direction, the trend is very clear. For example, all 5 periods showing "bull" is a strong upward signal.
### 3. Spot Trend Reversals
When short-term bias (7 bars) opposes long-term bias (35 bars), it may signal a trend change in progress.
### 4. Combine with Other Indicators
Use this indicator alongside moving averages, support/resistance levels, and other tools to improve trading decision accuracy.
## Technical Highlights
- **Dynamic Array Management**: Uses `array.unshift()` to add new data at the array's beginning, ensuring the latest trend bars are always first
- **Efficient Statistics**: Quickly calculates bull/bear distribution through loop iteration over specified array ranges
- **Adaptive Display**: Shows actual available count when historical data is insufficient
- **Real-time Updates**: Only updates the table on the last bar to avoid unnecessary calculations
## Conclusion
The core value of this indicator lies in **quantifying price action**. By identifying strong candles with full bodies and clear direction, then tracking their distribution, traders can quickly grasp the balance of market forces and make more informed trading decisions. Whether for intraday trading or swing trading, this tool provides valuable reference information.

Bullish Reversal Bar Strategy [Skyrexio]Overview
Bullish Reversal Bar Strategy leverages the combination of candlestick pattern Bullish Reversal Bar (description in Methodology and Justification of Methodology), Williams Alligator indicator and Williams Fractals to create the high probability setups. Candlestick pattern is used for the entering into trade, while the combination of Williams Alligator and Fractals is used for the trend approximation as close condition. Strategy uses only long trades.
Unique Features
No fixed stop-loss and take profit: Instead of fixed stop-loss level strategy utilizes technical condition obtained by Fractals and Alligator or the candlestick pattern invalidation to identify when current uptrend is likely to be over (more information in "Methodology" and "Justification of Methodology" paragraphs)
Configurable Trading Periods: Users can tailor the strategy to specific market windows, adapting to different market conditions.
Trend Trade Filter: strategy uses Alligator and Fractal combination as high probability trend filter.
Methodology
The strategy opens long trade when the following price met the conditions:
1.Current candle's high shall be below the Williams Alligator's lines (Jaw, Lips, Teeth)(all details in "Justification of Methodology" paragraph)
2.Price shall create the candlestick pattern "Bullish Reversal Bar". Optionally if MFI and AO filters are enabled current candle shall have the decreasing AO and at least one of three recent bars shall have the squat state on the MFI (all details in "Justification of Methodology" paragraph)
3.If price breaks through the high of the candle marked as the "Bullish Reversal Bar" the long trade is open at the price one tick above the candle's high
4.Initial stop loss is placed at the Bullish Reversal Bar's candle's low
5.If price hit the Bullish Reversal Bar's low before hitting the entry price potential trade is cancelled
6.If trade is active and initial stop loss has not been hit, trade is closed when the combination of Alligator and Williams Fractals shall consider current trend change from upward to downward.
Strategy settings
In the inputs window user can setup strategy setting:
Enable MFI (if true trades are filtered using Market Facilitation Index (MFI) condition all details in "Justification of Methodology" paragraph), by default = false)
Enable AO (if true trades are filtered using Awesome Oscillator (AO) condition all details in "Justification of Methodology" paragraph), by default = false)
Justification of Methodology
Let's explore the key concepts of this strategy and understand how they work together. The first and key concept is the Bullish Reversal Bar candlestick pattern. This is just the single bar pattern. The rules are simple:
Candle shall be closed in it's upper half
High of this candle shall be below all three Alligator's lines (Jaw, Lips, Teeth)
Next, let’s discuss the short-term trend filter, which combines the Williams Alligator and Williams Fractals. Williams Alligator
Developed by Bill Williams, the Alligator is a technical indicator that identifies trends and potential market reversals. It consists of three smoothed moving averages:
Jaw (Blue Line): The slowest of the three, based on a 13-period smoothed moving average shifted 8 bars ahead.
Teeth (Red Line): The medium-speed line, derived from an 8-period smoothed moving average shifted 5 bars forward.
Lips (Green Line): The fastest line, calculated using a 5-period smoothed moving average shifted 3 bars forward.
When the lines diverge and align in order, the "Alligator" is "awake," signaling a strong trend. When the lines overlap or intertwine, the "Alligator" is "asleep," indicating a range-bound or sideways market. This indicator helps traders determine when to enter or avoid trades.
Fractals, another tool by Bill Williams, help identify potential reversal points on a price chart. A fractal forms over at least five consecutive bars, with the middle bar showing either:
Up Fractal: Occurs when the middle bar has a higher high than the two preceding and two following bars, suggesting a potential downward reversal.
Down Fractal: Happens when the middle bar shows a lower low than the surrounding two bars, hinting at a possible upward reversal.
Traders often use fractals alongside other indicators to confirm trends or reversals, enhancing decision-making accuracy.
How do these tools work together in this strategy? Let’s consider an example of an uptrend.
When the price breaks above an up fractal, it signals a potential bullish trend. This occurs because the up fractal represents a shift in market behavior, where a temporary high was formed due to selling pressure. If the price revisits this level and breaks through, it suggests the market sentiment has turned bullish.
The breakout must occur above the Alligator’s teeth line to confirm the trend. A breakout below the teeth is considered invalid, and the downtrend might still persist. Conversely, in a downtrend, the same logic applies with down fractals.
How we can use all these indicators in this strategy? This strategy is a counter trend one. Candle's high shall be below all Alligator's lines. During this market stage the bullish reversal bar candlestick pattern shall be printed. This bar during the downtrend is a high probability setup for the potential reversal to the upside: bulls were able to close the price in the upper half of a candle. The breaking of its high is a high probability signal that trend change is confirmed and script opens long trade. If market continues going down and break down the bullish reversal bar's low potential trend change has been invalidated and strategy close long trade.
If market really reversed and started moving to the upside strategy waits for the trend change form the downtrend to the uptrend according to approximation of Alligator and Fractals combination. If this change happens strategy close the trade. This approach helps to stay in the long trade while the uptrend continuation is likely and close it if there is a high probability of the uptrend finish.
Optionally users can enable MFI and AO filters. First of all, let's briefly explain what are these two indicators. The Awesome Oscillator (AO), created by Bill Williams, is a momentum-based indicator that evaluates market momentum by comparing recent price activity to a broader historical context. It assists traders in identifying potential trend reversals and gauging trend strength.
AO = SMA5(Median Price) − SMA34(Median Price)
where:
Median Price = (High + Low) / 2
SMA5 = 5-period Simple Moving Average of the Median Price
SMA 34 = 34-period Simple Moving Average of the Median Price
This indicator is filtering signals in the following way: if current AO bar is decreasing this candle can be interpreted as a bullish reversal bar. This logic is applicable because initially this strategy is a trend reversal, it is searching for the high probability setup against the current trend. Decreasing AO is the additional high probability filter of a downtrend.
Let's briefly look what is MFI. The Market Facilitation Index (MFI) is a technical indicator that measures the price movement per unit of volume, helping traders gauge the efficiency of price movement in relation to trading volume. Here's how you can calculate it:
MFI = (High−Low)/Volume
MFI can be used in combination with volume, so we can divide 4 states. Bill Williams introduced these to help traders interpret the interaction between volume and price movement. Here’s a quick summary:
Green Window (Increased MFI & Increased Volume): Indicates strong momentum with both price and volume increasing. Often a sign of trend continuation, as both buying and selling interest are rising.
Fake Window (Increased MFI & Decreased Volume): Shows that price is moving but with lower volume, suggesting weak support for the trend. This can signal a potential end of the current trend.
Squat Window (Decreased MFI & Increased Volume): Shows high volume but little price movement, indicating a tug-of-war between buyers and sellers. This often precedes a breakout as the pressure builds.
Fade Window (Decreased MFI & Decreased Volume): Indicates a lack of interest from both buyers and sellers, leading to lower momentum. This typically happens in range-bound markets and may signal consolidation before a new move.
For our purposes we are interested in squat bars. This is the sign that volume cannot move the price easily. This type of bar increases the probability of trend reversal. In this indicator we added to enable the MFI filter of reversal bars. If potential reversal bar or two preceding bars have squat state this bar can be interpret as a reversal one.
Backtest Results
Operating window: Date range of backtests is 2023.01.01 - 2024.12.31. It is chosen to let the strategy to close all opened positions.
Commission and Slippage: Includes a standard Binance commission of 0.1% and accounts for possible slippage over 5 ticks.
Initial capital: 10000 USDT
Percent of capital used in every trade: 50%
Maximum Single Position Loss: -5.29%
Maximum Single Profit: +29.99%
Net Profit: +5472.66 USDT (+54.73%)
Total Trades: 103 (33.98% win rate)
Profit Factor: 1.634
Maximum Accumulated Loss: 1231.15 USDT (-8.32%)
Average Profit per Trade: 53.13 USDT (+0.94%)
Average Trade Duration: 76 hours
How to Use
Add the script to favorites for easy access.
Apply to the desired timeframe and chart (optimal performance observed on 4h ETH/USDT).
Configure settings using the dropdown choice list in the built-in menu.
Set up alerts to automate strategy positions through web hook with the text: {{strategy.order.alert_message}}
Disclaimer:
Educational and informational tool reflecting Skyrex commitment to informed trading. Past performance does not guarantee future results. Test strategies in a simulated environment before live implementation
These results are obtained with realistic parameters representing trading conditions observed at major exchanges such as Binance and with realistic trading portfolio usage parameters.

P.I.B. System (Pin Bar | Inside Bar) // AlgoFyreThe "P.I.B. System (Pin Bar | Inside Bar)" identifies bullish and bearish pin bars and inside bars on a price chart. It highlights potential market reversals by plotting labels and colorizing bars, providing traders with visual cues for better decision-making.
Description
The "P.I.B. System (Pin Bar | Inside Bar)" script is designed to help traders identify potential reversal points in the market by detecting bullish and bearish pin bars and inside bars. A pin bar is a candlestick pattern that indicates a potential reversal, characterized by a small body and a long wick. Inside bars are candlestick patterns where the current bar's high and low are within the previous bar's range, indicating potential consolidation before a breakout.
This script allows customization of various parameters to fine-tune the identification of pin bars and inside bars. When a pin bar or an inside bar is detected, the script plots a label on the chart and colorizes the bars to highlight these patterns. This tool is useful for traders looking to identify potential reversal points and make informed trading decisions.
Explanation of All Options
Pin-Wick Size Ratio Minimum Value : The minimum ratio of the wick size to the total candle size for a pin bar to be considered valid. Default is 0.66.
Candle Body Size Ratio Maximum Value : The maximum ratio of the body size to the total candle size for a pin bar to be considered valid. Default is 0.4.
Handle-Wick Wick Size Ratio Maximum Value : The maximum ratio of the opposite wick size to the total candle size for a pin bar to be considered valid. Default is 0.4.
Filter Out Small Candles : Option to filter out small candles based on the previous candle's size. Default is true.
Small Candle Size Ratio : The ratio used to determine if a candle is considered small compared to the previous candle. Default is 2.0.
Identify Inside Bars : Option to identify inside bars following a pin bar. Default is true.
Show Only P.I.B. : Option to show only the bars where a pin bar is followed by an inside bar. Default is true.
Hide Horizontal Rays : Option to hide horizontal rays drawn from the last identified pin bars. Default is false.
How to Use
To use this script, add it to your chart. Customize the input parameters to match your trading strategy. The script will automatically identify and highlight bullish and bearish pin bars and inside bars on the chart. Use the visual cues provided by the labels and colorized bars to make informed trading decisions.
N Bar Reversal Detector [LuxAlgo]The N Bar Reversal Detector is designed to detect and highlight N-bar reversal patterns in user charts, where N represents the length of the candle sequence used to detect the patterns. The script incorporates various trend indicators to filter out detected signals and offers a range of customizable settings to fit different trading strategies.
🔶 USAGE
The N-bar reversal pattern extends the popular 3-bar reversal pattern. While the 3-bar reversal pattern involves identifying a sequence of three bars signaling a potential trend reversal, the N-bar reversal pattern builds on this concept by incorporating additional bars based on user settings. This provides a more comprehensive indication of potential trend reversals. The script automates the identification of these patterns and generates clear, visually distinct signals to highlight potential trend changes.
When a reversal chart pattern is confirmed and aligns with the price action, the pattern's boundaries are extended to create levels. The upper boundary serves as resistance, while the lower boundary acts as support.
The script allows users to filter patterns based on the trend direction identified by various trend indicators. Users can choose to view patterns that align with the detected trend or those that are contrary to it.
🔶 DETAILS
🔹 The N-bar Reversal Pattern
The N-bar reversal pattern is a technical analysis tool designed to signal potential trend reversals in the market. It consists of N consecutive bars, with the first N-1 bars used to identify the prevailing trend and the Nth bar confirming the reversal. Here’s a detailed look at the pattern:
Bullish Reversal : In a bullish reversal setup, the first bar is the highest among the first N-1 bars, indicating a prevailing downtrend. Most of the remaining bars in this sequence should be bearish (closing lower than where they opened), reinforcing the existing downward momentum. The Nth (most recent) bar confirms a bullish reversal if its high price is higher than the high of the first bar in the sequence (standard pattern). For a stronger signal, the closing price of the Nth bar should also be higher than the high of the first bar.
Bearish Reversal : In a bearish reversal setup, the first bar is the lowest among the first N-1 bars, indicating a prevailing uptrend. Most of the remaining bars in this sequence should be bullish (closing higher than where they opened), reinforcing the existing upward momentum. The Nth bar confirms a bearish reversal if its low price is lower than the low of the first bar in the sequence (standard pattern). For a stronger signal, the closing price of the Nth bar should also be lower than the low of the first bar.
🔹 Min Percentage of Required Candles
This parameter specifies the minimum percentage of candles that must be bullish (for a bearish reversal) or bearish (for a bullish reversal) among the first N-1 candles in a pattern. For higher values of N, it becomes more challenging for all of the first N-1 candles to be consistently bullish or bearish. By setting a percentage value, P, users can adjust the requirement so that only a minimum of P percent of the first N-1 candles need to meet the bullish or bearish condition. This allows for greater flexibility in pattern recognition, accommodating variations in market conditions.
🔶 SETTINGS
Pattern Type: Users can choose the type of the N-bar reversal patterns to detect: Normal, Enhanced, or All. "Normal" detects patterns that do not necessarily surpass the high/low of the first bar. "Enhanced" detects patterns where the last bar surpasses the high/low of the first bar. "All" detects both Normal and Enhanced patterns.
Reversal Pattern Sequence Length: Specifies the number of candles (N) in the sequence used to identify a reversal pattern.
Min Percentage of Required Candles: Sets the minimum percentage of the first N-1 candles that must be bullish (for a bearish reversal) or bearish (for a bullish reversal) to qualify as a valid reversal pattern.
Derived Support and Resistance: Toggles the visibility of the support and resistance levels/zones.
🔹 Trend Filtering
Filtering: Allows users to filter patterns based on the trend indicators: Moving Average Cloud, Supertrend, and Donchian Channels. The "Aligned" option only detects patterns that align with the trend and conversely, the "Opposite" option detects patterns that go against the trend.
🔹 Trend Indicator Settings
Moving Average Cloud: Allows traders to choose the type of moving averages (SMA, EMA, HMA, etc.) and set the lengths for fast and slow moving averages.
Supertrend: Options to set the ATR length and factor for Supertrend.
Donchian Channels: Option to set the length for the channel calculation.
🔶 RELATED SCRIPTS
Reversal-Candlestick-Structure.
Reversal-Signals.

Gann Swing Strategy [1 Bar - Multi Layer]Use this Strategy to Fine-tune inputs for your Gann swing strategy.
Strategy allows you to fine-tune the indicator for 1 TimeFrame at a time; cross Timeframe Input fine-tuning is done manually after exporting the chart data.
MEANINGFUL DESCRIPTION:
The Gann Swing Chart using the One-Bar type, also known as the Minor Trend Chart, is designed to follow single-bar movements in the market. It helps identify trends by tracking price movements. When the market makes a higher high than the previous bar from a low price, the One-Bar trend line moves up, indicating a new high and establishing the previous low as a One-Bar bottom. Conversely, when the market makes a lower low than the previous bar from a high price, the One-Bar swing line moves down, marking a new low and setting the previous high as a One-Bar top. The crossing of these swing tops and bottoms indicates a change in trend direction.
HOW TO USE THE INDICATOR / Gann-swing Strategy:
The indicator shows 1, 2, and 3-bar swings. The strategy triggers a buy when the price crosses the previously determined high.
HOW TO USE THE STRATEGY:
Strategy to Fine-Tune Inputs for Your Gann Swing Strategy
This strategy allows for the fine-tuning of indicators for one timeframe at a time. Cross-timeframe input fine-tuning is done manually after exporting the chart data.
Meaningful Description:
The Gann Swing Chart using the One-Bar type, also known as the Minor Trend Chart, is designed to follow single-bar movements in the market. It helps identify trends by tracking price movements. When the market makes a higher high than the previous bar from a low price, the One-Bar trend line moves up, indicating a new high and establishing the previous low as a One-Bar bottom. Conversely, when the market makes a lower low than the previous bar from a high price, the One-Bar swing line moves down, marking a new low and setting the previous high as a One-Bar top. The crossing of these swing tops and bottoms indicates a change in trend direction.
How to Use the Indicator / Gann-Swing Strategy:
The indicator shows 1, 2, and 3-bar swings. The strategy triggers a buy when the price crosses the previously determined high.
How to Use the Strategy:
The strategy initiates a buy if the price breaks 1, 2, or 3-bar highs, or any combination thereof. Use the inputs to determine which highs or lows need to be crossed for the strategy to go long or short.
ORIGINALITY & USEFULNESS:
The One-Bar Swing Chart stands out for its simplicity and effectiveness in capturing minor market trends. Developed by meomeo105, this Gann high and low algorithm forms the basis of the strategy. I used my approach to creating strategy out of Gann swing indicator.
DETAILED DESCRIPTION:
What is a Swing Chart?
Swing charts help traders visualize price movements and identify trends by focusing on price highs and lows. They are instrumental in spotting trend reversals and continuations.
What is the One-Bar Swing Chart?
The One-Bar Swing Chart, also known as the Minor Trend Chart, follows single-bar price movements. It plots upward swings from a low price when a higher high is made, and downward swings from a high price when a lower low is made.
Key Features:
Trend Identification : Highlights minor trends by plotting swing highs and lows based on one-bar movements.
Simple Interpretation : Crossing a swing top indicates an uptrend, while crossing a swing bottom signals a downtrend.
Customizable Periods : Users can adjust the period to fine-tune the sensitivity of the swing chart to market movements.
Practical Application:
Bullish Trend : When the One-Bar Swing line moves above a previous swing top, it indicates a bullish trend.
Bearish Trend : When the One-Bar Swing line moves below a previous swing bottom, it signals a bearish trend.
Trend Reversal : Watch for crossings of swing tops and bottoms to detect potential trend reversals.
The One-Bar Swing Chart is a powerful tool for traders looking to capture and understand market trends. By following the simple rules of swing highs and lows, it provides clear and actionable insights into market direction.
Why the Strategy Uses 100% Allocation of a Portfolio:
This strategy allocates 100% of the portfolio to trading this specific pair, which does not mean 100% of all capital but 100% of the allocated trading capital for this pair. The strategy is swing-based and does not use take profit (TP) or stop losses.

Outside Bar ProbabilityOutside Bar Percentage by Hour Indicator
Description:
The "Outside Bar Percentage by Hour" indicator is a powerful tool designed to analyze the occurrence of outside bars within each hour of the trading day. This indicator not only tracks the frequency of these key market events but also provides a detailed breakdown of their distribution, allowing traders to identify potential patterns and key trading hours.
What It Does:
Outside Bar Detection: The indicator identifies "outside bars," which occur when the high of a bar is higher than the previous bar's high, and the low is lower than the previous bar's low. These bars often signal significant market moves and potential reversals.
Hourly Analysis: The script tracks the total number of bars and outside bars for each hour (0 to 23) of the trading day. This granular analysis helps traders pinpoint specific hours when outside bars are more likely to occur.
Percentage Calculation: It calculates the percentage chance of an outside bar occurring for each hour, based on the total bars observed. This percentage provides a clear view of the likelihood of encountering an outside bar within a given hour, which can be critical for timing entries and exits.
Visual Representation: The data is displayed in a table format directly on the chart, showing:
Hour: The specific hour of the day.
Total Bars: The total number of bars observed during each hour.
Outside Bar Count: The number of outside bars detected in that hour.
Percentage: The calculated percentage chance of an outside bar occurring in each hour.
How It Works:
The indicator uses a loop to analyze each bar in real-time, checking if it qualifies as an outside bar. It then records the occurrence in arrays that track data for each hour.
At the start of each new day, the counts are reset to ensure the data remains relevant and accurate.
The percentage chance of an outside bar occurring is computed using the formula: (Outside Bar Count / Total Bar Count) * 100.
The results are neatly organized in a table that updates dynamically, providing traders with real-time insights.
How to Use It:
Identify Key Trading Hours: Use the table to observe the distribution of outside bars across different hours. This can help you identify when significant market moves are more likely to occur.
Time Your Entries and Exits: Understanding the likelihood of outside bars can assist in timing your trades, particularly if you use strategies that rely on volatility or market reversals.
Market Analysis: The percentage data can provide insights into the market's behavior during specific times, helping you refine your trading strategy based on historical patterns.
Concepts Underlying the Calculations:
The script leverages the concept of "outside bars," which are often considered indicators of potential reversals or significant market movements. By analyzing these bars across different hours, the indicator provides a temporal dimension to market analysis, helping traders understand when these pivotal events are most likely to occur.
The detailed hourly breakdown and percentage calculations offer a nuanced view of market activity, making it a valuable tool for traders looking to enhance their timing and strategic decision-making.
This indicator is suitable for all types of traders, including those focused on day trading, swing trading, or even longer-term analysis. It provides a unique perspective on market activity that can complement other technical indicators and analyses.

CandlesGroup_TypesLibrary "CandlesGroup_Types"
CandlesGroup Type allows you to efficiently store and access properties of all the candles in your chart.
You can easily manipulate large datasets, work with multiple timeframes, or analyze multiple symbols simultaneously. By encapsulating the properties of each candle within a CandlesGroup object, you gain a convenient and organized way to handle complex candlestick patterns and data.
For usage instructions and detailed examples, please refer to the comments and examples provided in the source code.
method init(_self)
Namespace types: CandlesGroup
Parameters:
_self (CandlesGroup)
method init(_self, propertyNames)
Namespace types: CandlesGroup
Parameters:
_self (CandlesGroup)
propertyNames (string )
method get(_self, key)
get values array from a given property name
Namespace types: CandlesGroup
Parameters:
_self (CandlesGroup) : : CandlesGroup object
key (string) : : key name of selected property. Default is "index"
Returns: values array
method size(_self)
get size of values array. By default it equals to current bar_index
Namespace types: CandlesGroup
Parameters:
_self (CandlesGroup) : : CandlesGroup object
Returns: size of values array
method push(_self, key, value)
push single value to specific property
Namespace types: CandlesGroup
Parameters:
_self (CandlesGroup) : : CandlesGroup object
key (string) : : key name of selected property
value (float) : : property value
Returns: CandlesGroup object
method push(_self, arr)
Namespace types: CandlesGroup
Parameters:
_self (CandlesGroup)
arr (float )
method populate(_self, ohlc)
populate ohlc to CandlesGroup
Namespace types: CandlesGroup
Parameters:
_self (CandlesGroup) : : CandlesGroup object
ohlc (float ) : : array of ohlc
Returns: CandlesGroup object
method populate(_self, values, propertiesNames)
populate values base on given properties Names
Namespace types: CandlesGroup
Parameters:
_self (CandlesGroup) : : CandlesGroup object
values (float ) : : array of property values
propertiesNames (string ) : : an array stores property names. Use as keys to get values
Returns: CandlesGroup object
method populate(_self)
populate values (default setup)
Namespace types: CandlesGroup
Parameters:
_self (CandlesGroup) : : CandlesGroup object
Returns: CandlesGroup object
method lookback(arr, bars_lookback)
get property value on previous candles. For current candle, use *.lookback()
Namespace types: float
Parameters:
arr (float ) : : array of selected property values
bars_lookback (int) : : number of candles lookback. 0 = current candle. Default is 0
Returns: single property value
method highest_within_bars(_self, hiSource, start, end, useIndex)
get the highest property value between specific candles
Namespace types: CandlesGroup
Parameters:
_self (CandlesGroup) : : CandlesGroup object
hiSource (string) : : key name of selected property
start (int) : : start bar for calculation. Default is candles lookback value from current candle. 'index' value is used if 'useIndex' = true
end (int) : : end bar for calculation. Default is candles lookback value from current candle. 'index' value is used if 'useIndex' = true. Default is 0
useIndex (bool) : : use index instead of lookback value. Default = false
Returns: the highest value within candles
method highest_within_bars(_self, returnWithIndex, hiSource, start, end, useIndex)
get the highest property value and bar index between specific candles
Namespace types: CandlesGroup
Parameters:
_self (CandlesGroup) : : CandlesGroup object
returnWithIndex (bool) : : the function only applicable when it is true
hiSource (string) : : key name of selected property
start (int) : : start bar for calculation. Default is candles lookback value from current candle. 'index' value is used if 'useIndex' = true
end (int) : : end bar for calculation. Default is candles lookback value from current candle. 'index' value is used if 'useIndex' = true. Default is 0
useIndex (bool) : : use index instead of lookback value. Default = false
Returns:
method highest_point_within_bars(_self, hiSource, start, end, useIndex)
get a Point object which contains highest property value between specific candles
Namespace types: CandlesGroup
Parameters:
_self (CandlesGroup) : : CandlesGroup object
hiSource (string) : : key name of selected property
start (int) : : start bar for calculation. Default is candles lookback value from current candle. 'index' value is used if 'useIndex' = true
end (int) : : end bar for calculation. Default is candles lookback value from current candle. 'index' value is used if 'useIndex' = true. Default is 0
useIndex (bool) : : use index instead of lookback value. Default = false
Returns: Point object contains highest property value
method lowest_within_bars(_self, loSource, start, end, useIndex)
get the lowest property value between specific candles
Namespace types: CandlesGroup
Parameters:
_self (CandlesGroup) : : CandlesGroup object
loSource (string) : : key name of selected property
start (int) : : start bar for calculation. Default is candles lookback value from current candle. 'index' value is used if 'useIndex' = true
end (int) : : end bar for calculation. Default is candles lookback value from current candle. 'index' value is used if 'useIndex' = true. Default is 0
useIndex (bool) : : use index instead of lookback value. Default = false
Returns: the lowest value within candles
method lowest_within_bars(_self, returnWithIndex, loSource, start, end, useIndex)
get the lowest property value and bar index between specific candles
Namespace types: CandlesGroup
Parameters:
_self (CandlesGroup) : : CandlesGroup object
returnWithIndex (bool) : : the function only applicable when it is true
loSource (string) : : key name of selected property
start (int) : : start bar for calculation. Default is candles lookback value from current candle. 'index' value is used if 'useIndex' = true
end (int) : : end bar for calculation. Default is candles lookback value from current candle. 'index' value is used if 'useIndex' = true. Default is 0
useIndex (bool) : : use index instead of lookback value. Default = false
Returns:
method lowest_point_within_bars(_self, loSource, start, end, useIndex)
get a Point object which contains lowest property value between specific candles
Namespace types: CandlesGroup
Parameters:
_self (CandlesGroup) : : CandlesGroup object
loSource (string) : : key name of selected property
start (int) : : start bar for calculation. Default is candles lookback value from current candle. 'index' value is used if 'useIndex' = true
end (int) : : end bar for calculation. Default is candles lookback value from current candle. 'index' value is used if 'useIndex' = true. Default is 0
useIndex (bool) : : use index instead of lookback value. Default = false
Returns: Point object contains lowest property value
method time2bar(_self, t)
Convert UNIX time to bar index of active chart
Namespace types: CandlesGroup
Parameters:
_self (CandlesGroup) : : CandlesGroup object
t (int) : : UNIX time
Returns: bar index
method time2bar(_self, timezone, YYYY, MMM, DD, hh, mm, ss)
Convert timestamp to bar index of active chart. User defined timezone required
Namespace types: CandlesGroup
Parameters:
_self (CandlesGroup) : : CandlesGroup object
timezone (string) : : User defined timezone
YYYY (int) : : Year
MMM (int) : : Month
DD (int) : : Day
hh (int) : : Hour. Default is 0
mm (int) : : Minute. Default is 0
ss (int) : : Second. Default is 0
Returns: bar index
method time2bar(_self, YYYY, MMM, DD, hh, mm, ss)
Convert timestamp to bar index of active chart
Namespace types: CandlesGroup
Parameters:
_self (CandlesGroup) : : CandlesGroup object
YYYY (int) : : Year
MMM (int) : : Month
DD (int) : : Day
hh (int) : : Hour. Default is 0
mm (int) : : Minute. Default is 0
ss (int) : : Second. Default is 0
Returns: bar index
method get_prop_from_time(_self, key, t)
get single property value from UNIX time
Namespace types: CandlesGroup
Parameters:
_self (CandlesGroup) : : CandlesGroup object
key (string) : : key name of selected property
t (int) : : UNIX time
Returns: single property value
method get_prop_from_time(_self, key, timezone, YYYY, MMM, DD, hh, mm, ss)
get single property value from timestamp. User defined timezone required
Namespace types: CandlesGroup
Parameters:
_self (CandlesGroup) : : CandlesGroup object
key (string) : : key name of selected property
timezone (string) : : User defined timezone
YYYY (int) : : Year
MMM (int) : : Month
DD (int) : : Day
hh (int) : : Hour. Default is 0
mm (int) : : Minute. Default is 0
ss (int) : : Second. Default is 0
Returns: single property value
method get_prop_from_time(_self, key, YYYY, MMM, DD, hh, mm, ss)
get single property value from timestamp
Namespace types: CandlesGroup
Parameters:
_self (CandlesGroup) : : CandlesGroup object
key (string) : : key name of selected property
YYYY (int) : : Year
MMM (int) : : Month
DD (int) : : Day
hh (int) : : Hour. Default is 0
mm (int) : : Minute. Default is 0
ss (int) : : Second. Default is 0
Returns: single property value
method bar2time(_self, index)
Convert bar index of active chart to UNIX time
Namespace types: CandlesGroup
Parameters:
_self (CandlesGroup) : : CandlesGroup object
index (int) : : bar index
Returns: UNIX time
Point
A point on chart
Fields:
price (series float) : : price value
bar (series int) : : bar index
bartime (series int) : : time in UNIX format of bar
Property
Property object which contains values of all candles
Fields:
name (series string) : : name of property
values (float ) : : an array stores values of all candles. Size of array = bar_index
CandlesGroup
Candles Group object which contains properties of all candles
Fields:
propertyNames (string ) : : an array stores property names. Use as keys to get values
properties (Property ) : : array of Property objects
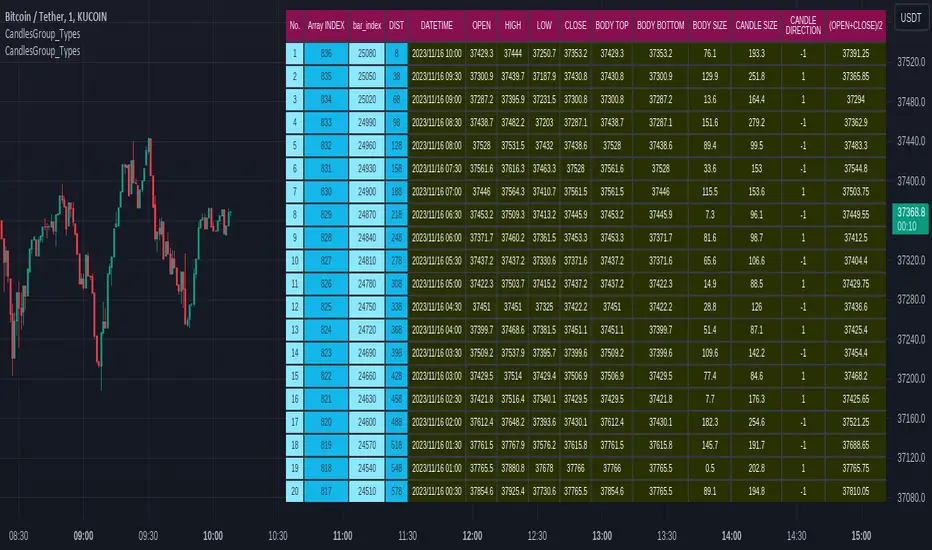
VisibleChart█ OVERVIEW
This library is a Pine programmer’s tool containing functions that return values calculated from the range of visible bars on the chart.
This is now possible in Pine Script™ thanks to the recently-released chart.left_visible_bar_time and chart.right_visible_bar_time built-ins, which return the opening time of the leftmost and rightmost bars on the chart. These values update as traders scroll or zoom their charts, which gives way to a class of indicators that can dynamically recalculate and draw visuals on visible bars only, as users scroll or zoom their charts. We hope this library's functions help you make the most of the world of possibilities these new built-ins provide for Pine scripts.
For an example of a script using this library, have a look at the Chart VWAP indicator.
█ CONCEPTS
Chart properties
The new chart.left_visible_bar_time and chart.right_visible_bar_time variables return the opening time of the leftmost and rightmost bars on the chart. They are only two of many new built-ins in the `chart.*` namespace. See this blog post for more information, or look them up by typing "chart." in the Pine Script™ Reference Manual .
Dynamic recalculation of scripts on visible bars
Any script using chart.left_visible_bar_time or chart.right_visible_bar_time acquires a unique property, which triggers its recalculation when traders scroll or zoom their charts in such a way that the range of visible bars on the chart changes. This library's functions use the two recent built-ins to derive various values from the range of visible bars.
Designing your scripts for dynamic recalculation
For the library's functions to work correctly, they must be called on every bar. For reliable results, assign their results to global variables and then use the variables locally where needed — not the raw function calls.
Some functions like `barIsVisible()` or `open()` will return a value starting on the leftmost visible bar. Others such as `high()` or `low()` will also return a value starting on the leftmost visible bar, but their correct value can only be known on the rightmost visible bar, after all visible bars have been analyzed by the script.
You can plot values as the script executes on visible bars, but efficient code will, when possible, create resource-intensive labels, lines or tables only once in the global scope using var , and then use the setter functions to modify their properties on the last bar only. The example code included in this library uses this method.
Keep in mind that when your script uses chart.left_visible_bar_time or chart.right_visible_bar_time , your script will recalculate on all bars each time the user scrolls or zooms their chart. To provide script users with the best experience you should strive to keep calculations to a minimum and use efficient code so that traders are not always waiting for your script to recalculate every time they scroll or zoom their chart.
Another aspect to consider is the fact that the rightmost visible bar will not always be the last bar in the dataset. When script users scroll back in time, a large portion of the time series the script calculates on may be situated after the rightmost visible bar. We can never assume the rightmost visible bar is also the last bar of the time series. Use `barIsVisible()` to restrict calculations to visible bars, but also consider that your script can continue to execute past them.
Look first. Then leap.
█ FUNCTIONS
The library contains the following functions:
barIsVisible()
Condition to determine if a given bar is within the users visible time range.
Returns: (bool) True if the the calling bar is between the `chart.left_visible_bar_time` and the `chart.right_visible_bar_time`.
high()
Determines the value of the highest `high` in visible bars.
Returns: (float) The maximum high value of visible chart bars.
highBarIndex()
Determines the `bar_index` of the highest `high` in visible bars.
Returns: (int) The `bar_index` of the `high()`.
highBarTime()
Determines the bar time of the highest `high` in visible bars.
Returns: (int) The `time` of the `high()`.
low()
Determines the value of the lowest `low` in visible bars.
Returns: (float) The minimum low value of visible chart bars.
lowBarIndex()
Determines the `bar_index` of the lowest `low` in visible bars.
Returns: (int) The `bar_index` of the `low()`.
lowBarTime()
Determines the bar time of the lowest `low` in visible bars.
Returns: (int) The `time` of the `low()`.
open()
Determines the value of the opening price in the visible chart time range.
Returns: (float) The `open` of the leftmost visible chart bar.
close()
Determines the value of the closing price in the visible chart time range.
Returns: (float) The `close` of the rightmost visible chart bar.
leftBarIndex()
Determines the `bar_index` of the leftmost visible chart bar.
Returns: (int) A `bar_index`.
rightBarIndex()
Determines the `bar_index` of the rightmost visible chart bar.
Returns: (int) A `bar_index`
bars()
Determines the number of visible chart bars.
Returns: (int) The number of bars.
volume()
Determines the sum of volume of all visible chart bars.
Returns: (float) The cumulative sum of volume.
ohlcv()
Determines the open, high, low, close, and volume sum of the visible bar time range.
Returns: ( ) A tuple of the OHLCV values for the visible chart bars. Example: open is chart left, high is the highest visible high, etc.
chartYPct(pct)
Determines a price level as a percentage of the visible bar price range, which depends on the chart's top/bottom margins in "Settings/Appearance".
Parameters:
pct : (series float) Percentage of the visible price range (50 is 50%). Negative values are allowed.
Returns: (float) A price level equal to the `pct` of the price range between the high and low of visible chart bars. Example: 50 is halfway between the visible high and low.
chartXTimePct(pct)
Determines a time as a percentage of the visible bar time range.
Parameters:
pct : (series float) Percentage of the visible time range (50 is 50%). Negative values are allowed.
Returns: (float) A time in UNIX format equal to the `pct` of the time range from the `chart.left_visible_bar_time` to the `chart.right_visible_bar_time`. Example: 50 is halfway from the leftmost visible bar to the rightmost.
chartXIndexPct(pct)
Determines a `bar_index` as a percentage of the visible bar time range.
Parameters:
pct : (series float) Percentage of the visible time range (50 is 50%). Negative values are allowed.
Returns: (float) A time in UNIX format equal to the `pct` of the time range from the `chart.left_visible_bar_time` to the `chart.right_visible_bar_time`. Example: 50 is halfway from the leftmost visible bar to the rightmost.
whenVisible(src, whenCond, length)
Creates an array containing the `length` last `src` values where `whenCond` is true for visible chart bars.
Parameters:
src : (series int/float) The source of the values to be included.
whenCond : (series bool) The condition determining which values are included. Optional. The default is `true`.
length : (simple int) The number of last values to return. Optional. The default is all values.
Returns: (float ) The array ID of the accumulated `src` values.
avg(src)
Gathers values of the source over visible chart bars and averages them.
Parameters:
src : (series int/float) The source of the values to be averaged. Optional. Default is `close`.
Returns: (float) A cumulative average of values for the visible time range.
median(src)
Calculates the median of a source over visible chart bars.
Parameters:
src : (series int/float) The source of the values. Optional. Default is `close`.
Returns: (float) The median of the `src` for the visible time range.
vVwap(src)
Calculates a volume-weighted average for visible chart bars.
Parameters:
src : (series int/float) Source used for the VWAP calculation. Optional. Default is `hlc3`.
Returns: (float) The VWAP for the visible time range.
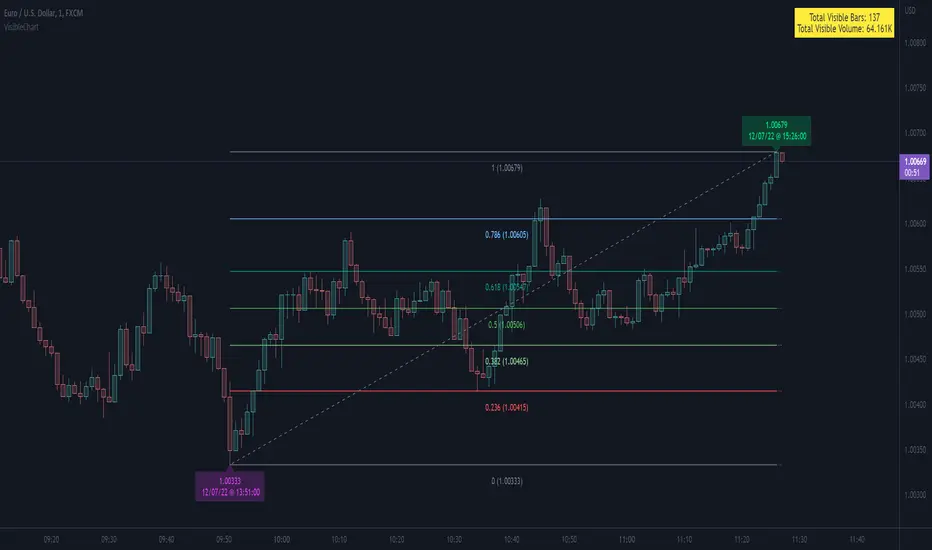
Multi-Symbol Inside Bar Detector (4-Symbol Compression)Multi-Symbol Inside Bar Detector (4-Symbol Compression)
Overview
Detects simultaneous inside bars across 4 symbols in real-time — a signal of market-wide compression that may precede directional moves. When all 4 symbols are "inside" (trading within the prior bar's range), the market is consolidating.
Monitor SPY, QQQ, DIA, IWM (or any 4 symbols you choose) on a single timeframe. No more chart hopping. Designed for Rob Smith's "The Strat" methodology and price action traders who trade compression setups.
🎯 Why This Matters
Inside bars indicate compression and consolidation.
When all 4 major ETFs simultaneously compress into inside bars:
Market is consolidating within a range
Volatility is contracting (not expanding)
A directional move may follow (direction unknown)
This is NOT a directional signal — it's a consolidation detector. You determine direction based on your analysis. This indicator identifies WHEN compression exists across multiple symbols.
✅ Key Features
✅ 4-Symbol Monitoring — Track 4 symbols simultaneously on one timeframe
✅ Visual Alerts — Bar coloring + optional "4-Inside" labels
✅ TradingView Alerts — Get notified when all 4 go inside simultaneously
✅ Live vs Confirmed Mode — Toggle between real-time (repaints) or bar-close confirmation (no repaint)
✅ Customizable — Any 4 symbols, any timeframe, custom colors
✅ Debug Table — See which symbols are inside (troubleshooting)
📊 How It Works
Inside Bar Definition (Rob Smith Standards)
An inside bar forms when:
High < Prior High AND
Low > Prior Low
Current bar trades entirely within prior bar's range.
Technical Implementation
pinescriptisInside(h, l, ph, pl) =>
na(h) or na(l) or na(ph) or na(pl) ? false : (h < ph and l > pl)
NA-safe: Handles missing data gracefully
Strict comparison: Uses < and > (not <= or >=)
Rob Smith compliant: Tick-perfect inside bar detection per Strat methodology
4-Symbol Requirement
Signal fires when ALL 4 symbols are inside bars simultaneously. If only 3 are inside → no signal. All 4 must compress together.
⚙️ Settings Guide
Symbols
Default: SPY, QQQ, DIA, IWM (broad market coverage)
Customize: Click to change to ANY 4 symbols
Popular Combinations:
Futures: ES, NQ, YM, RTY
Sectors: XLF, XLK, XLE, XLV
Mega Caps: AAPL, MSFT, GOOGL, AMZN
Timeframe
Default: 60 (1-hour bars)
What it does: Applies SAME timeframe to all 4 symbols
Examples: 5 (5min), 15 (15min), D (Daily)
Live Intrabar Mode
ON (default): Shows forming bars in real-time (repaints until close)
OFF: Waits for bar close (no repaint, confirmed only)
Use ON for: Live monitoring, intraday setups
Use OFF for: Alerts, backtesting, confirmed signals
Display Options
Show Labels: Toggle "4-Inside" labels on/off
Inside Bar Color: Default yellow (customize)
Show Debug Table: See per-symbol status (for troubleshooting)
🔔 Setting Up Alerts
Right-click chart → "Add Alert"
Condition: Select this indicator
Frequency: "Once Per Bar Close" (recommended for confirmed mode)
Alert fires when all 4 symbols go inside simultaneously (edge detection, not every bar)
💡 Example Trading Approaches
Note: These are educational examples, not trading advice. Past compression patterns do not guarantee future directional moves.
Approach 1: Higher TF Compression → Lower TF Trigger
1H chart: 4-symbol inside bar forms (compression)
15m chart: Monitor for directional break
Await confirmation with your analysis before entry
Approach 2: Daily Compression → Intraday Entries
Daily chart: All 4 compress (consolidation)
1H chart: Monitor for range expansion
Use your directional bias to determine position
Approach 3: Sector Analysis
Use sector ETFs (XLF, XLK, XLE, XLV)
When all 4 compress → observe which breaks first
Analyze sector strength/weakness patterns
🎯 Why 4 Symbols?
Market coverage: When SPY, QQQ, DIA, and IWM all compress together, it indicates broad market consolidation across multiple market-cap segments.
SPY: S&P 500 (large caps)
QQQ: Nasdaq 100 (tech)
DIA: Dow 30 (blue chips)
IWM: Russell 2000 (small caps)
Using 4 major indices helps filter noise from single-symbol compression.
⚡ Quick Start
Add indicator to chart
Choose symbols (default: SPY/QQQ/DIA/IWM)
Set timeframe (default: 60min)
Toggle live mode (ON for real-time, OFF for confirmed)
Create alert (optional)
Yellow bars = all 4 inside
Use with your directional analysis
🔒 Technical Details
Code Quality
✅ PineScript v6 (latest)
✅ NA-safe logic (handles missing data)
✅ Rob Smith Strat standards (strict tick tolerance)
✅ No repainting (in confirmed mode)
✅ Efficient performance (max_bars_back=2)
✅ Open-source (educational transparency)
Repainting Behavior
Live Mode (ON): Repaints until bar closes (shows forming bars)
Confirmed Mode (OFF): No repaint, waits for bar close
Alert recommendation: Use Confirmed Mode to avoid false alerts
📞 Support
Follow me on TradingView for updates and new indicators.
Questions? Leave a comment below. I respond to all feedback.
⚠️ Important Disclaimers
Not financial advice: This indicator is for educational purposes and market analysis
No performance guarantees: Past patterns do not predict future results
Directional bias required: Inside bars indicate consolidation, not direction
Risk management essential: Always use proper position sizing and stops
Test before trading: Backtest on historical data and paper trade first
💬 Final Thoughts
Compression often precedes expansion, but direction remains uncertain. When multiple major indices compress simultaneously, it indicates market-wide consolidation. This indicator helps identify those moments across 4 symbols — no more chart hopping, easier pattern recognition.
Use it as one component of your analysis, combine with your directional methodology, and always manage risk appropriately.
Happy trading! 📈
Free and open-source for personal use. If you find this valuable:
👍 Like | 📝 Review | 🔔 Follow

Volume Weighted Intra Bar Standard DeviationThis indicator provides a high-resolution analysis of market volatility by dissecting each bar on the chart into its fundamental components. It uses data from a lower, intra-bar timeframe to separate the total volatility of a single bar into its 'directional' and 'non-directional' parts.
Key Features:
Intra-Bar Volatility Decomposition: For each bar on the chart, the indicator analyzes the underlying price action on a smaller timeframe ('Intra-Bar Timeframe') and quantifies two types of volatility:
Between-Bar Volatility (Directional): Calculated from price movements between the intra-bar candles. This component represents the directional, trending price action within the main bar.
Within-Bar Volatility (Non-Directional): Calculated from price fluctuations inside each intra-bar candle. This component represents the choppy, noisy, or ranging price action.
Dual Display Modes: The indicator offers two modes to visualize this information:
Absolute Mode: Plots the total standard deviation as a stacked column chart, showing the absolute magnitude of volatility and the contribution of each component.
Normalized Mode: Plots the components as a 100% stacked column chart (scaled from 0 to 1), focusing purely on the percentage ratio of 'between-bar' (trending) and 'within-bar' (choppy) volatility.
Calculation Options:
Statistical Model: The 'Estimate Bar Statistics' option (enabled by default) uses a statistical model ('Estimator') to perform the decomposition. (Assumption: In this mode, the Source input is ignored, and an estimated mean for each bar is used instead).
Normalization: An optional 'Normalize Volatility' setting calculates volatility in percentage terms (log-space).
Volume Weighting: An option (Volume weighted) applies volume weighting to all intra-bar volatility calculations.
Volatility Pivot Detection: Includes a built-in pivot detector that identifies significant turning points (highs and lows) in the total volatility line. (Note: This is only visible in 'Absolute Mode').
Note on Confirmation (Lag): Pivot signals are confirmed using a lookback method. A pivot is only plotted after the Pivot Right Bars input has passed, which introduces an inherent lag.
Multi-Timeframe (MTF) Capability:
MTF Analysis Lines: The entire intra-bar analysis can be run on a higher timeframe (using the Timeframe input), with standard options to handle gaps (Fill Gaps) and prevent repainting (Wait for...).
Limitation: The Pivot detection (Calculate Pivots) is disabled if a Higher Timeframe (HTF) is selected.
Integrated Alerts: Includes 6 alerts for:
Volatility character changes (e.g., 'Character Change from Choppy to Trend').
Dominant character emerging (e.g., 'Trend Character Emerging').
Total Volatility pivot (High/Low) detection.
Caution: Real-Time Data Behavior (Intra-Bar Repainting) This indicator uses high-resolution intra-bar data. As a result, the values on the current, unclosed bar (the real-time bar) will update dynamically as new intra-bar data arrives. This behavior is normal and necessary for this type of analysis. Signals should only be considered final after the main chart bar has closed.
DISCLAIMER
For Informational/Educational Use Only: This indicator is provided for informational and educational purposes only. It does not constitute financial, investment, or trading advice, nor is it a recommendation to buy or sell any asset.
Use at Your Own Risk: All trading decisions you make based on the information or signals generated by this indicator are made solely at your own risk.
No Guarantee of Performance: Past performance is not an indicator of future results. The author makes no guarantee regarding the accuracy of the signals or future profitability.
No Liability: The author shall not be held liable for any financial losses or damages incurred directly or indirectly from the use of this indicator.
Signals Are Not Recommendations: The alerts and visual signals (e.g., crossovers) generated by this tool are not direct recommendations to buy or sell. They are technical observations for your own analysis and consideration.

Aggressive Predictor+ (Last Bar, Vol, Wick)# Aggressive Predictor+ Pine Script Indicator
**Version:** Based on the script incorporating Last Bar analysis, Volume Confirmation, and Wick Rejection.
## Overview
This TradingView Pine Script indicator aims to predict the likely directional bias of the **next** candle based on an aggressive analysis of the **last closed candle's** price action, volume, and wick characteristics relative to recent market volatility (ATR).
It is designed to be **highly reactive** to the most recent bar's information. The prediction is visualized directly on the chart through shapes, a projected line, a text label, and an information table.
**Please Note:** Predicting the next candle is inherently speculative. This indicator provides a probability assessment based on its specific logic and should be used as a supplementary tool within a broader trading strategy, not as a standalone signal. Its performance heavily depends on market conditions and the chosen settings.
## Core Logic Explained
The indicator follows these steps for each new bar, looking back at the **last closed bar** (` `):
1. **Calculate Recent Volatility:** Determines the Average True Range (ATR) over the specified `ATR Lookback Period` (`atr_len`). This provides context for how volatile the market has been recently.
2. **Analyze Last Bar's Body:** Calculates the price change from open to close (`close - open `) of the last completed bar.
3. **Compare Body to Volatility:** Compares the absolute size of the last bar's body to the calculated ATR (`prev_atr`) multiplied by a sensitivity threshold (`threshold_atr_mult`).
* If the body size (positive) exceeds the threshold, the initial prediction is "Upward".
* If the body size (negative) exceeds the negative threshold, the initial prediction is "Downward".
* Otherwise, the initial prediction is "Neutral".
4. **Check Volume Confirmation:** Compares the volume of the last bar (`volume `) to its recent average volume (`ta.sma(volume, vol_avg_len) `). If the volume is significantly higher (based on `vol_confirm_mult`), it adds context ("High Vol") to directional predictions.
5. **Check for Wick Rejection:** Analyzes the wicks of the last bar.
* If the initial prediction was "Upward" but there was a large upper wick (relative to the body size, defined by `wick_rejection_mult`), it indicates potential selling pressure rejecting higher prices. The prediction is **overridden to "Neutral"**.
* If the initial prediction was "Downward" but there was a large lower wick, it indicates potential buying pressure supporting lower prices. The prediction is **overridden to "Neutral"**.
6. **Determine Final Prediction:** The final state ("Upward", "Downward", or "Neutral") is determined after considering potential wick rejection overrides. Context about volume or wick rejection is added to the display text.
## Visual Elements
* **Prediction Shapes:**
* Green Up Triangle: Below the bar for an "Upward" prediction (without wick rejection).
* Red Down Triangle: Above the bar for a "Downward" prediction (without wick rejection).
* Gray Diamond: Above/Below the bar if a directional move was predicted but then neutralized due to Wick Rejection.
* **Prediction Line:**
* Extends forward from the current bar's close for `line_length` bars (Default: 20).
* Color indicates the final predicted state (Green: Upward, Red: Downward, Gray: Neutral).
* Style is solid for directional predictions, dotted for Neutral.
* The *slope/magnitude* of the line is based on recent volatility (ATR) and the `projection_mult` setting, representing a *potential* magnitude if the predicted direction holds, scaled by recent volatility. **This is purely a visual projection, not a precise price forecast.**
* **Prediction Label:**
* Appears at the end of the Prediction Line.
* Displays the final prediction state (e.g., "Upward (High Vol)", "Neutral (Wick Rej)").
* Shows the raw price change of the last bar's body and its size relative to ATR (e.g., "Last Body: 1.50 (120.5% ATR)").
* Tooltip provides more detailed calculation info.
* **Info Table:**
* Displays the prediction state, color-coded.
* Shows details about the last bar's body size relative to ATR.
* Dynamically positioned near the latest bar (offsets configurable).
## Configuration Settings (Inputs)
These settings allow you to customize the indicator's behavior and appearance. Access them by clicking the "Settings" gear icon on the indicator name on your chart.
### Price Action & ATR
* **`ATR Lookback Period` (`atr_len`):**
* *Default:* 14
* *Purpose:* Number of bars used to calculate the Average True Range (ATR), which measures recent volatility.
* **`Body Threshold (ATR Multiplier)` (`threshold_atr_mult`):**
* *Default:* 0.5
* *Purpose:* Key setting for **aggression**. The last bar's body size (`close - open`) must be greater than `ATR * this_multiplier` to be initially classified as "Upward" or "Downward".
* *Effect:* **Lower values** make the indicator **more aggressive** (easier to predict direction). Higher values require a stronger price move relative to volatility and result in more "Neutral" predictions.
### Volume Confirmation
* **`Volume Avg Lookback` (`vol_avg_len`):**
* *Default:* 20
* *Purpose:* Number of bars used to calculate the simple moving average of volume.
* **`Volume Confirmation Multiplier` (`vol_confirm_mult`):**
* *Default:* 1.5
* *Purpose:* Volume on the last bar is considered "High" if it's greater than `Average Volume * this_multiplier`.
* *Effect:* Primarily adds context "(High Vol)" or "(Low Vol)" to the display text for directional predictions. Doesn't change the core prediction state itself.
### Wick Rejection
* **`Wick Rejection Multiplier` (`wick_rejection_mult`):**
* *Default:* 1.0
* *Purpose:* If an opposing wick (upper wick on an up-candle, lower wick on a down-candle) is larger than `body size * this_multiplier`, the directional prediction is overridden to "Neutral".
* *Effect:* Higher values require a much larger opposing wick to cause a rejection override. Lower values make wick rejection more likely.
### Projection Settings
* **`Projection Multiplier (ATR based)` (`projection_mult`):**
* *Default:* 1.0
* *Purpose:* Scales the projected *magnitude* of the prediction line. The projected price change shown by the line is `+/- ATR * this_multiplier`.
* *Effect:* Adjusts how far up or down the prediction line visually slopes. Does not affect the predicted direction.
* **`Prediction Line Length (Bars)` (`line_length`):**
* *Default:* 20
* *Purpose:* Controls how many bars forward the **visual** prediction line extends.
* *Effect:* Purely visual length adjustment.
### Visuals
* **`Upward Color` (`bullish_color`):** Color for Upward predictions.
* **`Downward Color` (`bearish_color`):** Color for Downward predictions.
* **`Neutral Color` (`neutral_color`):** Color for Neutral predictions (including Wick Rejections).
* **`Show Prediction Shapes` (`show_shapes`):** Toggle visibility of the triangles/diamonds on the chart.
* **`Show Prediction Line` (`show_line`):** Toggle visibility of the projected line.
* **`Show Prediction Label` (`show_label`):** Toggle visibility of the text label at the end of the line.
* **`Show Info Table` (`show_table`):** Toggle visibility of the information table.
### Table Positioning
* **`Table X Offset (Bars)` (`table_x_offset`):**
* *Default:* 3
* *Purpose:* How many bars to the right of the current bar the info table should appear.
* **`Table Y Offset (ATR Multiplier)` (`table_y_offset_atr`):**
* *Default:* 0.5
* *Purpose:* How far above the high of the last bar the info table should appear, measured in multiples of ATR.
## How to Use
1. Open the Pine Editor in TradingView.
2. Paste the complete script code.
3. Click "Add to Chart".
4. Adjust the input settings (especially `threshold_atr_mult`) to tune the indicator's aggressiveness and visual preferences.
5. Observe the prediction elements alongside your other analysis methods.
## Disclaimer
**This indicator is for informational and educational purposes only. It does not constitute financial advice or a recommendation to buy or sell any asset.** Trading financial markets involves significant risk, and you could lose money. Predictions about future price movements are inherently uncertain. The performance of this indicator depends heavily on market conditions and the settings used. Always perform your own due diligence and consider multiple factors before making any trading decisions. Use this indicator at your own risk.

EMA with Bar Count
---
### **Key Features and Functionalities**
#### 1. **Multi-Timeframe Exponential Moving Averages (EMA)**
- The script calculates and plots EMAs for various timeframes (e.g., 1 minute, 5 minutes, 60 minutes, daily, and custom intervals).
- Users can customize the length and resolution of each EMA using inputs.
- Different colors are assigned to each EMA for easy identification on the chart.
#### 2. **Background Coloring**
- Optional background coloring (`bgcolor`) indicates whether the current price is above or below the 1-hour 20 EMA.
- Green indicates the price is above, and red indicates the price is below the EMA.
#### 3. **Bar Count Labeling**
- The script tracks bar counts and displays labels at specific intervals (e.g., every 3 bars).
- Label size and text color can be customized through user inputs.
#### 4. **Inside and Outside Bar Detection**
- Detects and highlights "Inside Bars" and "Outside Bars" on the chart.
- **Inside Bar**: The current bar's high and low are within the previous bar's range.
- **Outside Bar**: The current bar's range exceeds the previous bar's range.
- These patterns are marked with shapes for visual identification.
#### 5. **Bullish/Bearish Candle Streaks**
- Identifies and marks streaks of three consecutive bullish or bearish candles.
- **Bullish Streaks**: Marked with green shapes above the bar.
- **Bearish Streaks**: Marked with red shapes above the bar.
#### 6. **Time-Based Marking**
- The script includes an option to highlight specific time intervals (e.g., 7:30 AM) with a colored vertical line or background shading.
- Configurable time inputs allow flexibility.
#### 7. **Micro Gap Detection**
- Highlights gaps between the opening price of the current bar and the closing price of the previous bar.
- Blue shapes indicate bullish gaps.
- Purple shapes indicate bearish gaps.
#### 8. **TR (Trading Range) Detection**
- Identifies bars with significant overlap based on a user-defined threshold.
- Displays "TR" labels when overlap conditions are met.
#### 9. **Bar Coloring**
- Optionally colors bars based on specific conditions:
- Green: Bullish breakout (high and low higher than the previous bar, closing above the midpoint).
- Red: Bearish breakout (high and low lower than the previous bar, closing below the midpoint).
#### 10. **50% Midpoint Line**
- Displays a horizontal line at the 50% midpoint of the bar's range, customizable for the current or last bar only.
#### 11. **Pattern Detection**
- Recognizes specific candlestick patterns (e.g., IOI, OII, IOO).
- Provides alerts for detected patterns or predefined thresholds.
#### 12. **Alerts**
- Configurable alerts for:
- Specific patterns (e.g., IOI, OII, IOO).
- Bar range exceeding a user-defined threshold.
- Bullish or bearish streaks.
#### 13. **Gap Detector**
- Identifies gaps between bars and marks them with shaded boxes.
- Bullish gaps are shaded green, while bearish gaps are shaded red.
#### 14. **Advanced Customization**
- Extensive user inputs allow traders to tailor the indicator to their trading style.
- Includes support for various levels of detail (e.g., debug mode, label visibility, etc.).
#### 15. **ZigZag and Wedge Patterns**
- Optional zigzag lines to connect swing highs and lows.
- Detects wedge patterns using customizable settings for pivot points and angle differences.
---
### **Use Case Scenarios**
1. **Trend Identification**: Use multi-timeframe EMAs to confirm overall market direction.
2. **Range Trading**: Trade within ranges using detected inside and outside bars as key levels.
3. **Breakout Trading**: Use patterns like IOI and OII to anticipate breakouts.
4. **Scalping**: Exploit bullish and bearish streaks or micro gaps for quick trades.
5. **Pattern-Based Alerts**: Set up alerts for specific market conditions or candlestick patterns.
### **Why This Indicator Is Useful**
- Combines multiple trading tools into a single, customizable script.
- Saves time by automating complex calculations and pattern detections.
- Improves decision-making with clear visual cues and configurable alerts.
Let me know if you'd like any additional explanations or adjustments!

Inside/Outside Bar Direction Highlighter
Here’s a trading indicator in Pine Script (v6) that combines the essence of the Inside Bar, Outside Bar, and directional patterns inspired by TT3 Theory. This indicator highlights bars based on their classification as inside, outside, or directional and provides potential trade signals.
Inside Outside Indicator
Explanation:
Bar Classification:
Inside Bar: Current high is less than the previous high, and the low is greater than the previous low.
Outside Bar: Current high exceeds the previous high, and the low breaks below the previous low.
Up/Down Bars: Closing prices relative to the previous high/low.
Visual Highlights:
Bars are visually highlighted with colors for easy identification.
Trade Signals:
Long Signal: When the close crosses above the previous high and it's a directional up bar.
Short Signal: When the close crosses below the previous low and it's a directional down bar.
Customizable Inputs:
Colors for inside, outside, up, and down bars can be modified.
You can copy and paste this script into the Pine Editor on TradingView to see it in action. Adjust the logic to fit your trading strategy as needed.
You said:
summary of how to use this indicator without buy/sell signal
ChatGPT said:
ChatGPT
How to Use the Inside/Outside Bar Direction Highlighter Indicator (Without Buy/Sell Signals)
Understand the Bar Classifications:
Inside Bars: Highlighted in blue (default). These indicate periods of market consolidation. Look for potential breakouts in either direction.
Outside Bars: Highlighted in orange (default). These represent increased volatility, where both higher highs and lower lows are made. Watch for reversals or continuations based on broader trends.
Directional Up Bars: Highlighted in green (default). These occur when the current close is above the previous high, signaling bullish momentum.
Directional Down Bars: Highlighted in red (default). These occur when the current close is below the previous low, indicating bearish momentum.
Identify Key Patterns:
Use the highlighted bars to spot price action setups, such as:
Breakouts from inside bars.
Reversal signals following outside bars.
Continuation patterns when directional bars align with the trend.
Combine with Your Analysis:
Trend Analysis: Match bar classifications with trend direction on larger timeframes (e.g., daily, 4-hour).
Support/Resistance: Use inside and outside bars near key levels for confirmation or reversal signals.
Volume: Higher volume on directional bars strengthens the momentum signal.
Customize the Colors:
Adjust the bar highlight colors to fit your chart theme for better visibility.
No Automatic Signals:
This indicator doesn’t provide explicit buy/sell recommendations. Instead, use the visual highlights to make informed decisions based on your trading strategy.
By interpreting these bar patterns, you can better gauge market behavior and make more confident decisions without relying on preset signals.

5-Minute YEN Pivot Bars 1.0The 5-Minute YEN Pivot Bars indicator is designed to identify and highlight low-range pivot bars on 5-minute charts, specifically tailored for Yen-based pairs (e.g., GBPJPY, USDJPY). By focusing on precise pip thresholds, this tool helps traders detect potential pivot points within specific trading sessions, while avoiding inside bars and other noise often seen in low-volatility conditions. This can be particularly useful for trend traders and those looking to refine their entry points based on intraday reversals.
Key Features:
- Customized Pip Thresholds for Yen Pairs:
The indicator is pre-configured for Yen pairs, where 1 pip is typically represented by 0.01. It applies these thresholds:
- Limited Range: 4 pips or less between open and close prices.
- High/Low Directionality: At least 3 pips from the close/open to the bar's high or low.
- Open/Close Proximity: 4 pips or less between open and close.
- Inside Bar Tolerance: A tolerance of 3 pips for inside bars, helping reduce false signals from bars contained within the previous bar's range.
- Session-Specific Alerts:
- The indicator allows you to enable alerts for the European Session (6:00-12:00), American Session (12:00-17:00), and London Close (17:00-20:00). You can adjust these times based on your own trading hours or timezone preferences via a time-shift setting.
- Receive real-time alerts when a valid bullish or bearish pivot bar is identified within the chosen sessions, allowing you to respond to potential trade opportunities immediately.
- Time Shift Customization:
- Adjust the "Time Shift" parameter to account for different time zones, ensuring accurate session alignment regardless of your local time.
How It Works:
1. Pivot Bar Identification:
The indicator scans for bars where the difference between the open and close is within the "Limited Range" threshold, and both open and close prices are close to either the high or the low of the bar.
2. Directional Filtering:
It requires the bar to show strong directional bias by enforcing an additional distance between the open/close levels and the opposite end of the bar (high/low). Only bars with this directional structure are considered for highlighting.
3. Exclusion of Inside Bars:
Bars that are completely contained within the range of the previous bar are excluded (inside bars), as are consecutive inside bars. This filtering is essential to avoid marking bars that typically indicate consolidation rather than potential pivot points.
4. Session Alerts:
When a valid pivot bar appears within the selected sessions, an alert is triggered, notifying the trader of a potential trading signal. Bullish and bearish signals are differentiated based on whether the close is near the high or low.
How to Use:
- Trend Reversals: Use this indicator to spot potential trend reversals or pullbacks on a 5-minute chart, especially within key trading sessions.
- Entry and Exit Points: Highlighted bars can serve as potential entry points for traders looking to capitalize on short-term directional changes or continuation patterns.
- Combine with Other Indicators: Consider pairing this tool with momentum indicators or trendlines to confirm the signals, providing a comprehensive analysis framework.
Default Parameters:
- Limited Range: 4 Pips
- High/Low Directionality: 3 Pips
- Open/Close Proximity: 4 Pips
- Inside Bar Tolerance: 3 Pips
- Session Alerts: Enabled for European, American, and London Close sessions
- Time Shift: Default 6 (adjustable to align with different time zones)
This indicator is specifically optimized for Yen pairs on 5-minute charts due to its pip calculation.

Simultaneous INSIDE Bar Break IndicatorSimultaneous Inside Bar Break Indicator (SIBBI) for The Strat Community
Overview:
The Simultaneous Inside Bar Break Indicator (SIBBI) is designed to help traders using The Strat methodology identify one of the most powerful breakout patterns: the Simultaneous Inside Bar Break across multiple symbols. This indicator detects when all four user-selected symbols form inside bars on the previous candle and then break those inside bars in the same direction (either bullish or bearish) on the current candle.
Inside bars represent consolidation periods where price action does not break the high or low of the previous candle. When a simultaneous break occurs across multiple symbols, this often signals a strong move in the market, making this a key actionable signal in The Strat trading strategy.
Key Features:
Multi-Symbol Analysis: You can track up to four different symbols simultaneously. By default, the indicator comes with SPY, QQQ, IWM, and DIA, but you can modify these to track any other assets or symbols.
Inside Bar Detection: The indicator checks whether all four symbols have inside bars on the previous candle. It only triggers when all symbols meet this condition, making it a highly specific and reliable signal.
Simultaneous Break Detection: Once all symbols have inside bars, the indicator waits for a breakout in the same direction across all four symbols. A simultaneous bullish break (prices breaking above the previous candle’s high) triggers a green label, while a simultaneous bearish break (prices breaking below the previous candle’s low) triggers a red label.
Dynamic Label Timeframe: The indicator dynamically adjusts the timeframe in the label based on the user’s selected timeframe. This allows traders to know precisely which timeframe the break is occurring on. If the user selects "Chart Timeframe," the indicator will evolve with the current chart's timeframe, making it more versatile.
Timeframe Flexibility: The indicator can be set to analyze any timeframe—15-minute, 30-minute, 60-minute, daily, weekly, and so on. It only works for the specific timeframe you set it to in the settings. If set to "Chart Timeframe," the label will adapt dynamically based on the timeframe you are currently viewing.
Customizable Labels: The user can choose the size of the labels (tiny, small, or normal), ensuring that the visual output is tailored to individual preferences and chart layouts.
Best Use Case:
The Simultaneous Inside Bar Break Indicator is particularly powerful when applied to multiple timeframes. Here’s how to use it for maximum impact:
Multi-Timeframe Setup: Set the indicator on various timeframes (e.g., 15-minute, 30-minute, 60-minute, and daily) across multiple charts. This allows you to monitor different timeframes and identify when lower timeframe breaks trigger potential moves on higher timeframes.
Anticipating Strong Moves: When a simultaneous inside bar break occurs on one timeframe (e.g., 30-minute), keep an eye on the higher timeframes (e.g., 60-minute or daily) to see if those timeframes also break. This stacking of inside bar breaks can signal powerful market moves.
Higher Conviction Signals: The indicator is designed to provide high-conviction signals. Since it requires all four symbols to break in the same direction simultaneously, it reduces false signals and focuses on higher probability setups, which is crucial for traders using The Strat to time their trades effectively.
How the Indicator Works:
Inside Bar Formation: The indicator first checks that all four selected symbols had inside bars in the previous bar (i.e., the current high and low are contained within the previous bar’s high and low).
Simultaneous Break Detection: After detecting inside bars, the indicator checks if all four symbols break out in the same direction—bullish (breaking above the previous bar’s high) or bearish (breaking below the previous bar’s low).
Label Display: When a simultaneous inside bar break occurs, a label is plotted on the chart—either green for a bullish break (below the candle) or red for a bearish break (above the candle). The label will display the timeframe you set in the settings (e.g., "IBSB 60" for a 60-minute break).
Chart Timeframe Option: If you prefer, you can set the indicator to evolve with the chart’s current timeframe. In this mode, the label will not show a specific timeframe but will still display the simultaneous inside bar break when it occurs.
Recommendations for Usage:
Focus on Multiple Timeframes: The Strat methodology is all about understanding the relationship between different timeframes. Use this indicator on multiple timeframes to get a better picture of potential moves.
Pair with Other Strat Techniques: This indicator is most powerful when combined with other Strat tools, such as broadening formations, timeframe continuity, and actionable signals (e.g., 2-2 reversals). The simultaneous inside bar break can help confirm or invalidate other signals.
Customize Symbols and Timeframes: Although the default symbols are SPY, QQQ, IWM, and DIA, feel free to replace them with symbols more relevant to your trading. This indicator works well across equities, indices, futures, and forex pairs.
How to Set It Up:
Select Symbols: Choose four symbols that you want to track. These can be index ETFs (like SPY and QQQ), individual stocks, or any other tradable instruments.
Set Timeframe: In the indicator’s settings, choose a specific timeframe (e.g., 15-minute, 30-minute, daily). The label will reflect the selected timeframe, making it clear which time-based break you are seeing.
Optional - Chart Timeframe Mode: If you want the indicator to adapt to the chart’s current timeframe, select the "Chart Timeframe" option in the settings. The indicator will plot the breaks without showing a specific timeframe in the label.
Customize Label Size: Depending on your chart layout and personal preference, you can adjust the size of the labels (tiny, small, or normal) in the settings.
Conclusion:
The Simultaneous Inside Bar Break Indicator is a powerful tool for traders using The Strat methodology, offering a highly specific and reliable signal that can indicate potential large market moves. By monitoring multiple symbols and timeframes, you can gain deeper insight into the market's behavior and act with greater confidence. This indicator is ideal for traders looking to catch high-conviction moves and align their trades with broader market continuity.
Note: The indicator works best when paired with multi-timeframe analysis, allowing you to see how breaks on lower timeframes might influence larger trends. For traders who prefer simplicity, setting it to the "Chart Timeframe" mode offers flexibility while maintaining the core benefits of this indicator.

Multi Bar OHLC Compare Panel (Floating Grid)Multi Bar OHLC Compare Panel by RagingRocketBull 2019
version 1.0
This indicator lets you compare OHLCV values from several specified bars. Bars can be dynamic/persistent.
You can also use it as an alternate OHLC panel if you don't like small font of the native TradingView panel.
It uses Pinescript v4 to output data dynamically as string labels in a horiz/vertical grid.
Features:
- Floating Panel with customizable horiz/vertical layout and grid spacing
- Support for up to 5 OHLC bars (highlighted with markers)
- Outputs Bar #/index, OHLCV, Bar Change Value/%, Exchange/Ticker, Timeframe, Timestamp strings
- Dynamic (fixed offset)/Persistent bars (fixed time)
- Show/Hide parts of strings
- Full output string customization, including text size, date/time format and delimiters
- 2 Anchor points for panel offset: cur bar high or range high
- Bar Change can change color
Usage:
- specify at least 1 bar index as OHLC source
- select anchor point to position the panel
- select horiz/vertical grid layout
- adjust horiz/vertical spacing
- customize output strings as needed
Notes:
- this indicator uses Pinescript v3 Compatibity Framework
- both bars 1,2 are required for log scale adjustment to work
- you can't attach the panel to screen's top/bottom and must use offset/anchor because, unlike plotshape, string labels don't support yloc=yloc.top/bottom, only yloc.above/belowbar
- you can't precisely align strings in a grid because there's no label.get_width/height to calculate mid/left points, only get_x/y/text. Alignment will break depending on string length, zoom and change color option on/off
- bar change is rendered as a separate label when change color is enabled (2 panels total) and merged into the main panel when disabled (single panel)
- you can't change the order of strings as playing with the natural order of things isn't the best of ideas
- you can modify the script to compare up to 50 OHLC bars, but do you need that much power? Of course, you do.
- you can't set color/style for string labels in Style UI, so a few extra settings were added.
- bar index is limited to 5000 for free accounts (10000 for paid), will show an error when exceeded, also when it exceeds the total number of bars in history
- in persistent bars mode all bars with index > 0 are considered persistent, bar 0 always remains a dynamic bar
- persistent bars' offset is reset: in replay mode on exit or when price reaches cur bar, or when panel layout is changed from h to v in both replay/realtime modes
- initial pos of each persistent bar relative to the first realtime bar anchor doesn't change during session - new persistent bars introduced during session are attached to the most recent cur bar anchor
P.S. Everything is proceeding as I have foreseen
