pine script tradingbot - many ema oscillator## 🧭 **Many EMA Oscillator (TradingView Pine Script Indicator)**
*A multi-layer EMA differential oscillator for trend strength and momentum analysis*
---
### 🧩 **Overview**
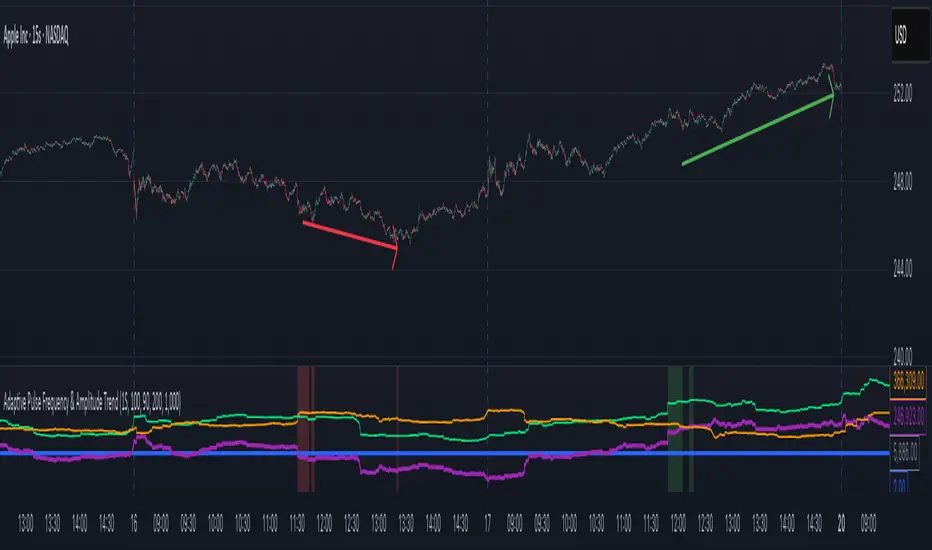
The **Many EMA Oscillator** is a **TradingView Pine Script indicator** designed to help traders visualize **trend direction**, **momentum strength**, and **multi-timeframe EMA alignment** in one clean oscillator panel.
It’s a **custom EMA-based trend indicator** that shows how fast or slow different **Exponential Moving Averages (EMAs)** are expanding or contracting — helping you identify **bullish and bearish momentum shifts** early.
This **Pine Script EMA indicator** is especially useful for traders looking to combine multiple **EMA signals** into one **momentum oscillator** for better clarity and precision.
---
### ⚙️ **How It Works**
1. **Multiple EMA Layers:**
The indicator calculates seven **EMAs** (default: 20, 50, 100, 150, 200, 300) and applies a **smoothing filter** using another EMA (default smoothing = 20).
This removes short-term noise and gives a smoother, professional-grade momentum reading.
2. **EMA Gap Analysis:**
The oscillator measures the **difference between consecutive EMAs**, revealing how trend layers are separating or converging.
```
diff1 = EMA(20) - EMA(50)
diff2 = EMA(50) - EMA(100)
diff3 = EMA(100) - EMA(150)
diff4 = EMA(150) - EMA(200)
diff5 = EMA(200) - EMA(300)
```
These gaps (or “differentials”) show **trend acceleration or compression**, acting like a **multi-EMA MACD system**.
3. **Color-Coded Visualization:**
Each differential (`diff1`–`diff5`) is plotted as a **histogram**:
- 🟢 **Green bars** → EMAs expanding → bullish momentum growing
- 🔴 **Red bars** → EMAs contracting → bearish momentum or correction
This gives a clean, compact view of **trend strength** without cluttering your chart.
4. **Automatic Momentum Signals:**
- **🟡 Up Triangle** → All EMA gaps increasing → strong bullish trend alignment
- **⚪ Down Triangle** → All EMA gaps decreasing → trend weakening or bearish transition
---
### 📊 **Inputs**
| Input | Default | Description |
|-------|----------|-------------|
| `smmoth_emas` | 20 | Smoothing factor for all EMAs |
| `Length2`–`Length7` | 20–300 | Adjustable EMA periods |
| `Length21`, `Length31`, `Length41`, `Length51` | Optional | For secondary EMA analysis |
---
### 🧠 **Interpretation Guide**
| Observation | Meaning |
|--------------|----------|
| Increasing green bars | Trend acceleration and bullish continuation |
| Decreasing red bars | Trend exhaustion or sideways consolidation |
| Yellow triangles | All EMA layers aligned bullishly |
| White triangles | All EMA layers aligned bearishly |
This **EMA oscillator for TradingView** simplifies **multi-EMA trading strategies** by showing alignment strength in one place.
It works great for **swing traders**, **scalpers**, and **trend-following systems**.
---
### 🧪 **Best Practices for Use**
- Works on **all TradingView timeframes** (1m, 5m, 1h, 1D, etc.)
- Suitable for **stocks, forex, crypto, and indices**
- Combine with **RSI**, **MACD**, or **price action** confirmation
- Excellent for detecting **EMA compression zones**, **trend continuation**, or **momentum shifts**
- Can be used as part of a **multi-EMA trading strategy** or **trend strength indicator setup**
---
### 💡 **Why It Stands Out**
- 100% built in **Pine Script v6**
- Optimized for **smooth EMA transitions**
- Simple color-coded momentum visualization
- Professional-grade **multi-timeframe trend oscillator**
This is one of the most **lightweight and powerful EMA oscillators** available for TradingView users who prefer clarity over clutter.
---
### ⚠️ **Disclaimer**
This indicator is published for **educational and analytical purposes only**.
It does **not provide financial advice**, buy/sell signals, or investment recommendations.
Always backtest before live use and trade responsibly.
---
### 👨💻 **Author**
Developed by **@algo_coders**
Built in **Pine Script v6** on **TradingView**
Licensed under the (mozilla.org)
Penunjuk Pine Script®