EMA Confirmations & RejectionsWant to know how the bulls and bears are doing? Use this to see the attempts made for making big moves and their outcomes to feel more confident in your entry or exit and know when the tides are turning. Do not read a single arrow or cross on the chart and think it means one thing. Take in the big picture and detect patterns and frequency of good or bad signals to determine the likelihood of the future being bullish or bearish. For example, more green arrows than orange arrows in a consolidation period would suggest a break to the upside is more likely.
There are 4 different signals this indicator can print:
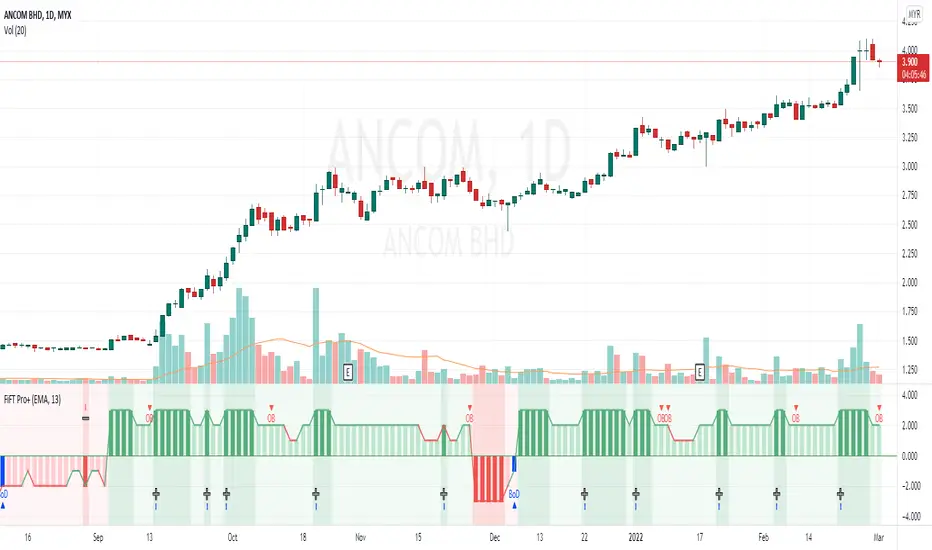
1. A green arrow indicates a move of strength to the upside has begun. Could be a bull trap or the start of a long lasting bullish move.
2. An orange arrow indicates a move of strength to the downside has begun. Could be a bear trap or the start of a long lasting bearish move.
3. A blue cross is printed above if the break was to the upside, or below if it was to the downside. Indicates a failed attempt to change the trend and bullish price action is more likely in the next few candles.
4. A red cross is printed above if the break was to the upside, or below if it was to the downside. Indicates a failed attempt to change the trend and bearish price action is more likely in the next few candles.
The location of the cross is more important than the colour. Above means pressure downwards, and below means pressure upwards.
Pro Tip: Green arrows below 50 on the RSI are more meaningful than when above. This also works for orange arrows when above 50.
Penunjuk Pine Script®