Chanu Delta IndicatorThe Chanu Delta Indicator was created as the price difference between the two markets using the principle that the Bitcoin price fluctuations in the BTCUSD market on the BYBIT exchange are greater in the BTCUSDT market. This indicator shows the strength of the current market's buys and sells, and helps in short-term trading.
Chanu Delta Indicator (Δ) = BTCUSD ($) - BTCUSDT ($) (Unit: Dollar, Source: Close)
● Δ > 100 : Strong Buy
● 20 < Δ < 100 : Buy
● -20 < Δ < 20 : Neutral
● -100 < Δ < -20 : Sell
● Δ < -100 : Strong Sell
Cari dalam skrip untuk "bitcoin"

Aggregated Volume Colored (Bitcoin, ETH, Altcoins, everything)BITSTAMP:BTCUSD
This indicator aggregates trading volume data of up to 10 symbols and can display the individual data by color.
It is useful for assets which are traded on multiple exchanges, like cryptocurrencies, commodities, forex and derivatives showing you what is happening across the market and on the individual exchanges to give you beter insights.
You can change the symbols from which the indicator gathers data in the settings under inputs, just like the colors, and you can add a moving average.
By default trading volume is aggregated from the following symbols:
Binance, BTC /USDT
Binance, BTC /BUSD
Bingbon, BTC /USD
Huobi, BTC /USDT
OkeX, BTC /USDT
Coinbase, BTC /USD
Bitfinex, BTC /USD
Gemini, BTC /USD
Kraken, XBT/USD
Bitstamp, BTC /USD

Bubble indicatorA simple and accurate indicator that signals the end of the Bitcoin's bull run. This indicator is an inverted lower Bollinger band , taken from a weekly chart. An interesting observation led to the creation of this indicator: on the weekly chart the lower band takes negative values (the red zone in the indicator) at the end of the Bitcoin's bull run. The advantage of this indicator is that the signal comes in advance.

SWING for GOLD / BITCOIN Hey everyone
I want to share my swing trading system with you.Based on two moving averages coupled to RSI
The options
Shows current trends and entries for trades. Average trade retention 15-20 days
Entries for trades with a crossover of two lines
The percentage of successful test deals XAU/USD for 2010-2021: 69%

High Timeframe POCBecause the big Bitcoin crash I have been looking a lot at high timeframe metrics. I never spent much time learning POC so I decided to create a little script for determining these on higher timeframes.
Currently included: Monthly, 3 months and 6 months.
/* DEFINITION */
Point Of Control (= POC) is a price level at which the heaviest volumes were traded.
Value Area High/Low (=VAH/VAL) is a range of prices where the majority of trading volume took place. Naturally, Value Area High being the top price level and Value Area Low being the lowest. POC always is between the two.
/* HOW TO TRADE WITH THIS INDICATOR */
The basis for POC is determining bias on whichever timeframe you choose.
1. Identify a POC on the timeframe of your choosing.
/* If you choose a "low" timeframe (monthly here) then make sure to look at the higher timeframes to see how it is playing against a higher timeframe POC.
2. When the price is moving away from the POC (either to the upside or downside) this will confirm or invalidate the trade.
3. You can now enter the trade on bias or wait for a retest of the same POC.
/* EXAMPLE TRADES /*
Here is a screenshot of some of the trades that are possible solely using the POC and some common sense.
s3.tradingview.com

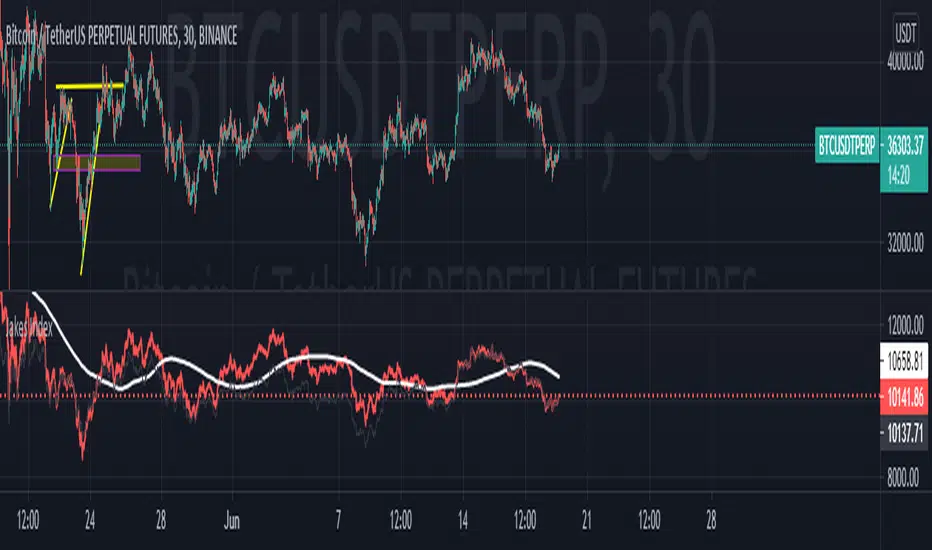
Jakes Index------------
English
I introduce the community to the Jakes Index. Basically, this is an index containing the top 10 cryptocurrencies, classified according to their Marketcap. The purpose of this index is to show a general market context, without being tied to a single crypto. With an overview of the market, it is easier to identify the market trend, in addition to being an excellent indicator to gauge the performance of your Crypt portfolio. Supply data comes from CoinMarktCap, and price data comes mostly from Binance, however some crypts are not yet available for trading by it, so the prices used come from the first broker indicated by TradingView in the search.
Given that one of the crypts was launched very recently, Internet Computer to be more exact, I decided to leave it out of the index, adding "//" to the code in all references to it. If you want to see the performance of the index with the included cryptography, just delete the bars that follow in front of your code, such parts: "ASSET8; SUPPLY8; PESO8; QOC8; FINM8" after that add "//" in "PESO11" and remove the bars from "PESSO11F", in addition to also removing the F. Do the same with "JAKESINDEX" at the end of the code, and you will have the result with the Internet Computer included.
The calculation of the index takes into account the Marketcap of the crypto, which is divided by the sum of the Marketcap of all the others, and then the result is multiplied by the market value of the Cryptocurrency. Thus, we have an index weighted by Marketcap with the 10 most important cryptocurrencies in the market AT THE TIME. It is important to remember that this index must be updated, both in terms of the currencies that change their place in the ranking with certain frequency, as the Supply that each one has, since coins with active mining, as is the case of Bitcoin, change their Supply frequently.
To keep the index up to date, I will do ONE Monthly update, always posting the code with the new changes.
------------
Português
Apresento a comunidade o Jakes Index. Basicamente, este é um índice contendo as 10 principais criptomoedas, classificadas de acordo com seu Marketcap. O objetivo deste índice é mostrar um contexto geral do mercado, sem ficar preso a uma única cripto. Com um apanhado geral sobre o mercado, fica mais fácil identificar a tendência do mercado, além de ser um excelente indicador para balizar o desempenho da sua carteira de Criptos. Os dados referentes a Supply são advindos do CoinMarktCap, e os dados dos preços vem em sua maioria da Binance, porém algumas criptos ainda não estão disponíveis para negociação pela mesma, portanto os preços utilizados vem da primeira corretora indicada pelo TradingView na busca.
Tendo em vista que uma das criptos foi lançada muito recentemente, a Internet Computer para ser mais exato, decidi deixa-la de fora do índice, adicionando "//" no código em todas as referencias a mesma. Caso queira ver o desempenho do índice com a cripto incluída, basta apagar as barras que seguem na frente de seu código, sendo tais partes: "ASSET8; SUPPLY8; PESO8; QOC8; FINM8" após isso adicione "//" em "PESO11" e remova as barras de "PESSO11F", além de remover também o F. Faça o mesmo com "JAKESINDEX" no fim do código, e terá o resultado com a Internet Computer incluída.
O calculo do índice leva em conta o Marketcap da cripto, que é dividio pela soma do Marketcap de todas as outras, e então o resultado é multiplicado pelo valor a mercado da Criptomoeda. Dessa forma, temos um índice ponderado pelo Marketcap com as 10 Criptomoedas mais importantes do mercado NO MOMENTO. É importante lembrar que este índice deve ser atualizado, tanto em questão das moedas que mudam com certa frequência seu lugar no ranking, como o Supply que cada uma tem, visto que moedas com mineração ativa, como é o caso do Bitcoin, mudam seu Supply com frequência.
Para manter o índice atualizado, farei UMA atualização Mensal, postando sempre o código com as novas alterações.
Moving Average BandsUse this script to find buy and sell zones for BTC based on momentum of the move relative to the average asset price over a given period. The script plots a series of offset bands above and below the Simple Moving Average. When price crosses another band further from the SMA, the background is rendered brighter. The brighter the background, the stronger the buy and sell signal is, as the expectation is that price wants to return to the SMA. Settings are adjustable to fine tune to various time frames and assets. Good settings for BTC Daily are length 30, layers at 10, 20, 30, and 40.
On 1H BTC/USD I use length 200, layers at 5, 10, 15, 20 to find decent swing trading opportunities.
On BTC/USD 1D chart, combine with Bitcoin Logarithmic Growth Curve from @mabonyi (original by @quantadelic )for confluence of very reliable signals.

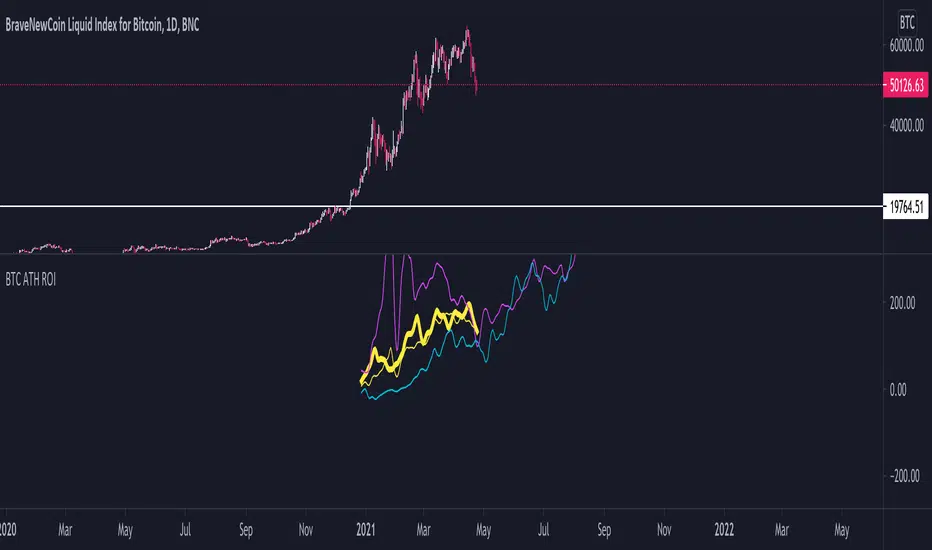
BTC ATH ROIThis indicator shows the ROI % of Bitcoin from when it passed its ATH of the previous bull cycle. I found it interesting that each time it crossed its ATH it took around 260-280 days to peak for each one. This bull run seems to follow between both of the previous bull runs including this recent dip.
There are a couple issues I want to fix but can't figure out:
1. You need to completely scroll out and move towards 2013 on the Daily chart for all 3 lines to show up. Would be nice to load all of that data at the start.
2. I can't query the value of the plots after they have been offset. This would be useful to create a prediction bias for the current plot so would could see where btc might go.
If you peeps know of a way to load all data or query plot values after offsets, please share. That would be awesome.
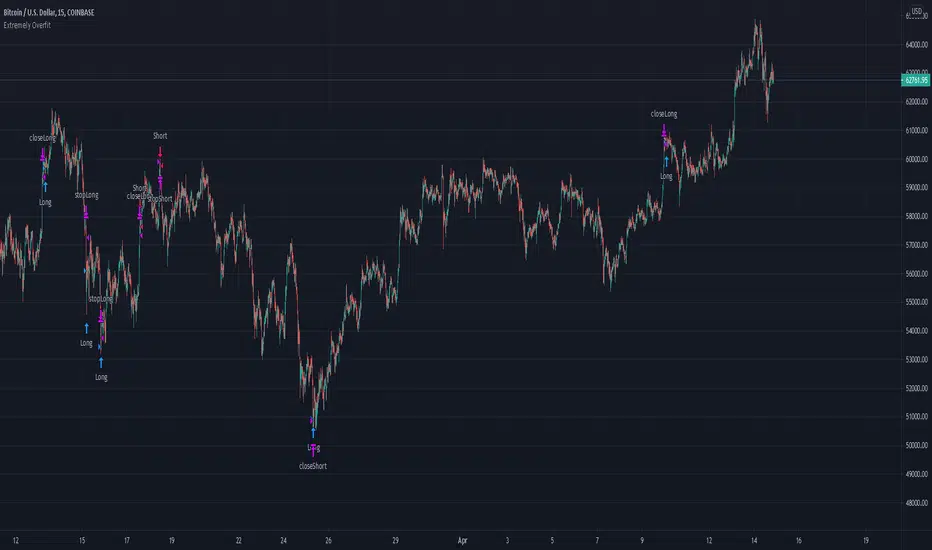
Extremely Overfit Bitcoin Long/ShortThis is a highly overfit (in my opinion) script to long/short BTC on the 15m time frame. May be usable for other cryptocurrencies or timeframes with some parameter adjustments. I backtested it on a few exchanges with ETH.
The simplest way to increase the number of trades is to decrease the "FastChannelLength" parameter or increase the "SlowChannelLength" parameter, or both. Decreasing the margins of the channels also increases the number of trades. In GENERAL, you should expect that adding more trades will hurt profitability, because, as the title says, this script is extraordinarily overfit.
It does include a commission fee from the start, which I find is essential to not providing an overly rosy view of how a strategy would work.
Performante's Average Bitcoin Volume EMA Indicator This is the average Bitcoin volume with the data collected from the major retail exchanges + the exponential moving average (EMA) for the volume added on to better understand relative volume.
Thank you Julio!

Sharktank - Pi Cycle PredictionThe Pi Cycle indicator has called tops in Bitcoin quite accurately. Assuming history repeats itself, knowledge about when it might happen again could benefit you.
The indicator is fairly simple:
- A daily moving average of 350 ("long_ma" in script)
- A daily moving average of 111 ("short_ma" in script)
The value of the long moving average is multiplied by two. This way the longer moving average appears above the shorter one.
When the shorter one (orange colored) crosses above the longer (green colored) one, it could mean the top is in.
These moving averages rise at a certain rate. Using these rates we could try to estimate a possible crossover moment. That's exactly what this indicator does! It gives the user a prediction of when a crossover might happen.
Special thanks to:
- Ninorigo, for making his indicator public. This one uses his as a starting point.
- The_Caretaker, for coming up with this idea about calling a top. Yet, his is more price-based, this one is more time-based.

Scalping using RSI 2 indicator with TSLThis strategy implements a simply scalping using the RSI (calculated on two periods), the slopes of two MAs ( EMA or SMA ) having different lengths (by default, I use 50 and 200).
A trailing stop loss (%) is used.
Entry conditions:
.) Fast MA > Slow MA and Price > Slow MA and RSI < Oversold Threshold ------> go Long
.) Fast MA < Slow MA and Price < Slow MA and RSI > Overbought Threshold ------> go Short
Exit conditions:
.) Long entry condition is true and (close >= TP or close <= TSL ) ----> close short position
.) Short entry condition is true and (close <= TP or close >= TSL ) ----> close long position
The strategy performed best on Bitcoin and the most liquid and capitalized Altcoins but works excellent on volatile assets, mainly if they often go trending.
Works best on 3h - 4h time frame.
There's also an optional Volatility filter, which opens the position only if the difference between the two slopes is more than a specific value, which can be set in the study inputs. The purpose is not opening positions if the price goes sideways and the noise is way > than the signal.
Note:
.) the RSI length is 2;
.) the oversold Threshold is 90%;
.) the overbought Threshold is 10%;
.) by default, the trailing stop loss per cent is 1%;
.) by default, the fast MA length is 50;
.) by default, the slow MA length is 200;
.) by default, the MA used is EMA.
Cheers.

RSI Classic Strategy (by Coinrule)One of the questions hobbyist traders more often ask is: what is the perfect trading indicator?
Every indicator is just a tool, so its efficiency is proportional to your ability to read its signals and translate them into an actionable trading strategy. The RSI is likely the most flexible and easy to use among the technical indicators.
This trading strategy tries to catch short-term swings on the coins of your choice with a simple yet profitable setup.
Buy when the RSI is lower than 30 (you can adjust it to 35 in times of steep uptrend).
Sell when the RSI is greater than 65 (the target may range between 60 and 75 depending on the volatility of the coin).
Note that the buy signal comes when the indicator crosses below 30 and not when it crosses above 30 as it happens on the built-in RSI strategy on Tradingview.
The present script overperforms the built-in strategy, even adding trading fees and using a lower amount of capital for each trade (30%). That means that the system can deliver higher net-profits with lower risk levels.
A typical example of market conditions where this strategy works perfectly is as follows.
The first initial breakout indicates that a new leg up in the trend may start. Bitcoin starts to trade within a range which you can identify when it reaches the point 3. That is the perfect time to start the rule because
- trading within a channel anticipates possible swings up and down
- the trend is on the upside, providing low downside risk in buying the dips.
This strategy works well with selected coins of your choice, and it's a great fit on leverage exchanges like Binance Futures.
If you prefer to run it across all available coins on the market, instead, you may choose an optimized version.

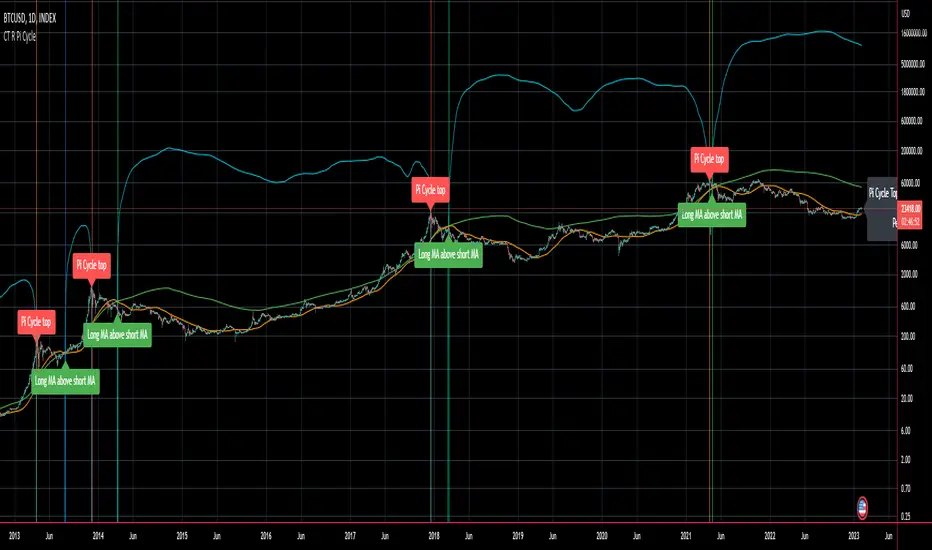
CT Reverse Pi Cycle Bitcoin Top IndicatorIntroducing the Reverse BTC Pi Market Cycle Top indicator
Much respect to Philip Swift the original creator of this idea and big thanks to Tradingview author Ninorigo for sharing the script which this indicator is based on.
Philip Swift has noted that:
Using the x2 multiple of the 350 day moving average along with the 111 day moving average provides an interesting market cycle indicator.
Over the past three market cycles, when the 350DMA x2 crosses below the 111DMA, Bitcoin price peaks in its market cycle, this has been accurate to within three days of Bitcoin price topping out.
Here I have modified an existing script by Tradingview author @Ninorigo which shows the moving averages and gives signals upon crossover by adding the following features:
A function which shows the price at which the 350DMA will Cross Below the 111DMA.
(This is calculated from the prior bar closing data and does not repaint)
An “anticipated cross” function which may give a 1 bar advanced warning of a cross.
(this is calculated from current bar values and may change and repaint)
The crossover levels are shown in an info label to the right of the current price.
When there is a BTC Pi Market Cycle Top anticipated cross on the next bar there will be an orange background signal.
When there is an actual BTC Pi Market Cycle Top cross there will be a red background signal
When there is an anticipated cross back there will be a blue background signal
When there is an actual cross back there will be a green background signal
This indicator will show the appropriate moving averages and crossover information from the daily timeframe regardless of the timeframe you are using.
This should be helpful in more accurately identifying the price level where the Pi Market Cycle moving averages will cross denoting a possible market cycle top.
It is interesting to note:
350 / 111 = 3.153
Which is the closest we can get to Pi when dividing 350 by another whole number.
This is a script to give another view and metric on an interesting experimental idea. This is not financial advice.
rocketLaunchI wanted to see if I could programmatically identify the conditions I saw just before Bitcoin broke its all-time high end of 2020. The signal picks up several rocket launch moments prior to launching which is quite cool. It also picks up a few false starts, however. In any case, I would have loved to be stopped out on those false starts but been there for all the starts this thing picks up.
It could probably use more confirmatory elements such as trailing conditions and volume perhaps?
BINANCE:BTCUSDTPERP

GBTC premium as a percentage of the bitcoin pricePlots the GBTC premium as a percentage of the bitcoin price at the close. It also includes the annual management fee (2% at the moment). It accrues on a daily, weekly or monthly basis depending on the chart resolution. (intraday not supported) The amount of bitcoin per gbtc share and the annual fee may be changed by Grayscale in the future. Those values can be easily update in the script settings.


gold price levels denominated in usd/gramsPlots the gold price (USD) for the quantities (grams) identified as support or resistance in the indicator settings. Default values are:
75 gold grams
300 gold grams
500 gold grams
1000 gold grams
5000 gold grams
More context: The purchasing power of Bitcoin

[MACLEN] HODL ZONE RENKO
PLEASE READ!
Trade at your own risk. Please read about renko charts before using this indicator. This indicator is for educational purposes only.
This Indicator is only valid in renko charts with 1 second timeframe. For BTCUSDT . With the traditional method and the size box of 80.
With this indicator we can detect zones of buy and sell. Even that is not recommended to use leverage, I use it to find an entry and use only small leverages. It could be also used to accumulate and HODL bitcoin .
Please, comment anything.
POR FAVOR LEER!
Tradea bajo tu propio riesgo. Por favor lee sobre las graficas renko antes de usar este indicador. Este indicador es solamente con fines educativos.
Este indicador es válido solamente en graficas renko con un timeframe de 1 segundo. Para BTCUSDT . Con cajas del método tradicional de un tamaño de 80.
Con este indicador podemos detectar zonas de compra y venta. A pesar de que no es recomendable usar apalancamiento, yo lo uso para encontrar entradas y solo uso apalancamientos pequeños. También podría usarse para acumular y holdear bitcoin .
Por favor, escríbeme cualquier duda o comentario.

GBTC & BTCE Premium Indicator- This indicator illustrates the premium of GBTC and the European equivalent, BTCE. Relative to the spot price of Bitcoin
- It represents the premium investors are willing to pay to be able to gain exposure to Bitcoin . Whilst holding them in an investment vehicle such as a 401k or an ISA.
- The premiums can be plotted. GBTC vs BTCUSD and BTCE vs BTCEUR
OR
- The "real price" of BTCUSD , GBTC and BTCE (denominated in USD) can be plotted against each other

Pixel ArtHaving Fun with Arrays.
I couldn't load all of the images into their respective arrays without getting an "Internal Pine error" So I commented out some of them. You can pop them back in, but make sure to disable another in its place.
Vader
Pine Logo
&hearts
Bitcoin
pAulse
