T3 + BB
TRES EMAS + BANDAS DE BOLLINGER
INDICADOR 1: TRES EMAS (MEDIA MOVIL EXPONENCIAL)
Con este indicador puede visualizar el promedio de precios con mayor peso a los datos mas recientes.
Se calculan y dibujan tres medias móviles exponenciales: 4, 20 y 200 últimas velas.
-Rápida EMA1 = 4, paso = 1
-Media EMA2 = 20, paso = 2
-Lenta EMA 3 = 200, paso = 10
INDICADOR 2: BANDAS DE BOLLINGER
Con este indicador podrá ver la fuerza y la tendencia del mercado, es decir la mide la volatilidad del precio del activo.
Si el precio sobrepasa la banda superior, el activo está sobrecomprado.
Si el precio sobrepasa la banda inferior, el activo está sobrevendido.
Longitud tendencia - BASE = 20, paso = 1
Desviación Estándar - Multiplicador = 2, paso = 0.2
Estos 2 indicadores sirven para todo tipo de activos: FOREX, CRIPTO, CFD´s, ETC.
------------------------------------------------------------------------------------------------------------------
THREE EMAS + BOLLINGER BANDS
INDICATOR 1: THREE EMAS (EXPONENTIAL MOVING AVERAGE)
With this indicator you can visualize the average of prices with greater weight to the most recent data.
Three exponential moving averages are calculated and drawn: 4, 20 and 200 last candles.
-Fast EMA1 = 4, step = 1
-Average EMA2 = 20, step = 2
-Slow EMA 3 = 200, step = 10
INDICATOR 2: BOLLINGER BANDS
With this indicator you can see the strength and trend of the market, that is, it is measured by the volatility of the asset price.
If the price goes above the upper band, the asset is overbought.
If the price goes above the lower band, the asset is oversold.
Trend length - BASE = 20, step = 1
Standard Deviation - Multiplier = 2, step = 0.2
These 2 indicators are used for all types of assets: FOREX, CRYPT, CFD's, ETC.
Cari dalam skrip untuk "bollingerband"

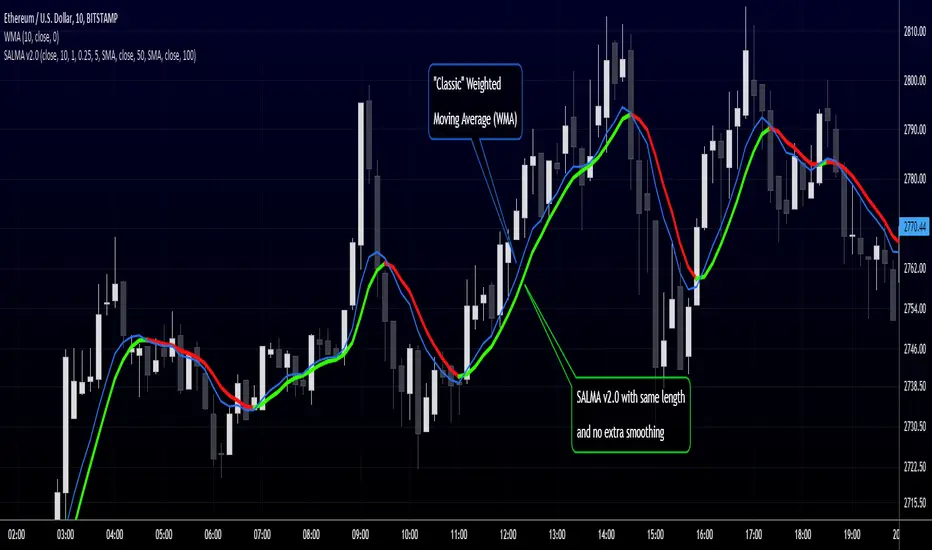
RedK Smooth And Lazy Moving Average (SALMA)Here's a quick and simple script that produces yet another Smooth and Lazy Moving Average - SALMA - that helps hide noise caused by extreme price fluctuations to enable better trend visualization and tracking
Concept:
===========
SALMA is based on a simple concept - we calculate a standard deviation channel of a user-selected width - then correct the price value so that it is restricted within the boundaries of the SD channel - effectively adjusting against high-volatility, sudden price moves - which acts as a pre-smoothing of the price values - then we calculate our moving average and apply extra smoothing as needed.
Since only "persistent" price moves will have an effect on the direction of this MA, it will be suitable to use as an additional trend guide with other indicators, and to consider only long positions when the price is above the SALMA, and short positions only when the price is below
Notes:
========
- for the time being, i'm using Weighted Moving Average (WMA) for the calculation of the base price MA and the SD channel - we can add other MA types as options in a future versions based on feedback
- will add alerts in a future update
- SALMA can be used with any timeframe. can also be set to a higher timeframe against a lower timeframe chart
i have also added couple of standard moving average lines (choose between SMA, EMA and WMA) of selectable lengths - to enable utilizing this in a Moving Average cross-over setup - or to simply monitor other common MA's that other traders are using.
here's how the settings look like when you add SALMA to your chart
Please feel free to play around with SALMA and share feedback :)
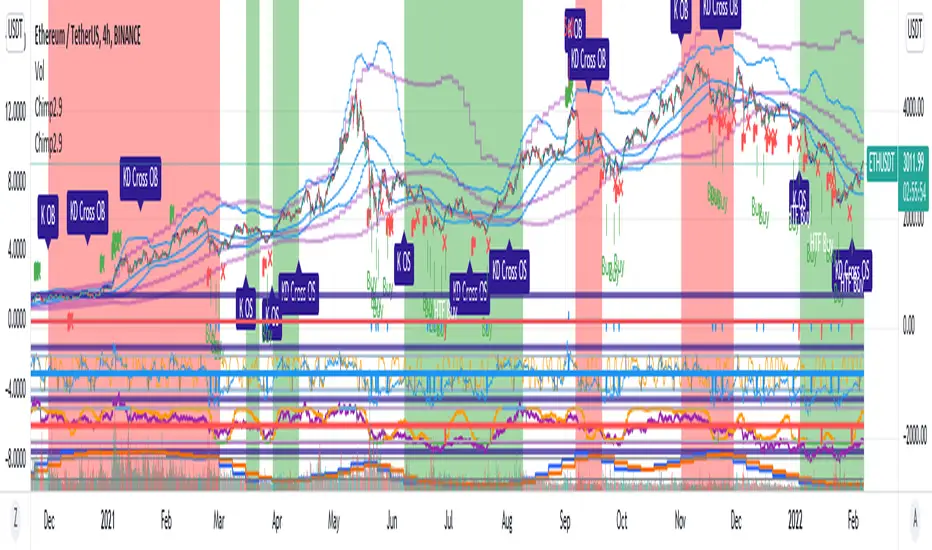
Chimpanzee V2.5 part A by joylay83Hi everyone, I am an amateur pinecoder. I would like to share my script which is coded with the intention of generating signals to send to 3commas webhook. It is still in development and revision.
This collection of indicators use:
Chart: 15m.
Inverse Fisher Transformation of the RSI to detect dips in the 15m timeframe.
Bollinger band (4H) to filter out false signals.
Triple EMA 21: to mimic price action for easier coding alerts. Currently not involved in generating signals. will be incorporated in the future.
StochRSI: As a visual filter. Currently not involved in generating signals. will be incorporated in the future.
Background will be green if stochRSI is low and red if stockRSI is high.
Candlesticks will be marked with a flag is TEMA breached BB.
One would need to play around with timeframes, BB settings and IFTRSI threshold for different signals.
There are 2 Signal Modes (with regards to IFTRSI):
Threshold: When price action falls below BB and IFTRSI hits buy threshold, a buy/sell signal is generated. Eg if IFTRSI buy threshold is set to -0.9, the buy signal will remain continuously positive as long as IFTRSI is < 0.9.
Cross: When price action falls below BB and IFTRSI hits threshold, nothing happens. It will wait until the IFTRSI cross back over the threshold before firing a signal.
There is another identical set of indicators running on a higher time frame (IFTRSI: 4H, BB: D or 3D, TEMA 21 4H) but on the same chart. This tend to generate less signals but are more reliable. A usage example would be to send a larger buy order if the signal comes from this higher time frame, or execute a sell order after multiple buys from the lower time frame.
It comes in 2 parts:
Part A: Contains overlay display. This displays BB, Triple EMA, buy/sell and StochRSI in labels. the labels are self explanatory.
Part B (please search for it): which is actually the same code but contain non-overlay display. You may also put part B overlay=true but scale to LEFT. The advantage of using overlay=true is that you can move the signal right over the candlesticks (mainly for troubleshooting/debugging). This part contains Inverse Fisher RSI, %B, Signal Line. %B is supposedly idential to Bollinger Bands in Part A.
By default, when there is a buy/sell signal:
lower time frame 15m: Signal Line in Part B will turn blue with a value 1 or -1 which corresponds to a buy or sell label in Part A
higher time frame 4H: Signal Line in Part B will turn red with a value 2 or -2 which corresponds to a HTF buy or sell label in Part A
Part A or B may be used to send signal to the webhook. You have to make sure that the settings of Part A and B are identical.
You may choose to un-display some items to reduce clutter.
Current problems:
1. Still too many buy signals
Although many times it will generate excellent buy signal at many swing lows, but there are many buy signals prior to a major swing low. This can be observed in the picture above. It also generate a couple of buy signals prior to the swing lows. I am currently experimenting with 20m and hourly timeframe to address this issue. More filters are needed eg an oscillator or detecting candlestick patterns.
2. Premature sell signals.
The sell signal is often generated at the beginning of a major bull run. My idea to solve this problem is to move to a higher timeframe and sell only when TEMA crossunder the upper bollinger band.
3. Lack of a backtester that can test multiple concurrent deals.
Buy -> Buy (average down) -> Buy (average down) -> Buy (average down) -> Sell
4. Lack of the ability to calculate average purchase price
Probably have to code it as a strategy
5. Display lag
As the browser is running 2 copies of the idential script, it tends to lag when you drag your chart around. So far there are no timeouts or delay in firing alerts to 3commas.
I do welcome any suggestion for improvement and constructive criticism. tqvm.
Credits : Thank you for doing an awesome job. I learnt a lot from your codes and tutorials.
Credits not listed in any order. If your code is used here and did not receive due credit, kindly drop me a note. tq.
Blessing 3 by JTA Today
@ZenAndTheArtOfTrading (extremely-easy-to-understand tutorials eg fixing repainting)
@LazyBear (various codes)
@Galactus-B Argo I
@TheTradingParrot (Inverse Fisher RSI and Gavin's backtester)
@zendog123 (backtester and various codes)
@ydeniz2000 (Bollinger Bands)
TradingView built-in scripts
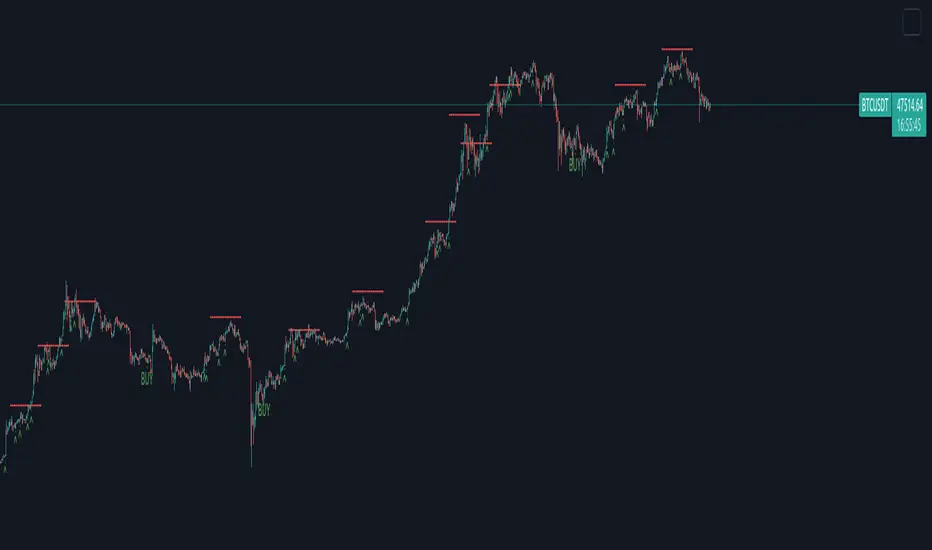
Creentrend Pressure SignalsThe hull moving average is my favorite moving average, as well as slower (55ma Bollinger Bands dev@(1.618)) is my favorite standard deviation indicator. Lets combine the two to evaluate overbought, oversold, and pressure.
Use for all time frames- I PREFER daily.
Bollinger band MA at 55
Hull ma at 55
The Hull is more reactive and faster than any band on the BB (both at 55)
When HULL closes BELOW LOWER BAND- it will print a buy signal, remember- over sold and overbought in VOLATILITY could be dangerous on low time frames, as swift moves typically have short term reversals but return to the main trend eventually, this is why i reccomend daily candles.
When PRICE closes ABOVE UPPER BOLLINGER BAND- it will print a green ^ signal under candle indicating upward pressure.
When HULL closes ABOVE UPPER BOLLINGER BAND- it will print a red resistance line. Complex tops happen a lot with bitcoin so take a 1-5% stop above it if shorting.
Contrarian Scalping Counter Trend Bb Envelope Adx and StochasticContrarian Scalping is an trading strategy designed to take advanted of a counter-trend.
The advantage of these strrategies types is that they have a good profitability but with do not great gain (in relation at the time frame).
Indicators used:
Bollinger
Envelope
ADX
Stochastic
Rules for entry
For short: close of the price is above upper band from bb and envelope, adx is below 30 and stochastic is above 50
For long: close of the price is below lower band from bb and envelope, adx is below 30 and stochastic is below 50
Rules for exit
For short: either close of the candle is below lower band of bb or enveloper or stochastic is below 50
For long: either close o the candle is above upper band of bb or envelope or stochastic is above 50
If there are any questions let me know !

Swing Assassin's Consolidated ScriptI put this script together to essentially consolidate a number of scripts that I use on a daily basis into one script. This is an ongoing improvement effort, so there may be some garbage in here right now so keep that in mind if you intend to use this to help in your trading.
There are 5 moving averages (Hull). I use the Fast, Mid and Slow to find entries after I us the Medium Slow and Super Slow to identify a trend. Otherwise, I have those three turned off.
This script also uses Bollinger Bands which I literally cannot trade without.
The script also has anchored VWAP , automated support/resistance lines, and a homebrewed Volume Profile that is a copy from Ildar Akhmetgaleev's indicator "Poor Man's Volume Profile" used under Mozilla Public License Version 2.0.

RSI Rising Crypto Trending AlertAlert version of the strategy with the same name
This is crypto and stock market trending strategy designed for long timeframes such as 4h+
From my tests it looks like it works better to trade crypto against crypto than trading against fiat.
Indicators used:
RSI for rising/falling of the trend
BB sidemarket
ROC sidemarket
Rules for entry
For long: RSI values are rising, and bb and roc tells us we are not in a sidemarket
For long: RSI values are falling, and bb and roc tells us we are not in a sidemarket
Rules for exit
We exit when we receive an opposite direction.
Cuation: Because this strategy uses no risk management, I recommend you takje care with it.
If you have any questions, let me know !

Advanced RSIThis is what I call the advanced RSI. It employs Bollinger bands on the RSI itself, in order to better highlight extremes that are still within the typical 30-70 range on.
You'll notice some background highlights. These are simply to mark the extremes.
Orange marks your standard overbought, Red marks oversold.
Fuchsia marks an RSI outside the lower deviation on the Bollinger Bands. Green marks an RSI outside the upper deviation on the Bollinger bands.
Typically while in an uptrend, the RSI dropping below the lower deviation indicates an entry point (fuchsia). The same applies for a downtrend with the RSI rising above the upper deviation (green).
You can look at the overlap in colors as even stronger indications because on a more rare occasion you will have the RSI outside the upper/lower deviation as well as being outside the typical oversold/overbought levels.
Any feedback is welcome! I try to employ contrasting colors, but they may not make sense to you so change them as you please - they are simply markers.

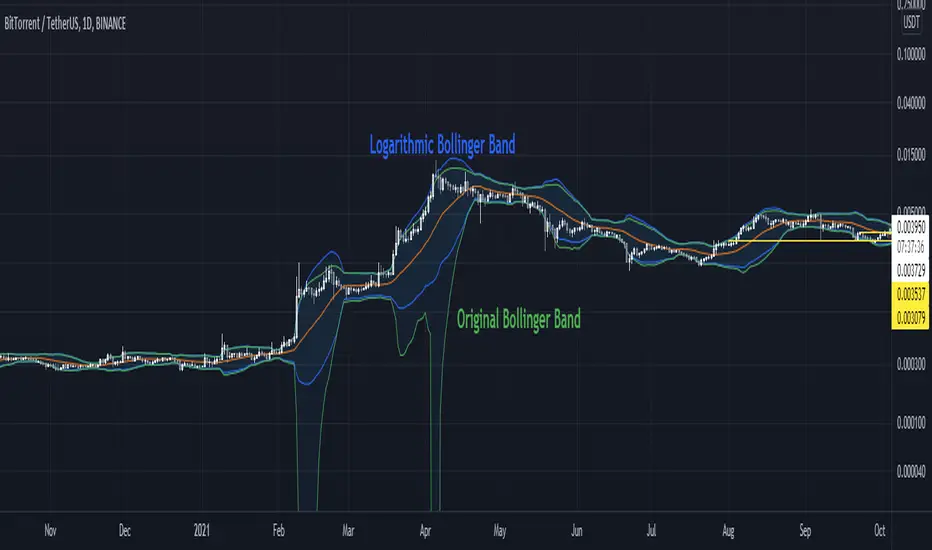
Logarithmic Bollinger BandsThe existing Bollinger Bands simply used price to derive the standard deviation.
In other words, whether an asset goes up or down by $50 from $100, it counts at the same "50$".
But in the asset market, an increase of $50 and a fall of $50 have different values.
To eliminate this difference using a logarithmic function, a new Bollinger Band was created.
Green is the original Bollinger Band.
As mentioned above, a sharp lower band is formed by calculating the rise and fall of an asset with the same value.
Blue is the Logarithmic Bollinger band.
Please make this indicator useful!
기존의 볼린저 밴드는 단순하게 가격을 이용해 표준편차를 도출해내었습니다.
즉 자산이 100$에서 50$이 오르든 내리든 같은 "50$"로 계산한 것입니다.
하지만 자산시장에서 50$이 오르는 것과 50$이 내리는 것은 다른 가치를 가집니다.
이 차이를 로그함수를 이용해 없애보고자 하였고, 새로운 볼린저밴드를 만들었습니다.
초록색이 기존의 볼린저밴드입니다.
위에서 말했듯이 자산의 오르내림을 같은 가치로 계산해서 급격한 아래 밴드가 형성됩니다.
파란색이 로그 볼린저밴드입니다.
이 지표를 유용하게 사용해주세요!
BB+RSI+EMA BUY/SELL SignalsBINANCE:BTCUSDT
* * * TESTED ON BTCUSDT 4H CHART * * *
The indicator gives signals based on candles touching BB lines and RSI oversold/overbought conditions, also a 200 EMA filter is used to trade following the major trend.
Only LONG signals are given.
Signals are divided in 3 categories based on their strenght:
- Weak BUY/SELL (green/red circles on chart)
- normal BUY/SELL (green/red triangles with "BUY" or "SELL" text on chart)
- strong BUY/SELL (green/red labels with "STRONG BUY" or "STRONG SELL" text on chart)
You can use signals from the same category as triggers for entering or exiting a trade or you can try using signals from different categories
All indicators settings can be costumized
Every signal label can be turned ON/OFF
EMA that changes color based on last candle close can be turned ON/OFF
Alerts can be set for:
- General Signals (every signal will trigger it)
- Weak Signals (only weak signals will trigger it)
- Normal Signals (only normal signals will trigger it)
- Strong Signals (only strong signals will trigger it)

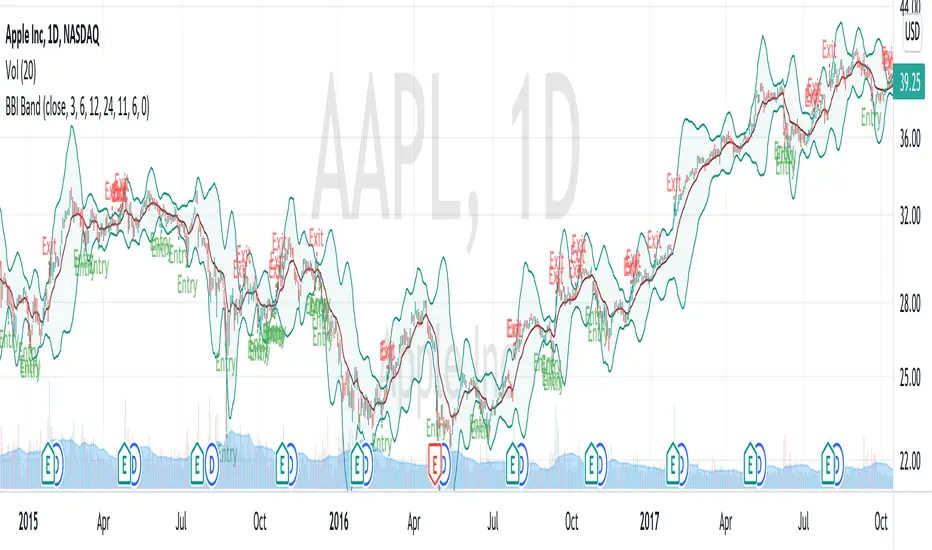
BBI Bollinger BandsBBI (Bull and Bear Index) is an indicator aims on measuring the general short/mid-term (< 1 month) trend and sentiment of the stock/market. It used an average of 4 SMAs (3, 6, 12, 24) as a cut-off of a bullish/bearish trend. In general, YMMV, you can enter when close> BBI and exit when close
Stochastic RSI Heat Bollinger BandsThis indicator is based on a combination of the famous Bollinger Bands and the Stochastic RSI indicator.
Bands are dynamically colored (and filled) with a RGB color composed by red and green values, directly generated from the average Stochastic RSI current value.
By default, colors represent the following status -> green zone is overgought & red zone is oversold.
A screener is also displayed on the chart, representing StochRSI K and D lines values, RSI value, as well as the current status (Overbought/Oversold) of the StochRSI and RSI indicators.
Notes:
The heat color and the screener status are both based on the average value between the K and D lines (for stochastic RSI based heat)
Bands can be disabled in options to use this indicator as a simple moving average colored by the Stochastic RSI heat color.
Options:
Various moving average types (SMA, EMA, SMMA, VWMA...)
Inversion of colors between overbought and oversold status
Enabling/disabling heat color on bands / basis line and bands background color
Show/Hide the screener
Color source can be modified to base the heat on the RSI instead of the Stochastic RSI value
Standards Bollinger bands, Stochastic and RSI parameters
Example
Feel free to suggest any improvements in comment.

Bollinger bands dynamic alertsThis triple Bollinger script is very useful for options traders to determine the trend condition. When the trend stays within 1 sigma limits it is termed as "congestion", breakout of congestion starts the "trending" phase and the big breakout termed "Blowout" happens when the underlying crosses the 2sigma and reaches 3 sigma limits in very short time at steep trend angles. The script provides dynamic alerts as soon as the underlying breaks out of these zones and enables options traders to stay in the trade longer. www.tradingview.com

EXAMPLES:enhanced_taThis script is created to demonstrate usage of enhanced ta library which is present here :
Following custom indicators are populated in this script:
ma (Select moving average)
atr/atrpercent (With custom moving average)
bands - Bollinger Band, Keltner Channel, Donchian Channel (All with enhanced versions and additional options)
bandwidth - Bandwidth for the bands available. Uses same input as that of bands
bandpercent - Percentage in relation to band upper and lower levels. Uses same input as that of bands.
oscillator (oscillatorRange) - Generating custom overbought oversold regions.
Display Options
Display individual indicator by selecting them through dropdown. If you select all, we also look at overlay and non-overlay parameters to show/hide only those indicators which are applicable on candle overlay or as separate window.

RSI OBLIVION This is a powerful tool if combined with other parameters. It's an advanced version of an RSI .
It shows OB and OS conditions and price direction or shift of the trend.
This indicator can be used in various ways with all markets.
The current settings are designed to work with futures market.
Combined with our TSI and Price action, RSI OBLIVION is the most reliable KPI out there.
Reached out to us for assistance.

Moving Average Band - Taylor V1A Very Simple Strategy From Moving Average
- Price Breakout Upper Band = Long
- Price Breakout Lower Band = Short
Moving Average Type = Able to Change RMA, EMA, SMA, WMA
Moving Average Period = Able to Change
Upper Band & Lower Band Gap = Able to Change
With Stop Lose & Take Profit = Able to Change

Take Profit On Trend (by BHD_Trade_Bot)The purpose of strategy is to detect long-term uptrend and short-term downtrend so that you can easy to take profit.
The strategy also using BHD unit to detect how big you win and lose, so that you can use this strategy for all coins without worry about it have different percentage of price change.
ENTRY
The buy order is placed on assets that have long-term uptrend and short-term downtrend:
- Long-term uptrend condition: ema200 is going up (rsi200 greater than 51)
- Short-term downtrend condition: 2 last candles are down price (use candlestick for less delay)
CLOSE
The sell order is placed when take profit or stop loss:
- Take profit: price increase 1 BHD unit
- Stop loss: price decrease 2 BHD units
The strategy use $15 and trading fee is 0.1% for each order. So that, in the real-life, if you are using trade bot, it will need $1500 for trading 100 coins at the same time.
Pro tip : The 1-hour time frame for altcoin/USDT has the best results on average.

7 Moving Averages [Plus]Moving Averages are price based, lagging (or reactive) indicators that display the average price of a security over a set period of time. A Moving Average is a good way to gauge momentum as well as to confirm trends, and define areas of support and resistance. Essentially, Moving Averages smooth out the “noise” when trying to interpret charts. Noise is made up of fluctuations of both price and volume. Because a Moving Average is a lagging indicator and reacts to events that have already happened, it is not used as a predictive indicator but as an interpretive one for confirmations and analysis.
Bollinger Bands (BB) are a widely popular technical analysis instrument created by John Bollinger. The BB consist of a band of three lines which are plotted in relation to security prices. The line in the middle is usually a Simple Moving Average (SMA) set to a period of 20 days (the type of trend line and period can be changed by the trader; however a 20 day moving average is by far the most popular). The SMA then serves as a base for the Upper and Lower Bands which are used as a way to measure volatility by observing the relationship between the Bands and price. Typically the Upper and Lower Bands are set to two standard deviations away from the SMA (The Middle Line); however the number of standard deviations can also be adjusted by the trader.
This script shows 6 moving averages and Bollinger Bands.
Features:
- Standard MA inputs.
- MA type.
- MA period.
- MA source.
- MA resolution (time frame).
- MA Offset.
- Forecasting : forcasted prices are calculated using our MAType and MASource for the MAPeriod.
- Trail: Show only candles not included in the MA calculation.
The color of MA1 depends on the chosen strategy, by default this is the 3EMA strategy. You can also select "Pivot Point Supertrend" or "Ichimoku Trend"
Added "Parabolic Stop and Reverse (PSAR)" . The PSAR is a time and price technical analysis tool primarily used to identify points of potential stops and reverses. In fact, the SAR in Parabolic SAR stands for "Stop and Reverse". The indicator's calculations create a parabola which is located below price during a Bullish Trend and above Price during a Bearish Trend.
Added "Linear Regression Channel" which can be correctly plotted on logarithmic charts. A linear regression channel consists of a median line with 2 parallel lines, above and below it, at the same distance. Those lines can be seen as support and resistance. The median line is calculated based on linear regression of the closing prices but the source can also be set to open, high or low. The height of the channel is based on the deviation of price to the median line. Extrapolating the channel forward can help to provide a bias and to find trading opportunities.

MACD + BB + RSI Strategy [Alorse]A very simple and highly effective strategy that combines 3 famous indicators:
MACD
Bollinger Bands
RSI
Entry conditions are:
The MACD line crosses over the signal line.
RSI less than 50
Price below the BB baseline
Exit conditions are:
RSI greater than 70
Closing price higher than the upper BB
Or when the price hits the Stop Loss defined by you (Feature).

Bollinger Bands With User Selectable MABollinger Bands with user selection options to calculate the moving average basis and bands from a variety of different moving averages.
The user selects their choice of moving average, and the bands automatically adjust. The user may select a MA that reacts faster to volatility or slower/smoother.
Added additional options to color the bands or basis based on the current trend and alternate candle colors for band touches. Options:
REACT SLOW/SMOOTH TO VOLATILITY
simple moving average (Regular Bollinger Bands)
REACT SMOOTH TO VOLATILITY
exponential moving average (EMA Bollinger Bands)
weighted moving average (Weighted MA Bollinger Bands)
exponential hull moving average (Hull Bollinger Bands with better smoothing)
HIGHLY ADJUSTABLE TO VOLATILITY
Arnaud Legoux Moving average (ALMA Bollinger Bands)
Note: 0.85 ALMA default for more smoothing, set offset=1 to turn off smoothing
REACT HARSH TO VOLATILITY
least squares moving average (Least Squares Bollinger Bands)
REACT VERY FAST TO VOLATILITY
hull moving average (Hull Bollinger Bands or Hullinger Bands)
VALUE ADDED: This script is unique in that no other Bollinger Bands indicator offers a user selection for moving average, and some of the options do not exist yet as Bollinger Bands indicators.
Definitions:
Bollinger Bands: A Bollinger Band® is a technical analysis tool defined by a set of trendlines plotted two standard deviations (positively and negatively) away from a simple moving average (SMA) of a security's price, but which can be adjusted to user preferences.
Exponential Bollinger Bands: The most important characteristics of the Exponential Bollinger Bands indicator are: When the market is flat, the bands will stay much closer to prices. When the volatility is high, the bands move away from prices faster.
Hull Bollinger Bands: Bollinger Bands calculated by Hull moving average, rather than simple moving average or ema. The Hull Moving Average (HMA), developed by Alan Hull, is an extremely fast and smooth moving average. In fact, the HMA almost eliminates lag altogether and manages to improve smoothing at the same time.
Exponential Hull Bollinger Bands: Bollinger Bands calculated by Exponential Hull moving average, rather than simple moving average or ema. The Exponential Hull Moving Average is similar to the standard Hull MA, but with superior smoothing. The standard Hull Moving Average is derived from the weighted moving average (WMA). As other moving average built from weighted moving averages it has a tendency to exaggerate price movement.
Weighted Moving Average Bollinger Bands: A Weighted Moving Average (WMA) is similar to the simple moving average (SMA), except the WMA adds significance to more recent data points.
Arnaud Legoux Moving Average Bollinger Bands: ALMA removes small price fluctuations and enhances the trend by applying a moving average twice, once from left to right, and once from right to left. At the end of this process the phase shift (price lag) commonly associated with moving averages is significantly reduced. Zero-phase digital filtering reduces noise in the signal. Conventional filtering reduces noise in the signal, but adds a delay.
Least Squares Bollinger Bands: The indicator is based on sum of least squares method to find a straight line that best fits data for the selected period. The end point of the line is plotted and the process is repeated on each succeeding period.

RSI Rising Crypto Trending StrategyThis is crypto and stock market trending strategy designed for long timeframes such as 4h+
From my tests it looks like it works better to trade crypto against crypto than trading against fiat.
Indicators used:
RSI for rising/falling of the trend
BB sidemarket
ROC sidemarket
Rules for entry
For long: RSI values are rising, and bb and roc tells us we are not in a sidemarket
For long: RSI values are falling, and bb and roc tells us we are not in a sidemarket
Rules for exit
We exit when we receive an opposite direction.
Cuation: Because this strategy uses no risk management, I recommend you takje care with it.
If you have any questions, let me know !

Berzerker IndexSome pairs have their own distinct behavior. That includes volatility, news reactiveness, trend x chop day discrepancy, and other qualities.
At first, I tried to measure this with the Choppiness Index, but it looks pretty much alike when you compare symbols like EURNZD and GBPCAD, but my testing shows some major behavioral differences between the two. Hence, I decided to build my own measurement which I later decided to call Berzerker Index.
• The calculation takes the previous value and adds 1, 3, 7, or 15 depending on how many standard deviations the price beats.
• Deviations use Jurik Moving Average as a central line. If there is no new penetration, the total value will not be increased.
• At the end of the value update, the result will decay whether it is changed or not. The readings decay significantly faster if the price is between the bands.
• The beginning of the calculation is the beginning of the chart. There isn't any period for the calculation.
As you can see, from the beginning of the year, the maximum readings on EURNZD are 49.8 and 73.6 for GBPCAD. This is what I wanted to achieve - find some way to clearly differentiate the pairs. Later, I went on EURUSD to confirm the results. EURUSD should be a calmer pair and it shows 33.5 which supports the theory.
The symbols with small bars and explosions on events and bank meetings will reach high values, whereas those that are more predictable with less extreme movements will be found below 45.
Lastly, you may identify long periods of continuous descend on the indicator as setting up for a large explosion. This is not the original idea but could work nevertheless.
Of course, I will further update this indicator if I get improvement ideas...
FAQ:
► Does this repaint?
• No.
► Where is the buy signal?
• There isn't one. The purpose is to study repeated behavioral patterns of different symbols, not to drink from the holy grail.
► Why is it called the 'Berzerker' Index?
• I don't know.
I used @everget's version of Jurik's Moving Average with his consent.
What do ya thing?

RSI in Bollinger bandsI added Bolinger bands to the RSI indicator.
This shows you the area of reversal for the RSI. Generally, when the indicator falls out of the bands, you'll see a quick reversal. Indeed this is a better way to find the overbought and oversold areas.
