[kai]Keltner&BolingerIt is an indicator that simultaneously displays the Bollinger Bands (BB) and Keltner Channel (KC) calculated for the log scale.
* If you need the normal scale version, please turn off the log mode in the settings.
I think the usage is the same as normal BB and KC.
From here, it ’s an original way of thinking.
I thought about countermeasures for the phenomenon that the BB contracts (squeezes) and breaks, but for some reason it suddenly reverses and breaks greatly in the opposite direction or ends in misfire.
The main part of this Inge is KC, and I think that the range within KC is the range.
Considering that the bar broke above and below the range of KC and broke, the trend market started.
BB fits in KC and judges that the trend is game over
If it is within KC, it is contrarian at the upper and lower limits of KC.
If it breaks, Trend following
Profit if BB fits in KC
I'm thinking about how to use it
ログスケール用にログ計算したボリンジャーバンド(BB)とケルトナーチャンネル(KC)を同時に表示するインジケーターです
※通常スケール版が必要な時は設定のlog modeをOFFにしてください
使い方は普通のBBとKCとおなじで使用方法で良いと思います
ここからはオリジナルな使い方の考え方です
BBが収縮(スクイーズ)してブレイクしたのに何故か突然反転して反対の方に大きくブレイクしたり、不発に終わったりする現象の対策を考えました
このインジのメインはKCでKCの範囲内はレンジと考えます
KCの範囲外にバーが上抜け、下抜けして、ブレイクしたと考え、トレンド相場スタートとします
BBがKCの中に納まってトレンド終了と判定します
KC内の場合はKCの上限、下限で逆張り
ブレイクした場合は順張り
BBがKCの中に納まったら利確
という感じの使い方を考えています
Cari dalam skrip untuk "bollingerband"

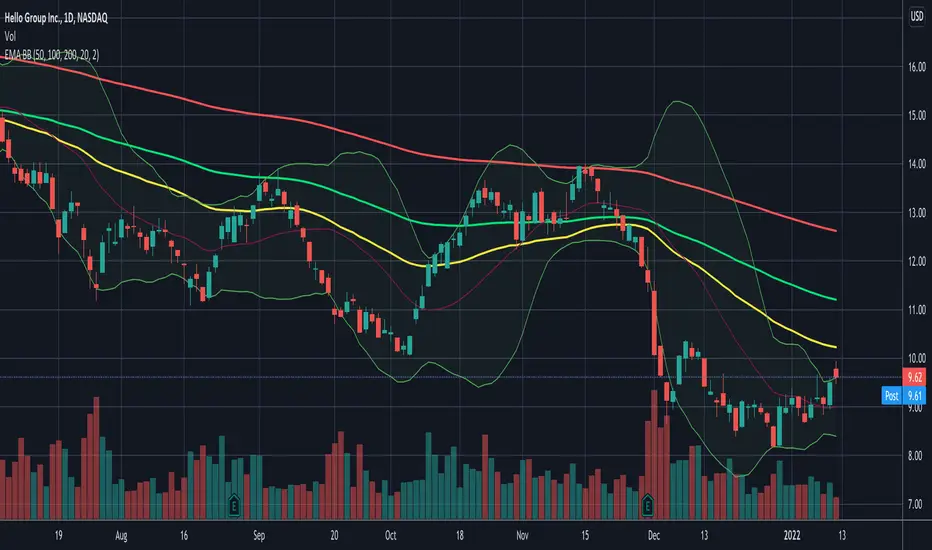
Daily EMA50 100 200 + BBStandard Bollinger Bands (timeframe dependent), period and standard deviation are configurable.
And standard daily triple EMA (timeframe independent). Short, Medium and Long periods are configurable (50/100/200 by default)
CRC.i Bollinger Bands ®This script is yet another variant of the famous Bollinger Bands® TA tool used to track price volatility as it deviates from the mean of a security using standard deviations (positive &negative). Built for my own personal preferences. But perhaps you might like it, too.
Includes
+ Chart Lines: price, upper and lower bands
+ User Options: SMA length, stdev value
+ Heads up Display (HUD) with TARGET's and other related stats
Bugs? Comments? Requests? Ping me @calmrat

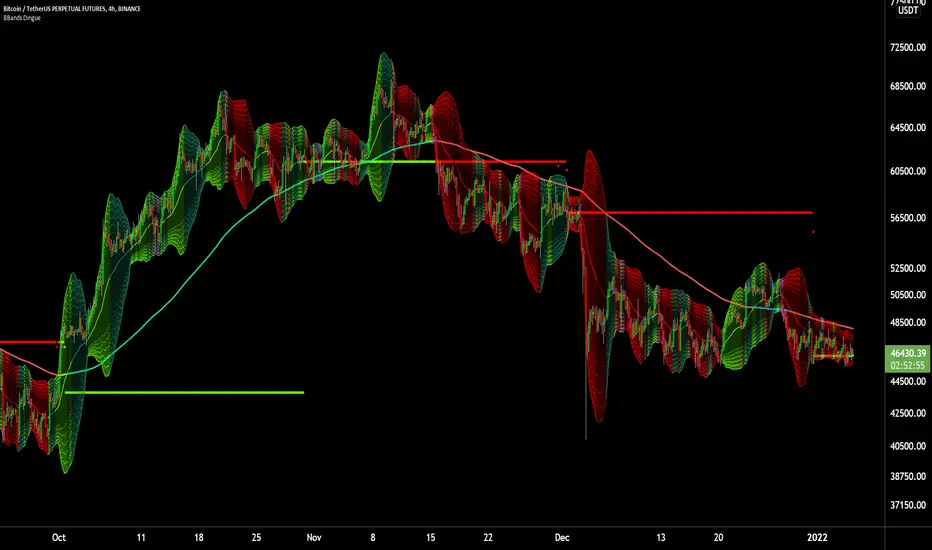
6X Bollinger Bands + MA + VWAP Dingue V56X Bollinger Bands Dingue V5 - This is the updated version for Pine Script 5
This indicator lets you quickly see all the intricacies of the Bollinger Bands; it simplifies its usage and maximizes the results.
Color-coded if the price is above or under the middle and based on direction.
Color-coded for expansion and contraction of the bands.
Option to plot ‘Squeezed bands’. It will show above the bands when they become smaller than the setting chosen. This helps identify build-up that might explode one way or another.
- 6x independent Bands can be adjusted as you want. It gives you possibilities in how you see variance, trends, support and resistance.
You can also select the MA type: SMA EMA WMA VWAM FRAMA … to explore new ways to see the Bollinger bands.
New in this version, you can now add a separate ‘Long MA’ that you can select independently from the Bands. Ex. Plot 200 SMA This helps in building a strategy with the trend and the bands.
Like the MA above, you can also plot 2 different VWAP independently from the Bands. This also helps knowing where the price stands compared to the bigger time frame VWAP’s price.
'Tool tips' explain other settings, if you have any questions, feel free to ask in the comments below.
Thank you for the feedback and check all my ‘Dingue’ indicators.
EMA/MA Cross + BB + Alerts Short hand notes - I made this for friend and I. Unsure how to share it with him so made it public.
u/ tmyerskerry for the math on slope and look back period (look back period isn't perfect for slope calculation as 200ma is slow moving so some signals are goign to be strong instead of weak and visa versa. If you know a better way than i'm all ears!
Can set mutliple EMA's and MA's.
Default BB built in. Couldn't figure out how to set default shadow transparency so you will have to turn it down.
Added red and green lines that indicate when price has gone above and below the BB shadow.
Added arrows for when EMA1 crosses EMA2. Right now set for 9 + 32. And depending on MA200 color changes if its with the trend or against.
Alerts in the works. (please don't ask for them as i'm doing this part time and don't know pinescript)

Volatility Funnel v2Using the contracting phase of what are basically bollinger bands and some fancy coloring, this indicator draws funnels to which show tightening ranges and doesn't take up too much screen space unless you want it to.
There is a smoothing option if you're into that.
Enjoy!!!

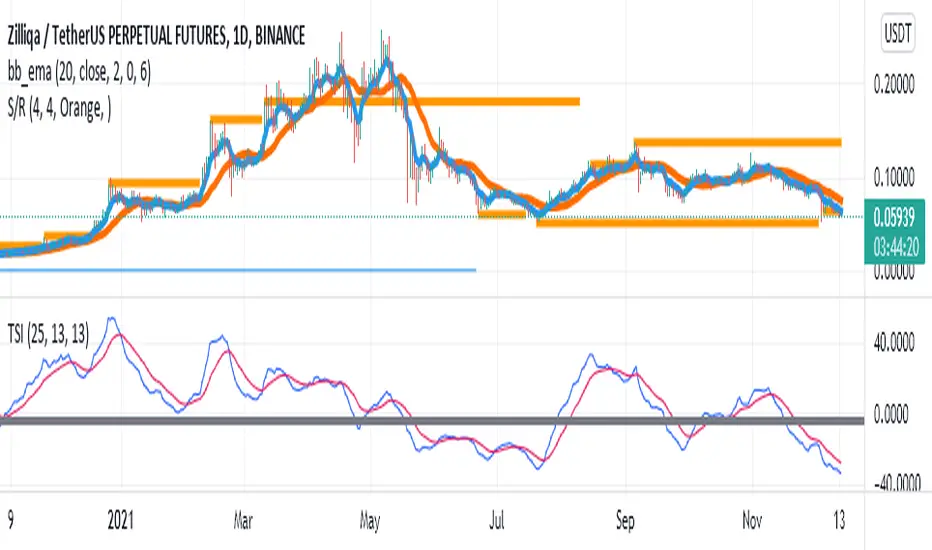
bb_ema_hamedtarkib bb and ema hasttarkib bb and ema hast
tarkib bb and ema hast
tarkib bb and ema hast
tarkib bb and ema hast
tarkib bb and ema hast
tarkib bb and ema hast
tarkib bb and ema hast
tarkib bb and ema hast
tarkib bb and ema hast
tarkib bb and ema hast
tarkib bb and ema hast
tarkib bb and ema hast
tarkib bb and ema hast
Pluto Star - Bollinger Band Trap//DESCRIPTION
//Pluto star appears on a chart when price goes in the in the extreme price range territory, i.e. beyond 2 standard deviation from the mean (or mid Bollinger Band).
//What makes a Pluto Star appear on a chart:
//1. Check if the candle 's' high and low, both are completely outside of the Bollinger Bands (close, 20, 2) - Lets call it Pluto Star Candle
//2. Pluto Star Candle must not be a result of sudden price movement. Hence the previous candle must give a BB Blast.
// In other words, the candle must have it's either open or close outside of Bollinger Bands, to confirm a BB Blast before the Pluto Star
//3. Candle, following the Pluto Star must not break the high (in case of upper BB i.e. short call) or low (in case of lower BB, i.e. long call), to confirm the reversal to the mean
// This implies that Pluto Star appears on chart, above/below the next candle of actual Pluto Star Candle
//----- The above 3 conditions make a Pluto Star appear on a chart. But one must wait for a trade signal. Read the following conditions
//4. There is a signal line, which is nothing but ema(close,5)
//5. The red dotted line is the signal range (and also acts as Stop Loss). The price must close above/below the signal line within the signal range
//6. For a red Pluto Star (short call), the price must close below the signal line, within next 6 candles (signal range). Else there is no trigger for a trade
//7. For a green Pluto Star (long call), the price must close above the signal line, within next 6 candles (signal range). Else there is no trigger for a trade
//8. If any of the candle crosses the Stop Loss line within signal range, there is no trigger for a trade
//9. In a normal scenario, the price must return to the mean, i.e. mid Bollinger Band. In best case scenario, it must go to the opposite side Bollinger Band.
//Recommendation: Test it with Nifty and Bank Nifty charts on 30 mins and 1 hour timeframes

Pin Bar//Pin Bar at the edge of BB
//Conditions to check
// 1. It must be a Pin Bar
// 2. Price Above/Below 200 SMA
// 3. Volume must be above 20 SMA
// 4. Low/High of the Pin Bar must cut across the BB upper/lower band
// 5. The very next candle closes above/below the high/low of the pin bar candle
Recommended timeframe - Daily and Weekly

IDEAL BB with MA (With Alerts)It gives well combination of Moving average and Bollinger bands with signals

BBW EMA RIBBON+BB%B+EMA BUY/SELL SignalsBINANCE:BTCUSDT
* * * TESTED ON BTCUSDT 4H CHART * * *
The indicator gives signals based on possible ENTRY/EXIT zones (calculated using an ema ribbon of the BBW) and BB%B oversold/overbought conditions, also a 200 EMA filter is used to trade following the major trend.
ENTRY/EXIT zones can be used as a confirmation on other strategies (green zones suggest a possible entry for a long in an uptrend and for a short in a downtrend, red zones suggest a possible exit for long & short)
Only LONG signals are given.
Signals are divided in 3 categories based on their strenght:
- Weak BUY/SELL (green/red circles on chart)
- normal BUY/SELL (green/red triangles with "BUY" or "SELL" text on chart)
- strong BUY/SELL (green/red labels with "STRONG BUY" or "STRONG SELL" text on chart)
You can use signals from the same category as triggers for entering or exiting a trade or you can try using signals from different categories
All indicators settings can be costumized
Possible EXTRY/EXIT zones can be turned ON/OFF
Every signal label can be turned ON/OFF
EMA that changes color based on last candle close can be turned ON/OFF
Alerts can be set for:
- General Signals (every signal will trigger it)
- Weak Signals (only weak signals will trigger it)
- Normal Signals (only normal signals will trigger it)
- Strong Signals (only strong signals will trigger it)
There are 3 BB%B Oversold & 3 BB%B Overbought value presets:
- BASIC (default values)
- LOW (slightly lower values from default)
- HIGH (slightly higher values from default)
Tips:
Use BB%B OS LOW preset to find entries at a better price
Use BB%B OS HIGH preset to find entries faster
Use BB%B OB LOW preset to find exits faster
Use BB%B OB HIGH preset to find exits at a better price
There are 3 Filters already included:
- A checkbox to toggle ON/OFF the use of Heikin Ashi candels to detect trades
- A checkbox to toggle ON/OFF the use of an ema filter for the ribbon that tries to reduce the number of false signals on over-extended price movements
- A checkbox to toggle ON/OFF the use of an ema filter that tries to reduce the number of false signals when price crosses the moving average many times consecutively

Bollinger bands and Keltner bands
█ OVERVIEW
This is a Bollinger band Script, with Keltner Channel Bands and for scalping.
█ CONCEPTS
1 — Bollinger Bands, The Bollinger band component is make out from two part, the standard component represented by a white cloud.
This is the 2nd deviation and 3rd deviation filled.
The second part linear weight
This is the 2nd deviation, and is filled from the 3rd deviation from the standard bands. This give the effect of cutting in and out to proved a support and resistance cloud.
2 — Keltner bands, this is the normal calculation, nothing special, by default this is off and can be turned back on in styles.
3 Deviations with ALMA as the Basis
3 — Non-traditional basis
Like with you can change the base moving average
but to a lesser extent.
option are:
sma = Simple Moving Average
ema = Exponential Moving Average
wma = Weighted Moving Average
vwma = Volume Weighted Moving Average
rma = Running Moving Average
alma = Arnaud Legoux Moving Average
hma = Hull Moving Average
█ OTHER SECTIONS
• LIMITATIONS: again this is base on moving average so there is a lag factor, the cloud do not work without volume so if the indicator can not pull volume data you are left with the standard bands.
• NOTE this is a trimmed version of still functions the same.
• THANKS: rumpypumpydumpy for the inspiration

Asian Session Bollinger BandsThis is a fairly simple adjustment of the Bollinger Bands highlighting and giving the character to the Asian session.

[KL] Double Bollinger Bands Strategy (for Crypto/FOREX)This strategy uses a setup consisting of two Bollinger Bands based on the 20 period 20-SMA +/-
(a) upper/lower bands of two standard deviations apart, and
(b) upper/lower bands of one standard deviation apart.
We consider price at +/- one standard deviation apart from 20-SMA as the "Neutral Zone".
If price closes above Neutral Zone after a period of consolidation, then it's an opportunity for entry. Strategy will long, anticipating for breakout.
The illustration below shows price closing above the Neutral Zone after a period of consolidation.
a.c-dn.net
Position is exited when prices closes at Neutral Zone (being lower than prior bars)

Forex Scalping 1min Bollinger Bands, RSI and ADX Trading SystemThis is a Forex Scalping Trading Sytem based on the Bollinger Bands.
Its suited for major pairs, with lowest possible comission (below 1 pip) and with timeframes ranging between 1-15 min.
Indicators:
Bollinger bands
ADX
RSI
Rules for entry:
Long Entry: price to move below the upper Bollinger Bands RSI raise above the 30 line and ADX<32 at the same time.
Short Entry: price to move above the upper Bollinger Bands, RSI raise below the 70 line and ADX<32 at the same time.
Rules for exit
Profit Exit: 3 options: 1, exit position when the price touches the middle band, 2) when the price touches the opposite band, X pips target profit.
Loss Exit: X pips loss

Pump blaster based on Pump FinderThis is based on a video I watched while searching for good indicators to use for scanning pumps across the crypto market.
You can probably find the video by searching for "Pump Finder On 15 Minute Chart With Best Trading Indicators".
The approach presented uses LSMA and BB B% to detect pumps.
Results:
It does detect many pumps, it also detects many dumps...
I'm not very impressed after this first attempt but might give it another try if I come up with maybe something I'm doing wrong while trying to automate in a script the original strategy from the video.
Instructions:
This indicator is compatible with the backtest script we use.
It plots 1 for buy and 2 for sell. The rest of the plots are for debugging the strategy and can be ignored.
It's meant to be used on 15mins tf

Improved Bollinger Swing Strategy Stock NasdaqThis is an improved bollinger band strategy adapted to Nasdaq Index/Stocks.
The new update include a multiple logic calculation BB adapted for long and short, together with a risk management using movement in %.
Rules for entry
For long we have a crossover between the close and the lower band from the bb
For long we have a crossover between the close and the upper band from the bb
Rules for exit
We exit when we either find a reverse condition, or if we hit the take profit/stop loss levels.
If you have any questions, let me know !

Bollinger bands + EMAI discovered a video on YouTube which was published on Jan 22, 2021. I just coded on TradingView. It's performing better in smaller TimeFrames (1m, 5m, ...).
How does it work? How to use?
This is based on Bollinger Bands and Exponential Moving Average. The logic is so simple: It will wait until the a candle starts to poke out of the BB. When it figures out a price outside the band, it will be altered for next candle. If the next candle close back inside the band, it will be marked with a up triangle (for long positions) or down triangle (for short positions). The take profit level would be the Exponential Moving Average.
It can be used as a confirmation alongside other techno fundamental tools and analysis.
P.S. As it's prohibited by community rules to link to outside, while it seems to be a kind of advertisement, I cannot share the link to the video. Cheers to those creative and kind YouTubers!

Multiband Oscillator - Zigzag versionJust variation of Multi Band oscillator present here: Multi-Band-Channel-Oversold-Overbought-Oscillator
Changes are:
Instead of regular moving average, here I am using Zigzag Moving average. This is calculated in similar to as explained in: Zigzag-Cloud
Instead of ATR, using AZR (Average Zigzag Range) - Average-Zigzag-Range-AZR
Rest of the logic remains same.
Number of bands used 100 - which means, calculate 100 Bollinger bands with Std Dev Multiplier starting from 0.1 and with step 0.1 for the next one.
Which divides price ranges into 200 equal parts. Calculate what is the current range and plot them.
Overbought - Oversold levels are dynamics. They are dependent on the max and min state price has reached in last 80 days. Offset and factor can be used to adjust overbought oversold levels.

Zigzag CloudThis is Bollinger Band built on top of Zigzags instead of regular price + something more.
Indicator presents 7 lines and cloud around it. This can be used to visualize how low or high price is with respect to its past movement.
Middle line is moving average of last N zigzag pivots
Lines adjacent to moving average are also moving averages. But, they are made of only pivot highs and pivot lows. Means, line above moving average is pivot high moving average and line below moving average is pivot low moving average.
Lines after pivot high/low moving averages are upper and lower bolllinger bands based on Moving Average Line with 2 standard deviation difference.
Outermost lines are bollinger band top of Moving average pivot high and bollinger band bottom of moving average pivot low.

BB-Pivots-GANN-Levels-stockInshotHello everyone,
With help of open source WD gann codes, i combined this study with Bollinger band with entry & exit conditions.
For stock Selection you way chose fixed stock list .
These levels has been derived from daily WD GANN Astro Levels.
=== Rules ===
Long Entry Condition : Price must be above resistance line with Bollinger band blast will be the best entry . You may take the target with the help of this study.
Stop loss can be same candle low
Short Entry Condition : Price must be below support line with Bollinger band blast will be the best entry . You may take the target with the help of this study.
Stop loss can be same candle High
Please calculate the Risk Reward with the Future Target Price & Stop loss levels.
No Trading Zone Rules -
If price is in middle of support & Resistance .one way avoid such trades as it has been observed ,That most of the time stock goes sideways.
===Rules End ===
study has been kept open source for the understanding the concept.
Do your own Research with this study for better understanding with your trading style

Bollinger bands volume support&resistance multi timeframe [LM]Hello traders,
I would like to introduce you Bollinger bands volume support&resistance multi timeframe script. The benchmark is the Upper Bollinger Band applied on volume with a look-back setting of 233 and a displacement of 3 standard deviations.
(There’s nothing magical about the setting of 233, but you should use a long-term parameter so that you get a stable Bollinger Band. Short-term parameters tend to produce erratic bands.)
If a price bar shows volume that exceeds this benchmark, we will zoom in and use it as potential support or resistance area in our price analysis. if there is only one candle that will crossover and cross under than only high and lo of that candle is counting. If there are more consecutive bars that are above upper bollinger band than the range high and lo is calculated from high and lows of that candle
As you can see on the image high and low is only rendered when volume crossover and cross under bollinger bands
I hope you will enjoy it

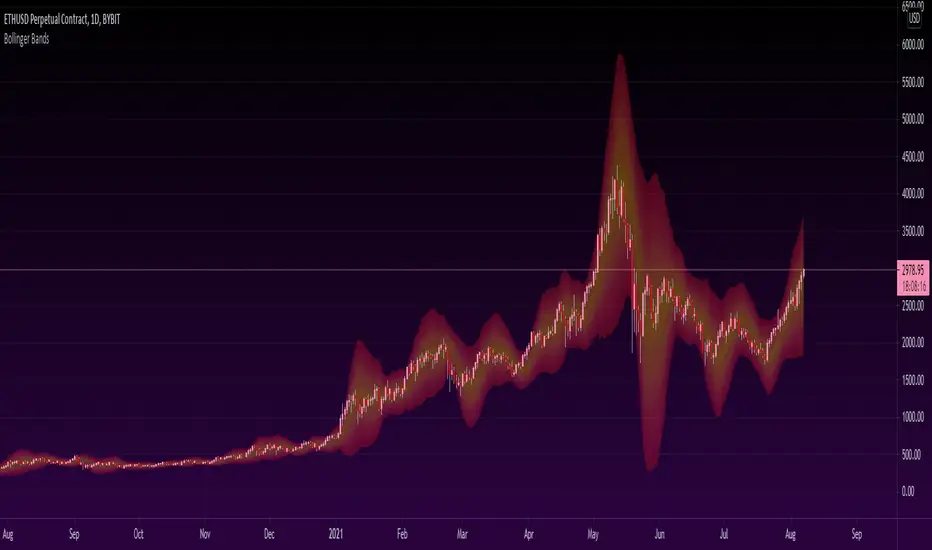
Heatmapped Bollinger BandsBollinger Bands have been used for many years to determine the volatility and potential reversal area of markets. This script takes standard Bollinger Bands (BB) and transforms it into a heatmap of reversal areas.
A basic explanation on how this indicator works is:
- Yellow is where the price likes to stay,
- Orange is where the price might begin to reverse in a weak trend, and
- Red is where the price will either pause to let the yellow range catch up, or where the price will jump back down into the yellow range to stabilize.
For educational purposes: this script is essentially just taking the standard method of creating Bollinger Bands (seen in the 'Main Lines' portion of the script), coloring the plots 'na' so that they aren't seen, and using the 'fill' function to plot the yellow to red rainbow up to the top. I believe I made the yellow range 0.2*stdev to 1*stdev, the orange range 1*stdev to 2*stdev, and the red range 2*stdev to 3*stdev. You can get the hex code rainbow from any website that has a color slider.
** Disclaimer: THIS IS NOT TRADING ADVICE. Bollinger Bands should be used in conjunction with other indicators to make better decisions but NO STRATEGY IS PERFECT. Always backtest any strategy before using it live. **