MACD with Support and Resistance - Signals, Alerts, TP and SLMACD with Support and Resistance - Signals Alerts SL and TP by Tech Store On
The script uses MACD for entering/exiting trades and support/resistance lines to take TP1 (take profit 1). Both MACD and support/resistance lines are fully configurable to your preference, and you can back-test it via TradingView. Once TP1 is taken, you can either set the indicator to close the trade at the end of the US trading session day (4PM ET) or you can continue taking partial profits where you wish or just wait until reversal signal alert.
For example: If you will be day trading SPY and you wish to close your positions no matter what right before the market closes (3:45PM ET > 15min before closes): Make sure to checkbox “Intraday – Close Position Before Market Closes” in the strategy/indicator Settings, so that you are alerted soon before the market closes, if you wish to continue holding the position – leave this checkbox unchecked.
SL: SL is set to be slightly above/below the MACD signal candle, which is best suited for this strategy from manual backtesting.
Strategy Take Profit Approach
While the initial position open and SL hit is always based on a closed candle bar (can’t do otherwise, as otherwise you will have 10s of fake signal alerts), there are 2 ways on trading this strategy in terms of TP1 / TP1 taken > back to Entry, which is based off Alert type.
You can switch this as you like within the indicator settings, “Checked: TP1/TP1 taken > back to Entry per Price Touch | Unchecked: per Candle Close”.
Candle Close vs Price Touch: with the Default method - Candle Close for an alert for TP1 or if price comes back to Entry after TP1 is taken will only be triggered once candle bar fully closes crossing the area, while Price Touch will alert when price touches the area before candle bar closes.
For example: your trade is running well, you grab TP1 and the price reverses and hits your trade Entry area. With Price Touch – you are immediately alerted to close your trade with no loss and with TP1 profit. With Candle Close - you will receive an alert only once candle bar fully closes on top of the Entry crossing it backwards, meaning it may lower your TP1 profit or even completely reverse the trade into loss in case it will be a huge candle bar for any reason. However, it may touch the Entry area, looking like the price is reversing, but then continue per initial trade direction, sometimes becoming a trend. So, while Price Touch seem like a more conservative approach, Candle Close can give you much bigger profits if you catch a trend, but you can always change it via the Settings.
Note: TradingView back-testing engine does not have a feature to open/close orders IMMEDIATELY via Price Touch trigger, but only when the candle closes after price touches the scripted area/line/etc., so you for the most accurate results, test your strategy out via Candle Close setting. Otherwise, decide yourself. I personally like more Candle Close since I can test it out via back-testing with the most accurate results.
Note: If you will be observing the strategy LIVE, during LIVE candle bar movement – it will look weird, like it’s placing an order after order during any trigger – this seem like a TradingView bug, but is only observational, once the candle bar is closed and you refresh TradingView it will all look correct.
Back-Testing
If you wish to do some back-testing, just modify the strategy/indicator Settings:
-----1) STRATEGY: This is for back-testing/experimenting with the script inputs.
----------a. You can setup a start date (date, month, year) from which it will start opening back-test trades, select a position size and select TP1 size, the idea here is to close half (or whatever you choose) portion of the trade once you hit your TP1, then to either close at small profit or to catch a trend and close the second portion of the position long way ahead from Entry, otherwise it will alert you to close the position if price comes back to Entry, at reversal signal or at the end of US trading session if the option for it is checked. If you wish to close the whole position at TP1, just enter the same amount for TP1 to match backtest position size. Otherwise you can experiment with TP1 sizing – try it out!
-----2) Feel free to experiment with MACD settings and with S&R Left/Right bars, you may be amazed how results will differ and find some really cool combinations!
-----3) Make sure you select/de-select “Intraday – Close Position Before Market Closes” setting depending on what you are back-testing and on which conditions
-----4) Note: If you wish to do some deep back-testing (1+ years), use the “Deep Backtesting” feature within Strategy Tester on the TradingView as otherwise it may show wrong results or even fail to compute the results
Add the alerts
-----Right-click anywhere on the TradingView chart
-----Click on Add alert
-----Condition: MACD with Support and Resistance - Signals
----------o Right underneath the condition click on the drop-down menu and select “alert() function calls only”
-----Expiration time: Whatever you wish
-----Alert actions: Whatever notifications you wish
-----Alert name: DO NOT TOUCH THIS
-----Hit “Create”
-----Note: If you change ANY Settings within the indicator – you must DELETE the current alert and create a new one per steps above, otherwise it will continue triggering alerts per old Settings!
- Note: If you add the alert while the script is currently “In Position” it will not know that. So either wait when there will be no position open at all or close your position partially if the bot opens it twice bigger or so in case per script the bot will think it is already in position.
Note: Because of the slippage and the order processing time between TradingView, AutoView and the Broker (it’s usually about a second or so), it is suggested to not use a timeframe lower than 1min. The script is working really well with 15M/H1 timeframes per my back-testing, but feel free to explore via Strategy Back-testing what’s best for the instrument you wish to trade.
Cari dalam skrip untuk "bot"

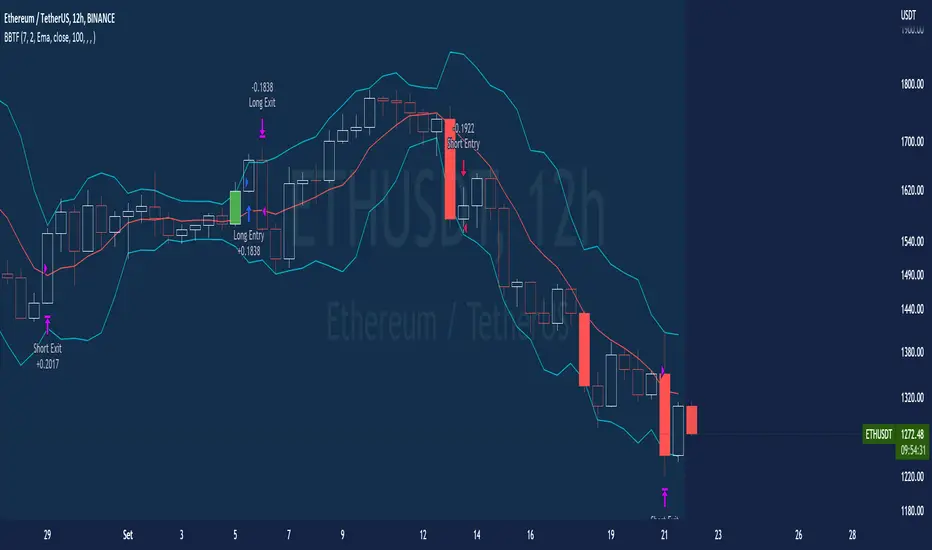
BT-Bollinger Bands - Trend FollowingEsse script foi criado para estudo de Backtest.
O script usa as Bandas de Bollinger para indicar o início de uma tendência, a entrada é configurada quando o preço abre abaixo e fecha acima da banda superior ou para venda quando o preço abre acima e fecha abaixo da banda inferior.
Não há um stop fixo e nem alvo fixo a saída se dá quando o preço toca a média da banda.
Você pode usar uma média móvel como filtro combinado com a estratégia.
O Script também pode ser usado com algum serviço de bot como 3commas.io , basta colocar as mensagens de entrada e saída para o bot.
Autor : Credsonb - Nick: M4TR1X_BR
Neste gráfico estou usando as seguintes configurações:
Bandas Bollinger: 7
Desvio Padrão: 1.5
Time Frame: 12hs
Ticker: ETH
This script was created for Backtest study.
script uses Bollinger Bands to indicate the start of a trend, entry is set when price opens below and closes above the upper band or for short when price opens above and closes below the lower band.
There is no fixed stop and no fixed target, the exit occurs when the price touches the average of the band.
You can use a moving average as a filter combined with the strategy.
The Script can also be used with some bot service like 3commas. io , just put the input and output messages to the bot.
Author : Credsonb - Nick: M4TR1X_BR
BT-SAR Ema, Squeeze, Volatility
Esse script foi criado para estudo de Backtest.
Ele usa o SAR PARABÓLICO como indicador de sinal de entrada, você também pode combinar 3 indicadores para filtrar as entradas: Média Móvel, Squeeze Momentum e Volatility Oscilator .
Existe duas entradas, quando o SAR Parabólico vira ou pelo Breakout (usando o último preço) do SAR Parabólico antes dele virar.
As Os filtros podem ser usados de forma combinada ou individual.
O Script também pode ser usado com algum serviço de bot como 3commas.io, basta colocar as mensagens de entrada e saída para o bot.
This script was created for Backtest study.
It uses PARABOLIC SAR as input signal indicator, you can also combine 3 indicators to filter inputs: Moving Average, Squeeze Momentum and Volatility Oscillator .
There are two entries, when the Parabolic SAR turns or by Breakout (using the last price) of the Parabolic SAR before it turns.
The Filters can be used in combination or individually.
The Script can also be used with some bot service like 3commas.io, just put the input and output messages to the bot.

Density & Step Grid Strategies BacktesterThis contains several signals for backtesting strategies only in binance futures assets.
HOW IT WORKS
Grid trading is a trading strategy where an investor creates a so-called "price grid". The basic idea of the strategy is to repeatedly buy at the pre-specified price and then wait for the price to rise above that level and then sell the position (and vice versa with shorting or hedging). We introduce 2 grids trading algorithms "Step" and "Density" .
FEATURES
Grid size: This algorithm has a max of 20 orders.
Take profit: The trader can increase or decrease the distance between the grids from the User Interface panel, is the the distance from average price.
Management: The algorithm distributes the capital for all orders depending on the amount fator, for example 1.1% of amount factor adds 10% over the previus order.
Stop Loss: The algorithm place the stopn using distance from the last lower / upper grid depending on the position side.
USES
Indispensable research and backtesting tool for those using bots for their investments. The algorithm produces a backtesting of the strategy for past history. It is used by professional traders to understand if this strategy has been profitable on a market and what parameters to use for bots using this strategy, only binance futures assets supported.
If you would like to develop your own algorithm with customized conditions based on a grid strategy, please contact us.
If you need help in using this tool, please contact us without hesitation.

3RSI 3CCI BB 5orders DCA strategy+This strategy is just an attempt to find the indicator values for the trading bot service that I use (link in profile). Due to the use of the “request.security” function in the code, the indicators can be redrawn, but this is not important in history. The strategy used only 5 orders for the "DCA" - bot, located at the same distance in the price overlap range. I only use this strategy when trading in pairs against bitcoin.
Эта стратегия – просто попытка подобрать значения индикаторов для сервиса торговых ботов, который я использую (ссылка в профиле). Из-за использования в коде функции «request.security» возможна перерисовка индикаторов, но на истории это не важно. В стратегии использовано всего 5 ордеров для «DCA» - бота, находящихся на одинаковом расстоянии в диапазоне перекрытия цены. Я использую данную стратегию только при торговле в парах к биткоину.

Premium ScalperThe strategy works with a combination of a number of different factors, including:
- Volume
- Moving averages
- Volatility
- RSI
This strategy generates long and short signals based on volume movements, moving averages and RSI. By combining other algorithms, low volatility periods can be filtered out.
The best results can be achieved by pairing the indicator with a bot through 3Commas and using a diversification strategy. This way you spread your risk over different pairs and you therefore also have a great chance of taking big moves.
The strategy results we display are results WITHOUT leverage. It is therefore also possible to only long on spot with this strategy, but for optimal results a trading bot link is required.
The settings we have used for these results are an order size of 100% with a 0.08% commission size.
Side note: This indicator does NOT use repainting!
We offer the possibility to try the indicator for free for 7 days.

GEMA-Estrategia por neil-------------------
DESCRIPTION
GEMA-STRATEGY is a strategy generator based on SMA, EMA, WMA, RMA that considers elements such as ADX, DMI, RSI, stochastic, Stoploss, Takeprofit, angles and values at present point.
HOW DOES IT WORK
The component works as an assistant to which you configure the previous elements and you see the performance that it offers you, in such a way that you pass that configuration to GEMA-INDICATOR so that you can receive alerts and do visual trading with notifications or automated trading by sending messages to platforms like 3Commas.
WHY USE IT
The resource operates with one of the most important strategies in the market, which is the price tracking line, which means that if prices go up, we follow it, if prices go down, we follow it; in this way you do not need to make large investments as is often the case with pure BOTs, which require large reserves for security orders.
HOW TO USE IT
Press the "Indicators" option, go to the "Public Library" segment, write the name "GEMA-Estategia por Neil", double click on the record in question and you will have it added in your work panel, now, it only remains to use it and configure its parameters.
-------------------
DESCRIPCIÓN
GEMA-ESTRATEGIA en un generador de estrategias basado en SMA, EMA, WMA, RMA que considera elementos como ADX, DMI, RSI, Estocastico, Stoploss, Takeprofit, ángulos y valores a punto presente.
COMO FUNCIONA
El componente funciona como un asistente al que vas configurando lo elementos anteriores y vas viendo el rendimiento que te ofrece, de manera tal, que pases esa configuración a GEMA-INDICADOR para que puedas recibir alertas y hagas trading visual con notificaciones o trading automatizado enviando mensajes a plataformas como 3Commas.
POR QUÉ USARLO
El recurso opera con una de las estrategias mas importantes del mercado, que es la linea de seguimiento de precio, lo que significa que si los precios suben, lo seguimos, si los precios bajan, lo seguimos; de esta manera no necesita realizar grandes inversiones como suele ocurrir con los BOT puros, que exigen grandes reservas para las ordenes de seguridad.
COMO USARLO
Presione la opción "Indicadores", ubíquese en el segmento "Libreria Publica", escriba el nombre "GEMA-Estrategia por Neil", haga doble clic sobre el registro en cuestión y lo tendrá agregado en su panel de trabajo, ahora, solo resta usarlo y configurar sus paramertos.

Price Change Scalping Strategy v1.0 - 3Commas EditionIntroduction
This strategy implements the Price Change Scalping (PCS) strategy specifically for the 3Commas platform. The Input settings have been redesigned to match the same inputs as the 3Commas My Bot Settings page. Only the "Deal Start Condition" section will echo the required PCS-related settings found in the original Price Change Scalping Strategy v1.0 to successfully implement the strategy.
The strategy uses a price rate of change (ROC) momentum calculation to determine the percent change in price between a defined range of bars. The calculated ROC value is then compared to the Upper Threshold and Lower Threshold values to determine if a trade setup is to be activated. If the threshold is crossed, a trade setup will occur based on the indicator settings. Entry, Take Profit, and Stop Loss prices are calculated and displayed on the chart. Once the Entry Price is crossed, a long or short position is created (depending on the direction) and once the Take Profit price is crossed, the position is closed. If the Entry Price is not crossed within a specific number of bars, the trade setup is canceled, and it will proceed to monitor price changes for the next set up.
How is it original and useful?
This strategy is unique in that the strategy version fully supports the TradingView backtester, which will enable you to perform experiments with various settings to evaluate performance using the historical chart data. The study version implements the "Start Deal" and "Close Deal" alerts for you to integrate with 3Comma's "Trading View Custom Signal" start condition. Both script versions will provide the same configuration abilities. The following list is a brief description of its usefulness:
Full support for all possible 3Commas bot settings.
Define a short or long trading strategy.
Price change data source and offset settings.
Your layering placement relative to the entry price.
Your trading parameters like take profit and stop loss offsets, trailing take profit support, exchange commission rates, trading start time, and order size multiplication for each layer.
Flexible trade eligibility rules that can use other chart indicators, like RSI or EMA, to exclude the selection of entry prices for trading.
The visibility of detailed statistics from the chart history pertaining to trading sessions started and closed, session durations, win rate, price action drops and bounces, as well as layer utilization.
The visibility of detailed Used Amount for Each Step table that details how each layer will be allocated for trading.
How does it compare to other scripts in the Public Library?
The strategy offers a very detailed, comprehensive settings to address all types of markets found on TradingView where you can implement the price change scalping strategy. The strategy version can be considered the first of its kind on TradingView to leverage the backtester to provide informative, detailed performance measurements surrounding this unique trading strategy. The study version will implement the latest alert framework called "Any Alert() Function" where you can create a single alert to handle multiple events, which include:
Deal Start
Deal Close
Strategy Results
The default settings are designed to define a "loose" price change settings to ensure that the indicator will render chart elements when first loaded as well as to allow the backtester to gather order executions and display performance summary. The strategy version is using $10,000 initial capital, a commission rate of 0.1% for both entries and exits, and a 1 tick slippage setting. It is also using 3.4881% of the equity for the Base Order Size, 4.7097% of equity for the first Safety Order Size. The Maximum Safety Trade Count is 7 with a Safety Order Volume Scale of 1.33, and a take profit of 2% with no stop loss. All other settings are defaults.
It is recommended that the indicator be "tuned" for your specific market to best implement the price change strategy and obtain better desirable results. You do so by scrolling through the chart's history and observing moments when prices tend to move rapidly. Measure the number or bars it typically takes for the price to change at a specific rate. Using this information, you can adjust the Price Change Settings accordingly to configure the indicator for the chart.
Always keep in mind that past performance may not be indicative of future results. Settings that seem favorable for one market may be found to be disastrous in another. Therefore, do take the time needed to understand how the settings will behave with the given chart symbol.
Enjoy! 😊👍
How to obtain access to the script?
You have two choices:
Use the "Website" link below to obtain access to this indicator, or
Send us a private message (PM) in TradingView itself.

Ultimate MACD Strategy [PrismBot] [Lite]Included in this Ultimate MACD Lite Strategy:
✔️ Tweak a multitude of specific settings (MA lengths, R:R, SL distance etc)
✔️ Enable advanced setup filters
✔️ Use money management and risk calculations
✔️ Draw trade info directly to chart (eg. SL size in percent, win rate etc)
✔️ Use various filters (eg. time filter, date filter, MA slope angle etc)
✔️ Manage risk per position when auto-trading forex through AutoView
✔️ Choose from various alert conditions!
✔️ Sync to any bot or algorithmic trading system
Some details about this strategy:
LONG SIGNAL
When the MACD is below the zero line of the histogram, close is above the 200EMA, and the MACD line crosses above the signal line, longs are taken
SHORT SIGNAL
When the MACD is above the zero line of the histogram, close is below the 200EMA, and the MACD line crosses below the signal line, shorts are taken
A couple of options are given for how to calculator stop losses.
The Take profit is calculated by the risk of the stop loss. So a 1.5 take profit target is 1.5 times the stop loss added to the entry price.
There is also an option to filter out trades by the histogram deviation. This prevents crossovers that are too close to the histogram from being taken.
Please note I used the code for the PPO instead of the traditional MACD to make calculating these percentage deviations more consistent across multiple asset types.
You can easily enable and disable strategies using the checkbox.
This strategy incorporates a risk to reward system where the user can select between ATR and Percent based stop losses and take profit targets. This means that the user has much better control over money management when utilizing this strategy and it doesn't require you to babysit the strategy to ensure it's entering and existing strategies in an ideal place.
You can also enter custom messages for alerts for use with bots (set alerts to "alert() function calls only")

Sola Fide [Strategy]Sola Fide High Accuracy with ATR R:R
Indicators used:
- Stochastic RSI
- Chopiness Index
- RSI
- Ichimoku Cloud
- ATR
Script has been set up in strategy format to give backtesting data.
The strategy has been made for BTC and ETH pairs against USDT on the hourly timerframe
Currently outperforming the Buy and Hold Return on both assets.
This script has been made to make it easier to automate strategies on 3commas
In the settings you will see options for BTC strategy or ETH strategy
Choose the asset you are on, copy your 3commas Bot ID and Email token and paste them into the settings box for eachever asset you are on.
To receive the alerts set up within the strategy, in your alert message box use " {{strategy.order.alert_message}}"
This will then be able to send any orders taken on the tradingview script directly to your long or short bot on 3commas
This strategy is set up with a strict set of rules on the ATR for the Take profits and Losses.
There is a repaint warning because the code uses heikin ashi candles through the security function, the given entry and exit signals do not repaint,
I have been automating this for myself with no errors.
You don't need to use more than 3x leverage...
Past results do not guarentee future results.

RSI Hidden Divergence + Stochastic + 200 EMA @DaviddTechHey Traders,
This is my first strategy of many I hope. Inspired by a strategy I found on YouTube I wanted to see if it would work with a BOT strategy.
The idea is :
## LONG ##
* When the price is above 200 EMA take only LONG positions.
* Look for Bullish hidden divergence.
* Stochastic crossover to find our entry.
## SHORTS ##
* When the price is below 200 EMA take only SHORTpositions.
* Look for Bearish hidden divergence.
* Stochastic crossunder to find our entry.
You can used a fixed percentage, ATR, HH/LL or a FIB level to take profit.
Everything is very visual and can be connected easily to a bot.
I will be doing a video on HOW-TO setup in a couple of days.
## MUTLI LEVEL PROFITS ##
This will show you on backtest is you take profits at 3 levels however I have not tested on a BOT strategy.
NOTE : This is for educational purposes and please test on a paper account, as I said this is my first strategy.
I will be working and back testing new strategies every week.
- Made with ♥ @DaviddTech

Take America Back Version 1.0So basically, the when the price goes down a little, it buys, and when it goes up a little it buys. The only indicators are account balances, and the price, that’s it. Now I wish that Pine Script had a function or variable in which I could recall the balances of specific portions of the portfolio, but it doesn’t. So, I had to improvise. Now for this to work accurately, all of the money needs to be in the “base” side before the bot can begin. Now, the thing about this is that it does not re-invest the amount that is “saved” to all but guarantee the balance will go up. However, as this goes up it will not add up as quickly in order to allow more wiggle room so that the bot does not work itself into a corner. If you want to keep some of your base, enter how much you want to keep it in the initial “saved” setting, as long as you allow at least enough to be equal to the default quantity value. Also, I recommend you setting the pyramiding setting to the result of the base value divided by the default quantity value. The default quantity value is how much you invest, measured in the base currency.
This would have been sooooo much easier if pine script could allow me to recall specific balances, but maybe a future one will.
Finally, THIS is why I made this program, I wanted to create something that would prevent the little ones from being stepped on by the big players who don't always play fair.
Besides, cryptocurrencies were made in response to the 2008 financial meltdown that caused a global recession. This decentralized currency is not just the money of the banks, the corporations, or the governments, but the money of the people. Use this tool to level the massive wealth inequality in my country and take America Back.
I will post more links and updates later once my reputation score goes up. I will discuss more about what influenced me to make this program and as some advise and possible future improvements as well.

Technicals Rating Strategy v420Ichimoku, HMA, RSI, Stoch, CCI, MACD, Technicals Rating Strategy is a trading Bot that looks at these chosen indicators and assigns a value to each, then calculates the result of adding each indicators result value to a overall rating, which is then compared to a user set level. Here seen on Bitcoin, it has the broker fee included in the testing result. If you choose to use it on Forex etc, perhaps remove the broker fee which is unrealistic for FX trading.
It has a Win/Loss ratio of only 40% wins, but it catches the big moves and thats the main thing, so if ELON MUSK had of used this strategy instead of BUY and HOLD, he could of made 700% instead of 7% (as is, may, 2021)
Mainly intended for use as Automated TRADE BOT.
(imagine if Elon Musk did use this bot with his 1.3 billion $ worth of BTC, the drawdown would be like, half a billion or something haha (p.s.- use smaller lotsize % to get smaller drawdown, but then smaller profit....) )
For use with any pair and timeframe. In fact there is a timeframe setting to set the strategy to look at alternative timeframe from chart, but as default will just be set to charts timeframe.

Cyatophilum Strategy BuilderAn indicator to create strategies, backtest and setup alerts.
The user can choose one or multiple TA entry conditions, if more than one the conditions are combined with a logical AND.
The entries will open up a trade, which is then handled by a risk management system including Trailing Stop, Take Profit and up to 100 Safety Orders.
This indicator can be used to backtest 3commas DCA bots who are using TA presets, RSI or ULT.
Its main goal is to create strategies by combining indicators.
Let's dive into the details of what's included:
Entry Condition: MACD
Triggers an entry when macd crosses with the signal line.
Configure the fast, slow length, signal smoothing and timeframe to trigger the condition.
Entry Condition: RSI
Triggers an entry when the RSI is higher or lower than the long/short threshold.
Configure the length, timeframe, long and short threshold to trigger the condition.
Entry Condition: ULT (Ultimate Oscillator)
Triggers an entry when the ULT is higher or lower than the long/short threshold.
Configure the 3 lengths, timeframe, long and short threshold to trigger the condition.
Entry Condition: Bollinger Bands
Triggers an entry when the price is above the upper band for long and below the lower band for short.
Configure the length, standard deviation and timeframe to trigger the condition.
Entry Condition: MFI (Money Flow Index)
Similar to RSI, it triggers an entry when the MFI is higher or lower than the long/short threshold.
Configure the length, timeframe, long and short threshold to trigger the condition.
Entry Condition: CCI (Commodity Channel Index)
Another oscillator that triggers an entry when its value is higher or lower than the long/short threshold.
Configure the length, timeframe, long and short threshold to trigger the condition.
Trend Filters
Use one or two trendlines to filter your trades: go only long/short when the trendline is bullish/bearish.
Choose between the several trendlines: ema, sma, wma, hull ma, kama, alma, rma, swma, vwma, Tilson T3, and the unique Adaptive T3 and Adaptive Hull MA.
If this is not enough, you can use the external trendline feature to plug in any other indicator for your trendline.
The second trendline can be MTF and come from another symbol if needed.
Combining Indicators
Most of the time we will not be using a single indicator at a time, but instead, combine them in order to get stronger entries.
The entry conditions are combined using a AND logical gate, meaning all conditions must be true for the entry to trigger.
Here is an example using a combination of 2 indicators: Bollinger Bands and RSI.
We can see less entries are being triggered on the bottom chart than on the top chart because the bottom chart is combining the 2 indicators while the top chart is only using Bollinger Bands.
You can combine up to all 6 indicators if you want, but keep in mind that combining too many may lead to triggering no entry at all.
Risk Management and Trade system
The indicator will not trigger more than one long or short entry in a row.
To start a new trade, the indicator will wait for either take profit, stop loss or an opposite entry if no SL and TP is set.
Stop Loss and Take Profit
Configure your stop loss and take profit for long and short trades.
You can also make a trailing stoploss and a trailing take profit.
Safety Orders
Just like 3commas bots, you can create a strategy with up to 100 safety orders.
Configure their placement and order size using the price deviation, step scale, take profit type (from base order or total volume), and volume scale settings.
Note: only the 20 first safety order steps or so will be plotted due to graphic limiations. The steps after that still trigger alerts and backtest results.
Creating Alerts
The indicator is using the newest alert system:
1. Write your alert messages in the indicator settings (alert section at the bottom)
2. Click "Create Alert" as usual, but choose "alert() function calls only"
Data Window
Since the indicator is applied on top of the price chart, the oscillator indicators cannot be plotted. You can always add them on another pane but if you want to just see their values, you can use the Data Window to see the value of each oscillator on each bar.
Backtest settings
Used to get the results below:
Initial Capital: 100 000$
Base Order Size: 0.1 contract (BTC)
Safety Order Size: 0.1 contract (BTC)
Commission: 0.1%
Slippage: 100 ticks
pyramiding: 6
The indicator settings are plotted in the main chart panel.

ATH Oscillator StrategyThis idea stems from the belief that people want to reverse the trend when an all time high or low is hit. This strategy incorporates that by using ath and atl values based on the lookback period and the signal gets smoothed by the input smoothing type and length. I found that the best time to use this was on the 3m chart. But I am certain that higher time frames can be used if the settings are tweaked.
Settings:
Strategy -
simple(long,short,switch) - This strategy just uses the directional change of the signal using just longs, just short, or switching between the two.
range - This strategy uses the hlines on the chart to determine when to buy and sell. These can be adjusted using the Range Top / Bot values
div - This strategy uses a simple divergence of the signal line to time entries
Lookback - How many bars back to check the ath and atl
Smoothing - How smooth you want the signal
Smoothing Type - Different ways to smooth the signal
Range Top/Bot - Changes the height of the hlines for the range strategies
On Buy/Sell Signal # - Change when you enter. Increasing this number will move the signals to the left if there are consecutive signals. Useful to find bottoms and tops.
Chart: ETHUSD Perp Bybit
Strategy Properties: 100 base order, 100% equity
Notes: Use on 3-5m time frame for best results. Change settings if you want to try other coins like BTC or higher time frames

DMT 369 DRAGRONFLY STRATSuccessful traders trade with a fixed plan and without emotion, but this a lot harder than many new traders think. Many never master this skill and suffer continual drawdowns on their accounts as they overtrade high leverage positions in volatile markets.
ĐΜŦ Autobot resolves this issue by taking the human element out of the equation, allowing full automation of trades using TradingView alerts to trigger your favourite trading bot, such as Alertatron or 3Commas.
Being a Trend Reversal Indicator based on Volatility & Average True Range, ĐΜŦ Autobot is designed to identify spots in the market that offer suitable scalp and swing trade opportunities.
Due to popular demand we have expanded our ĐΜŦ Autobot product line to include the new ĐΜŦ Autobot Dragonfly 3-6-9 Edition which combines DMT with 3-6-9 Vortex mathematics, our Titan indicator and a multi-ladder scalping strategy to ensure you maintain a preferable average entry when price action moves against your position.
Indicator View
It its default state the DMT Autobot Dragonfly indicator displays key signal information, such as:
• Support & resistance range lines
• Titan Body Small & Large Time Frame lines
• Long & Short entry positions
• Long & Short position ladders
• Profit targets
Dragonfly displays a range between resistance (upper line) and support (lower line) on the chart.
Once the price is granted support in the range the lower line will turn green. As price action develops it will make repeated attempts to test support. If support holds price will attempt to test the resistance line (red).
When resistance is broken and the price is above the upper line, the line will turn blue confirming the bullish momentum and provide a potential buy opportunity.
Price action will make attempts to test the upper line as support and will keep rising while support is granted.
Once support is lost the upper line will become red once more. As price action develops it will make repeated attempts to test resistance. If resistance holds, the price will attempt to test the support line (green).
When support is broken and the price goes below the lower line, the line will turn red confirming the bearish momentum and provide a potential selling opportunity.
Price action will make attempts to test the lower line as resistance and will keep dropping while resistance is granted.
Titan Body
The Titan Body Small & Large time frame options in the indicator add additional trendlines to the chart to provide further clarity and confirmation to the Support & Resistance range indication.
Once price is granted support by the Small Time Frame trend line the line will turn green. As price action develops it will make repeated attempts to test the Small Time Frame support. Once the price is below the Small Time Frame trend line, the line will turn red and can act as resistance in a trend reversal.
When price is granted support by the Large Time Frame trend line the line will turn cyan. As price action develops it will make repeated attempts to test the Large Time Frame support. Once the price is below the Large Time Frame trend line, the line will turn orange and can act as resistance in a trend reversal.
The Titan Body enabled and customized in the indicator’s style settings,
Alert indicators
DMT Autobot Dragonfly Edition generates signals that can be used to scalp trade a volatile asset.
Signals are enabled and customized in the indicator’s input settings Additional options can be found in the options, but it is recommended that these are left at the default, as shown below. The indicator generates many
Entry and Profit levels can be disabled or customized in the indicator’s style settings,
Tradingview Alerts
Using Tradingview alerts, DMT Autobot Dragonfly signals can be used to trigger a trading bot.
To trigger a long or short position, set the Tradingview Alert Condition to DMT 369 Dragonfly and select the long or short option.
It is recommended that long or short positions are configured to trigger Once Per Bar Close
Ladders can also be triggered using alerts. To trigger a ladder order, set the Tradingview Alert Condition to DMT 369 Dragonfly and select the appropriate Long or Short ADD option that is to be triggered by the relevant values defined in the indicator’s configuration.
It is recommended that ladder orders are configured to trigger Once Per Bar,
To trigger a take profit order, set the Tradingview Alert Condition to DMT 369 Dragonfly and select the Long or Short TP option that is to be triggered by the relevant values defined in the indicator’s configuration.
Take profit orders can be configured as Once Per Bar Close or Once Per Minute.
If you wish to trigger a take profit signal immediately when the indicator’s defined take profit value is achieved, then use the Once Per Bar option.
Selecting Once Per Bar Close to generate a take profit signal is a gamble as the candle may close far away from the defined profit target – positive or negative.
While stops can be used, they are not applicable to the recommended ladder strategy.
Ladder Strategy
The DMT Autobot Dragonfly indicator always turns an underwater position into a win by utilizing a ladder strategy.
By using the recommended defaults, the indicator will trigger ladder orders at 3%, 6% & 9% using increasing order sizes,
Order sizes increase exponentially to ensure a good average price is maintained. If you are not using DMT Autobot Dragonfly signals to trigger ladder or take profit orders, please ensure your trading bot is configured to recalculate the new ladder entry and profit target based on the new average position entry price as each ladder is filled.
If you are using DMT Autobot Dragonfly on a leveraged asset, please ensure the leverage position is configured suitably so that your position is not liquidated if the price rapidly moves against you.
If u are looking for more information or access to the script please private msg me in trading view chat thx for support

M4x Rainbow V4i strat LINK-USDTGRID & TREND Multiplier Experiment
// "M4x Rainbow" is a Strategy Grid Trend Multiplier bot, who is following the trend.
// I built it as an experimental tool with Strategy implemented, even if that numbers are far out...!
// Because.....it not only depends on the bot setup, the timings of the TradingBot (eg.3Commas) are very relevant too!
// Like amount of Trades, Security Orders, Deviation and so on...
// Please feedback your experience with a Comment , as I would like to improve this bot.
// Updates will follow ;-)
//
// "M4x Rainbow" is not bound on FIFO, each trade get's his own exit.
// It is set for Pyramiding, which can be changed in the "Strategy" line
// Fees are set equal to Binance numbers at 0.1%, about...
// The coloring of the lines is:
//
// green = linestate is LONG
// blue = linestate is WAIT
// yellow = linestate is SHORT
//
// Give it a try and let me know.
//
// ...have fun ;-)

Forex levrage 1 minOk this is more complex code the scanner system that why I protected it so folks will not abuse it . this system have no repaint as no security attach to mtf
the problem with the scanner system
that it only long system ,if you stuck in a loop you cannot get out of it unless a new win trade will start. this can be catastrophe if we use leverage system as it will destroy our all account. in the scanner system one can use stop loss but it will reduce profit very much.so that will be the exit . and there is no way for short. in this system which is based on the scanner system you do short. you can still use stop loss or exit by short
so since forex go by pairs. if the strategy of long does not work then flip sides for the longs neaning oposite coin. or short it.
this sytem allow you to use leverge and see by test how to calculate your best way to enter a levrage .
since it 1 min I set it to take profit as 0.2,0,0.4 0.5 and 0.7 . and to take 25% each time .
if you are familar with scanner system then it will easy to navigate with this one as well
the exit system you can see min time. HTF and candle time. the HTF is on the frame that we use . try to play either with minute time or candle time to get better results this sytem great for coins that are going up. so beaware of this issue
if you have questions please let me know
the levrage is set to 100% of your lot at 1 X
in real life I use 10% of my lot and then i put any leverage that i want depend on the strategy that I use
so be aware of this fact
this system buy and sell in avreage 800-1500 min cycle so about a day or so to get our profit out of it.
you can use it as advisor not as bot and then you decide by your self where the best exit need to be.
take this sytem only as helper for your forex trades
there is no subsitution for common sense..that a bot can never give you. so be carfull with the money that you risk

LUBEThis is a chart meant for 30m BTCUSD but could be used for many other assets, and there are inputs to play with.
I decided on the strange title "LUBE" because I was measuring how many of the previous 500 bars had the current price level already been in. I wanted to discover when the price was in a new zone or an area that it hadn't spent much time in recently... the LUBE zone.
Think of the blue line as showing you the current level friction. If the blue line is high, price is quagmired and not moving quickly. Price could trend sideways for a while before breaking out. A high blue line is a high traffic zone for trading. When the blue line dips low, it's encountering a price zone the asset has not been observed in recently, and this could mean price could break out and move more freely and quickly when it does. We get a trade entry signal if the blue line dips below the bottom white line. The bottom white line is currently set to -10. Think about the lowest the blue line has been recently as 0, and the highest as 100. It is set by default (for BTCUSD 30m chart) to -10 meaning the blue line has to dip a little (-10%) below the lowest it has experienced recently to initiate a trade. This is the LUBE zone. The bottom white line shows that level. Again this is a level lower than the lowest amount of friction experienced in price action for the last 100 bars, but offset by 5 bars showing where that level was at 5 bars ago. We want to dip below that to initiate a trade.
The direction to trade in is determined by a very quick moving weighted moving average (variable name is "fir") to see if the recent trend is up or down. To end a trade, an arbitrary number between 0 and 100 is picked telling us when we are experiencing enough friction again to end the trade. I have it preset to 50 (think of it as 50/100 or half way between the white bars. At a 50% friction level it's time to get out of the trade.
Some shortcomings are missing the bulk of big moves, and experiencing whipsaws where price action zips up and then comes straight back down. Overall the backtest looks sweet enough to use on 2x leverage, experiencing a 17.78% max drawdown at the time of publishing. I wouldn't push the leverage any higher.
To get alerts change the word "strategy" to "study" and delete lines 60-67.
Bot traders using alerts: beware the alert conditions. If a trade goes directly from long to short (which happens rarely), without closing a trade first, it might not act properly. If you use bots to trade, for "LONG" please close any old trades first before putting in instructions to open a leveraged long. To go "SHORT" please remember to close any old trade first as well, and things *should* work out just fine.
Good luck, have fun, and feel free to mess up and butcher this code to your own liking. I'm not responsible if anything bad that happens to you if you use this trading system, or for any bugs you may encounter.

[astropark] Ichimoku Cloud StrategyDear Followers,
today a Great Swing Trading Strategy , runnable on a bot , which works great on High Timeframes (1D is suggested!) but also even better on 1m Renko chart.
If you are a scalper, you will love suggested entries for fast profit. You can run it on 1h timeframe (below is not suggested) if you are used to scalp trading and close each trade whenever you feel happy (a proper trailing stop strategy is suggested anyway).
This strategy is based on the Ichimoku Cloud Indicator and let's you set a lot of settings:
works on all timeframes (but 1D and above is suggested on normal candlesticks chart)
you can run this indicator on 1m Renko chart (be sure to enable the "USING RENKO CHART? ENABLE THIS OPTION" setting)
you can use 4 kind of Ichimoku Cloud (Custom, Slow, Standard and Fast - keep only one enabled)
you can make the Ichimoku Cloud show or not
you can enable showing the possibile re-entries
you can enable an heiking ashi analysis
you can enable a trailing stop strategy ("Auto Trailing Stop Loss" and "Close Trade When Price Breaks Above the Ichimoku Cloud" are two options very much suggested to keep enabled, especially on bot trading)
you can create your own trailing stop stategy and take profit strategy
you can enable a simple take profit strategy based on RSI Overbought and Oversold levels
This strategy only trigger 1 buy or 1 sell, but if you missed the possibility to open your long or short position don't get mad, but just enable the "show re-entry signals" option, so yout will be able to enter again (be sure to always use a proper money management ).
By the way, you can set any alarms you like in order to get notified when any kind of signal is triggered (you need to use the "alarms" version for this).
Strategy results are calculated on the timeframe from January 2016 to now, so on 3 years, using 10000$ as initial capital, doing only 6 trades (great swings!) and working at 1x leverage (so no leverage at all! perfect spot trading style!). If you like to use leverage, be sure tp use a safe option, like 3x or 5x at most in order to have liquidation price very far).
This is not the "Holy Grail", so use a proper risk management strategy.
This script will let you backtest how the indicator will perform on any chart you may test. Of course results will be very different depending on the chart you will open. I tested a lot of charts and always you can find a combination that keep this strategy in profit on swing trading style (and this means that if you can have a daily look at the chart you can always manage to maximize your profit on each trade!
The alarms version of this indicator, which will let you set all notifications you may need in order to be alerted on each triggered signals, can be found by searching for "astropark Ichimoku Cloud Strategy" and then choosing the "astropark" indicator with "alarms" suffix in the name.
This is a premium indicator , so send me a private message in order to get access to this script.

CBMA Bollinger Bands Strategy directed [ChuckBanger]I just did a Bollinger Bands script with my newly CB moving average
While I'm generally against posting strategies because it's very easy to fake performance numbers... This is just to share a cool strategy snippet. My settings are 10 contracts/order with pyramiding set to 10. You can make the profitability a lot higher if you set the order size higher. But that dosent help you getting more out of this script when u make a bot of this script. I set the order size to 10 contracts to get your attention not to showcase the performance.
When the price is going down and outside of the lower side of the band. And when the price comes back into the channel the strategy buys. Usually that means the price is going up. And when the price is going up and outside of the upper band. The strategy sells when it crosses back in to the channel.
It is a very simple strategy but it is effective. I guess you need a proper stop-loss for this script to bee really profitable in a bot environment.

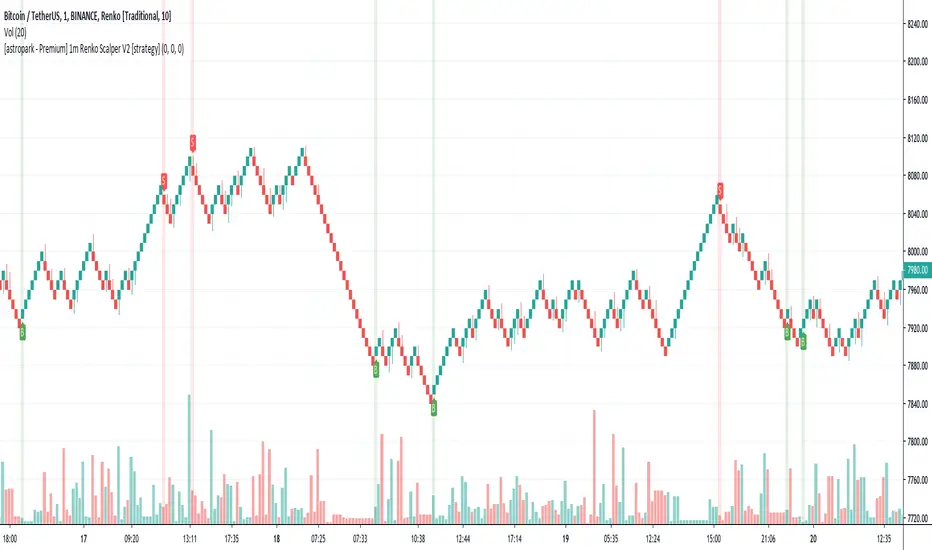
[astropark - Premium] 1m Renko Scalper V2 [strategy]Dear Followers,
today a new Scalper Tool , which works great on 1 minute timeframe , which is the best and more secure timeframe to use on a Renko chart, besides it works great up to 15m (I don't suggest to use a renko chart over 15m timeframe)!
It is an upgraded version of Bitmex Renko Scalper that you can find in my tradingview script page.
This tool has some cool features:
it works on 1 minute timeframe : so you can enjoy high-frequency trading by using a 24/7 running bot;
wait bricks optional mode : you may like to make script wait for triggering a new signal by waiting 1 or 2 more confirmation bricks
trailing stop : you can set a trailing stop in trade, so script will alert you if it will be reached in chart
This strategy can trigger till 5 buy or 5 sell signals in a row before reverting, so use a proper money management .
Strategy results are calculated on the timeframe from july to now, so on about 4 months, using 10000$ as initial capital and working at 3x leverage (very safe leverage!).
The user who wants to use this strategy, especially via an automated bot, must always set a stoploss at 5% from entry point or use a proper risk management strategy .
This is not the "Holy Grail", so use it with caution.
This script will let you backtest this script and find best settings for your preferred market. On Bitmex XBTUSD chart best settings is Traditional Renko chart with 10$ box size.
The alarms version of this indicator, which will let you set all notifications you may need in order to be alerted on each triggered signals, can be found by searching for "1m Renko Scalper V2".
This is a premium indicator , so send me a private message in order to get access to this script .
FCO FIRE
FCO FIRE
BitMEX trades highly successful scalp in XBTUSD parity. You can use it not only for crypto but also high success on stock market.
You can contact to use.
Improvement works in progress...
