Cari dalam skrip untuk "break"


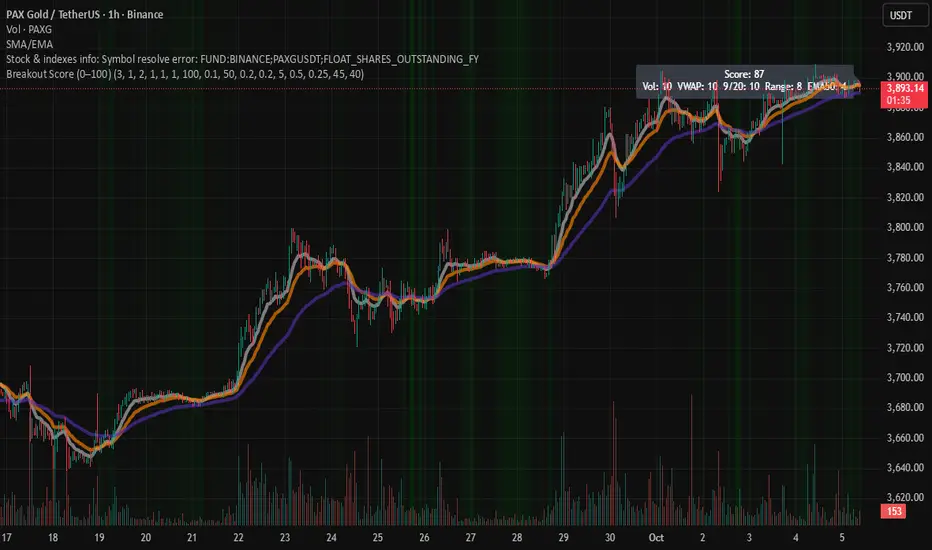
Breakout Score (0–100)Breakouts are often the trader's best setups. Often seen on the chart as wedges and flags, consolidation before a pop up or down. This script attempts to visualize breakout potential with gradients in the background. I built this to place on my side charts to quickly visualize that a setup was forming.
For this indicator, Breakouts have generally been assumed as:
Decrease in average volume over N candles
Proximity to VWAP
Convergence/cross of price to the 9, 20 and 50 EMAs
Range compression (formation of flag or consolidation)
each of these factors are scored and rated. Multiple signals exponentially increase the gradient. Depending on the score, the chart will display a visual gradient behind the chart. Color, opacity and filtering fully customizable.
Enjoy!
Breakout Identifier + Pivots with pos/neg/neu candlesBreakout Identifier is an indicator that displays breakouts which can be used to help a trader buy or sell. This is a volatility-based indicator that has customizable inputs. Each signal is also plotted with a pivot which can help to trade within a range or determine a trap.
To edit the gap between each signals change signal integer, goes by price.
BG colors are also assigned to candles as negative, positive, or neutral which are colored as follows:
Green = high > high of previous candle
Red = low < low of previous candle
Silver = neither of these options

Breaker Blocks with Signals [LuxAlgo]The Breaker Blocks with Signals indicator aims to highlight a complete methodology based on breaker blocks. Breakout signals between the price and breaker blocks are highlighted and premium/discount swing levels are included to provide potential take profit/stop loss levels.
This script also includes alerts for each signal highlighted.
🔶 SETTINGS
🔹 Breaker Blocks
Length: Sensitivity of the detected swings used to construct breaker blocks. Higher values will return longer term breaker blocks.
Use only candle body: Only use the candle body when determining the maximum/minimum extremities of the order blocks.
Use 2 candles instead of 1: Use two candles to confirm the occurrence of a breaker block.
Stop at first break of center line: Do not highlight breakout signals after invalidation until reset.
🔹 PD Array
Only when E is in premium/discount zone: Only set breaker block if point E of wave ABCDE is within the corresponding zone.
Show premium discount zone: Show premium/discount zone.
Highlight Swing Break: Highlight occurrences of price breaking a previous swing level.
Show Swings/PD Arrays: Show swing levels/labels and pd areas.
🔶 USAGE
The Breaker Blocks with Signals indicator aims to provide users with a minimalistic display alongside optimal signals to be aware of for finding trade setups as shown below.
Here we can see a MSS occurred allowing the indicator to detect a Breaker Block (-BB) & display a red arrow to confirm this signal.
The signal(s) that can be used for potential entries are only during retests of the breaker blocks.
A potential strategy traders could use with this indicator is to target the corresponding Discount PD Arrays detected (for a short position) and Premium PD Arrays (for a long position).
In the image above we can see price generated the potential entry signals in orange & fell to the Discount PD Arrays as a logical setup to look for with this indicator.
As we can see in the image above, signals can be considered invalid when price closes above the 50% level in which it would be suggested to wait for another setup.
Users still looking for more potential setups based on the same breaker block can disable the "Stop at first break of center line" setting within the settings menu.
In the image above we can see a bullish example whereas price confirmed a bullish breaker block (+BB), had a quick pullback into it that was confirmed by the green arrow, and then reached the Premium PD Arrays.
While retests of breaker blocks can still function well if they occur later in the price action, it's most preferable for users to look for entry signals that are near confirmed breaker blocks (5-10 bars) opposed to waiting 20+ bars.
Additional take profits based on the occurence of the breaker blocks are given in order to provide targets after the occurence of a breaker block breakout.
🔶 DETAILS
Breaker blocks are formed after a mitigated order block, these can provide change of polarity opportunities, thus playing a role as a potential support/resistance. It is the re-test/retrace of price to a breaker block that will set the conditions to provide signals.
The above chart describes the creation of a breaker block.
The signal generation logic makes use of various rules described below:
Bullish Breaker Blocks:
opening price is within the breaker block, while the closing price is above the upper extremity of the breaker block.
Price did not cross the breaker block average in the interval since the previous breakout.
Bearish Breaker Blocks:
opening price is within the breaker block, while the closing price is below the lower extremity of the breaker block.
Price did not cross the breaker block average in the interval since the previous breakout.
When a new pattern is formed, all previous drawings are removed.
🔶 RELATED SCRIPTS

Breakout Detector (Previous MTF High Low Levels) [LuxAlgo]The Breakout Detector (Previous MTF High Low Levels) indicator highlights breakouts of previous high/low levels from a higher timeframe.
The indicator is able to: display take-profit/stop-loss levels based on a user selected Win/Loss ratio, detect false breakouts, and display a dashboard with various useful statistics.
Do note that previous high/low levels are subject to backpainting, that is they are drawn retrospectively in their corresponding location. Other elements in the script are not subject to backpainting.
🔶 USAGE
Breakouts occur when the price closes above a previous Higher Timeframe (HTF) High or below a previous HTF Low.
On the advent of a breakout, the closing price acts as an entry level at which a Take Profit (TP) and Stop Loss (SL) are placed. When a TP or SL level is reached, the SL/TP box border is highlighted.
When there is a breakout in the opposite direction of an active breakout, previous breakout levels stop being updated. Not reaching an SL/TP level will result in a partial loss/win,
which will result in the box being highlighted with a dotted border (default). This can also be set as a dashed or solid border.
Detection of False Breakouts (default on) can be helpful to avoid false positives, these can also be indicative of potential trend reversals.
This indicator contains visualization when a new HTF interval begins (thick vertical grey line) and a dashboard for reviewing the breakout results (both defaults enabled; and can be disabled).
As seen in the example above, the active, open breakout is colored green/red.
You can enable the setting ' Cancel TP/SL at the end of HTF ', which will stop updating previous TP/SL levels on the occurrence of a new HTF interval.
🔶 DETAILS
🔹 Principles
Every time a new timeframe period starts, the previous high and low are detected of the higher timeframe. On that bar only there won't be a breakout detection.
A breakout is confirmed when the close price breaks the previous HTF high/low
A breakout in the same direction as the active breakout is ignored.
A breakout in the opposite direction stops previous breakout levels from being updated.
Take Profit/Stop Loss, partially or not, will be highlighted in an easily interpretable manner.
🔹 Set Higher Timeframe
There are 2 options for choosing a higher timeframe:
• Choose a specific higher timeframe (in this example, Weekly higher TF on a 4h chart)
• Choose a multiple of the current timeframe (in this example, 75 minutes TF on a 15 min chart - 15 x 5)
Do mind, that when using this option, non-standard TFs can give less desired timeframe changes.
🔹 Setting Win/Loss Levels
The Stop Loss (SL) / Take Profit (TP) setting has 2 options:
W%:L% : A fixed percentage is chosen, for TP and SL.
W:L : In this case L (Loss-part) is set through Loss Settings , W (Win-part) is calculated by multiplying L , for example W : L = 2 : 1, W will be twice as large as the L .
🔹 Loss Settings
The last drawing at the right is still active (colored green/red)
The Loss part can be:
A multiple of the Average True Range (ATR) of the last 200 bars.
A multiple of the Range Cumulative Mean (RCM).
The Latest Swing (with Length setting)
Range Cumulative Mean is the sum of the Candle Range (high - low) divided by its bar index.
🔹 False Breakouts
A False Breakout is confirmed when the price of the bar immediately after the breakout bar returns above/below the breakout level.
🔹 Dashboard
🔶 ALERTS
This publication provides several alerts
Bullish/Bearish Breakout: A new Breakout.
Bullish/Bearish False Breakout: False Breakout detected, 1 bar after the Breakout.
Bullish/Bearish TP: When the TP/profit level has been reached.
Bullish/Bearish Fail: When the SL/stop-loss level has been reached.
Note that when a new Breakout causes the previous Breakout to stop being updated, only an alert is provided of the new Breakout.
🔶 SETTINGS
🔹 Set Higher Timeframe
Option : HTF/Mult
HTF : When HTF is chosen as Option , set the Higher Timeframe (higher than current TF)
Mult : When Mult is chosen as Option , set the multiple of current TF (for example 3, curr. TF 15min -> 45min)
🔹 Set Win/Loss Level
SL/TP : W:L or W%:L%: Set the Win/Loss Ratio (Take Profit/Stop Loss)
• W : L : Set the Ratio of Win (TP) against Loss (SL) . The L level is set at Loss Settings
• W% : L% : Set a fixed percentage of breakout price as SL/TP
🔹 Loss Settings
When W : L is chosen as SL/TP Option, this sets the Loss part (L)
Base :
• RCM : Range Cumulative Mean
• ATR : Average True Range of last 200 bars
• Last Swing : Last Swing Low when bullish breakout, last Swing High when bearish breakout
Multiple : x times RCM/ATR
Swing Length : Sets the 'left' period ('right' period is always 1)
Colours : colour of TP/SL box and border
Borders : Style border when breakout levels stop being updated, but TP/SL is not reached. (Default dotted dot , other option is dashed dsh or solid sol )
🔹 Extra
Show Timeframe Change : Show a grey vertical line when a new Higher Timeframe interval begins
Detect False Outbreak
Cancel TP/SL at end of HTF
🔹 Show Dashboard
Location: Location of the dashboard (Top Right or Bottom Right/Left)
Size: Text size (Tiny, Small, Normal)
See USAGE/DETAILS for more information

Breakouts with timefilter [LuciTech]Here's the updated description with "colors" replaced by "colours" throughout, maintaining the original structure and content:
Breaking Point 2.0
This is a technical analysis overlay indicator designed to identify breakout levels based on pivot highs and lows, with a focus on price action during customizable time windows using London time (UK). It draws horizontal lines at pivot points and plots signals when price breaks above or below these levels, offering traders a tool to monitor potential bullish or bearish movements. The indicator includes options for time filtering and displaying only the most recent breakout.
Features
The Pivot Breakout Lines display horizontal lines at detected pivot highs (bullish) and pivot lows (bearish), coloured green and red by default. These lines extend from the pivot point to the breakout bar and can be set to show only the latest breakout.
The Breakout Signals mark bullish breakouts with an upward triangle below the bar and bearish breakouts with a downward triangle above the bar, using customizable colours.
The Time Filter restricts signals and lines to a specific window (default: 14:30–15:00 UK), which can be toggled on or off. A shaded background highlights this period when enabled.
How It Works
The indicator calculates pivot highs and lows using a user-defined lookback period (default: 5 bars). When price closes above a pivot high, it triggers a bullish signal and draws a line from the pivot to the breakout bar. When price closes below a pivot low, it triggers a bearish signal with a corresponding line.
If the time filter is active, signals and lines only appear within the specified window. Outside this period—or if the filter is disabled—they appear based solely on price action. The indicator maintains up to three recent pivots in memory, removing older ones as new pivots form.
Alerts are available for both bullish and bearish breakouts, triggered when signals occur.
Settings
Length controls the lookback period for pivot detection (default: 5).
Colours Bull/Bear sets the colours for bullish (default: green) and bearish (default: red) lines and signals.
Show Last Breakout toggles whether only the most recent breakout line and signal are displayed (default: false).
Time Filter enables or disables the time restriction (default: true).
Fill Background toggles a shaded area during the time window (default: true), with a customizable colour.
Time Settings define the start hour/minute and end hour/minute for the filter (default: 14:30–15:00).
Interpretation
The Pivot Breakout Lines highlight levels where price has previously reversed, potentially acting as support or resistance. A breakout above a pivot high may suggest bullish momentum, while a breakout below a pivot low may indicate bearish pressure.
The Breakout Signals provide visual cues for these events, useful for timing entries or exits. When "Show Last Breakout" is enabled, the chart focuses on the most recent signal, reducing clutter.
The Time Filter and background shading help traders concentrate on specific trading sessions, such as high-volatility periods. When disabled, the indicator tracks breakouts across all times.

Breakout FinderHelo All,
I got many requests for a Breakout script and here it's. This script searches the breakouts/breakdowns and draw square if there is one.
The options:
"Period" is used to find Pivot Points
"Max Breakout Length" is the maximum length to search breakouts
"Threshold Rate %" is channel width of the breakout area. calculated using highest/lowest of last 300 bars.
"Minimum Number of Tests" is the minimum number of tests that the Price tried to break the S/R level
and some options for coloring and linestyle
Lets see some examples:
in this example "Minimum Number of Tests" is 2 so the Price must have tested to break resistance area 2 times and then it breaks it as seen in the screenshot:
in following example Threshold rate is %10, so the channel width is very big:
as you can see in followinf screenshot you can choose different colors and line styles:
Alerts added ;)
Enjoy!

Breakout Boxes [ChartPrime]⯁ OVERVIEW
The Breakout Boxes indicator identifies key structural levels by detecting and aligning two consecutive pivots — forming confirmation zones where potential breakouts are most likely to occur. Once two pivots align within a defined ATR range, the indicator constructs a Breakout Box around that area, tracking volume distribution and breakout strength. When price breaks above or below these boxes, breakout labels (⯁ BreakUp / BreakDn) are displayed to confirm trend continuation.
⯁ KEY FEATURES
Pivot-Based Detection: Uses a customizable pivot length to identify market swing highs and lows.
Two-Pivot Alignment Logic: A breakout box is only created when two pivot highs or lows form near the same level, confirming structural alignment and increasing breakout reliability.
Dynamic Box Generation: Builds upper and lower boxes once pivot alignment is confirmed, adapting automatically to new structures.
Volume Distribution Analysis: Each box measures total traded volume and separates it into bullish and bearish components, showing buy/sell percentages inside the range.
The volume data is calculated in real time as long as the box remains active and unbroken, allowing traders to monitor live accumulation or distribution before a breakout occurs.
Breakout Confirmation Signals: Labels appear when price decisively breaks above the upper box (⯁ BreakUp) or below the lower one (⯁ BreakDn).
Adaptive ATR Scaling: Box size dynamically adjusts to volatility, maintaining consistent proportions across assets and timeframes.
Color-Coded Visualization: Upper (bearish) boxes use pink tones; lower (bullish) boxes use green, both with transparent fill for volume clarity.
Automatic Box Resetting: Previous boxes close when a new pivot pair forms, ensuring only the most relevant structure is active.
⯁ USAGE
Watch for Two Pivot Alignments — the indicator only activates when structural confluence exists, reducing false breakout signals.
Upper Boxes represent resistance formed by two aligned swing highs; a breakout above indicates potential bullish continuation.
Lower Boxes represent support formed by two aligned swing lows; a breakdown below indicates bearish continuation.
Analyze the Volume Ratio inside each box — higher buy volume in upper boxes supports bullish breakouts, while higher sell volume in lower boxes supports bearish moves.
Use this tool alongside trend indicators or higher timeframe context to confirm the direction of breakouts.
⯁ CONCLUSION
The Breakout Boxes indicator refines breakout analysis by requiring two aligned pivots to validate structural zones. By combining pivot confluence with volume distribution and adaptive ATR scaling, it provides a precise, data-backed visualization of breakout strength and direction — a powerful tool for structure-based trading confirmation.

Breaker Blocks Finder | Gold | ProjectSyndicateProjectSyndicate Breaker Blocks Finder
📊 Overview
The ProjectSyndicate Breaker Blocks Finder (PS BB Finder) is a professional-grade Pine Script indicator designed to detect and display Bullish and Bearish Breaker Blocks based on Smart Money Concepts (SMC) methodology. This indicator is specifically optimized for XAUUSD (Gold) trading but works reliably across all symbols and timeframes.
Key Features
✅ Non-Repainting: Breaker blocks never change position after formation
✅ Multi-Timeframe Support: Optimized for M5, M10, M15, M20, M30, and H1
✅ Highly Customizable: 10+ user-configurable settings
✅ Visual Clarity: Color-coded boxes and labels for easy identification
✅ Performance Optimized: Handles 1000+ candles without lag
✅ Cross-Symbol Compatible: Works on Forex, Crypto, Stocks, Indices, and Commodities
✅ Displacement Detection: Uses ATR-based displacement to filter false signals
🎯 What are Breaker Blocks?
A Breaker Block is a failed order block that becomes a new support or resistance zone after being invalidated by price. It represents a market structure shift where institutional traders (smart money) have flipped their position.
Bullish Breaker Block
A Bullish Breaker Block forms when:
1 A bearish order block (resistance zone) exists
2 Price breaks ABOVE this zone with strong displacement
3 The former resistance zone now becomes SUPPORT
4 Price may retest this zone before continuing higher
Visual: Green box with "BB ▲" label
Bearish Breaker Block
A Bearish Breaker Block forms when:
5 A bullish order block (support zone) exists
6 Price breaks BELOW this zone with strong displacement
7 The former support zone now becomes RESISTANCE
8 Price may retest this zone before continuing lower
Visual: Red box with "BB ▼" label
⚙️ Default Settings
Setting Default Range Description
Lookback Period 1000 100-5000 Number of historical candles to analyze
Max Breaker Blocks 5 1-50 Maximum number of breaker blocks to display
Swing Detection Length 10 2-20 Bars on each side to confirm swing high/low. Higher = more significant swings
Use Displacement Filter true true/false Enable to filter breaker blocks by displacement size
Displacement Multiplier 2.0 0.5-5.0 Minimum move size as multiple of ATR. Higher = stricter detection
Invalidation Method Close Close/Wick Close = Conservative (candle must close beyond zone)Wick = Aggressive (wick touch is enough)
📈 Recommended Timeframes & Settings
This indicator is optimized for the following timeframes. Use these settings as a starting point.
Lower Timeframes (M5, M10, M15, M20)
These settings are designed to capture faster price movements and are the default settings for the indicator.
Setting Recommended Value
Lookback Period 1000
Max Breaker Blocks 5
Swing Detection Length 10
Use Displacement Filter true
Displacement Multiplier 2.0
Invalidation Method Close
Higher Timeframes (M30, H1)
For these timeframes, a less strict displacement filter is recommended to capture more significant, but less frequent, breaker blocks.
Setting Recommended Value
Lookback Period 1000
Max Breaker Blocks 5
Swing Detection Length 10
Use Displacement Filter true
Displacement Multiplier 1.0
Invalidation Method Close
🎓 How to Use
Step 1: Identify Breaker Blocks
Once the indicator is loaded, breaker blocks will automatically appear on your chart:
• Green boxes = Bullish breaker blocks (former resistance, now support)
• Red boxes = Bearish breaker blocks (former support, now resistance)
Step 2: Wait for Retest
The most reliable trading opportunities occur when price retests the breaker block zone:
• For bullish breaker blocks, wait for price to come back down to the green zone
• For bearish breaker blocks, wait for price to come back up to the red zone
Step 3: Look for Confluence
Combine breaker blocks with other SMC concepts for higher probability setups:
• Fair Value Gaps (FVG) within the breaker block zone
• Liquidity grabs before the retest
• Break of Structure (BoS) or Change of Character (ChoCH) confirmation
Step 4: Enter the Trade
Bullish Setup:
• Entry: At or near the bullish breaker block zone
• Stop Loss: Below the breaker block
• Take Profit: Previous swing high or higher
Bearish Setup:
• Entry: At or near the bearish breaker block zone
• Stop Loss: Above the breaker block
• Take Profit: Previous swing low or lower
🛡️ Non-Repainting Guarantee
This indicator is 100% non-repainting, meaning:
✅ Breaker blocks never change position after formation
✅ Historical breaker blocks remain in the exact same location indefinitely
✅ Backtesting results are reliable and consistent
🐛 Troubleshooting
Issue: No Breaker Blocks Appearing
Solutions:
• Ensure "Use Displacement Filter" is enabled.
• On M30/H1, try lowering the "Displacement Multiplier" to 1.0.
• Scroll back in history; blocks may not be present on the most recent bars.
Issue: Too Many Breaker Blocks
Solutions:
• Increase "Displacement Multiplier" to 2.5 or 3.0.
• Increase "Swing Detection Length" to 12-15.
• Decrease "Max Breaker Blocks" to 3-4.

Breaker Blocks Screener | Flux Charts💎 GENERAL OVERVIEW
Introducing our new Breaker Blocks Screener! This screener can provide information about the latest breaker blocks in up to 5 tickers. You can also customize the algorithm that finds the breaker blocks and the styling of the screener.
Features of the new Breaker Blocks Screener :
Find Latest Breaker Blocks Accross 5 Tickers
Latest Status, Restests & Volume
Customizable Algoritm / Styling
📌 HOW DOES IT WORK ?
Breaker blocks form when an order block fails, or "breaks". It is often associated with market going in the opposite direction of the broken order block, and they can be spotted by following order blocks and finding the point they get broken, ie. price goes below a bullish order block.
The volume of a breaker block is simply the total volume of the bar that the original order block is broken. Often the higher the breaking bar's volume, the stronger the breaker block is.
This screener then finds breaker blocks accross 5 different tickers, and shows the latest information about them.
Status ->
Far -> The current price is far away from the breaker block.
Approaching ⬆️/⬇️ -> The current price is approaching the breaker block, and the direction it's approaching from.
Inside -> The price is currently inside the breaker block.
Retests -> Retest means the price to invalidate the breaker block, but failed to do so. Here you can see how many times the price retested the breaker block.
For the volume, check the top of the "How Does It Work" section.
🚩UNIQUENESS
This screener can detect latest breaker blocks and give information about them for up to 5 tickers. This saves the user time by showing them all in a dashboard at the same time. The screener shows the number of the retests of the breaker block as an unique trait. Another unique ability of the screener is that it shows the latest valid breaker block's volume in the dashboard.
⚙️SETTINGS
1. Tickers
You can set up to 5 tickers for the screener to scan breaker blocks here. You can also enable / disable them and set their individual timeframes.
2. General Configuration
Zone Invalidations -> Select between Wick & Close price for Order & Breaker Block Invalidation.
Swing Length -> Swing length is used when finding order block formations. Smaller values will result in finding smaller order blocks.

Breaks and Retests - Free990Strategy Description: "Breaks and Retests - Free990"
The "Breaks and Retests - Free990" strategy is based on identifying breakout and retest opportunities for potential entries in both long and short trades. The idea is to detect price breakouts above resistance levels or below support levels, and subsequently identify retests that confirm the breakout levels. The strategy offers an automated approach to enter trades after a breakout followed by a retest, which serves as a confirmation of trend continuation.
Key Components:
Support and Resistance Detection:
The strategy calculates pivot levels based on historical price movements to define support and resistance areas. A lookback range is used to determine these key levels.
Breakouts and Retests:
The system identifies when a breakout occurs above a resistance level or below a support level.
It then waits for a retest of the previously broken level as confirmation, which is often a better entry opportunity.
Trade Direction Selection:
Users can choose between "Long Only," "Short Only," or "Both" directions for trading based on their market view.
Stop Loss and Trailing Stop:
An initial stop loss is placed at a defined percentage away from the entry.
The trailing stop loss is activated after the position gains a specified percentage in profit.
Long Entry:
A long entry is triggered if the price breaks above a resistance level and subsequently retests that level successfully.
The entry condition checks if the breakout was confirmed and if a retest was valid.
The long entry is only executed if the user-selected direction is either "Long Only" or "Both."
Short Entry:
A short entry is triggered if the price breaks below a support level and subsequently retests that level.
The short entry is only executed if the user-selected direction is either "Short Only" or "Both."
sell_condition checks whether the support has been broken and whether the retest condition is valid.
An initial stop loss is placed when the trade is opened to limit the risk if the trade moves against the position.
The stop loss is calculated based on a user-defined percentage (stop_loss_percent) of the entry price.
pinescript
Copy code
stop_loss_price := strategy.position_avg_price * (1 - stop_loss_percent / 100)
For long positions, the stop loss is placed below the entry price.
For short positions, the stop loss is placed above the entry price.
Trailing Stop:
When a position achieves a certain profit threshold (profit_threshold_percent), the trailing stop mechanism is activated.
For long positions, the trailing stop follows the highest price reached, ensuring that some profit is locked in if the price reverses.
For short positions, the trailing stop follows the lowest price reached.
Code Logic for Trailing Stop:
Exit Execution:
The strategy exits the position when the price hits the calculated stop loss level.
This includes both the initial stop loss and the trailing stop that adjusts as the trade progresses.
Code Logic for Exit:
Summary:
Breaks and Retests - Free990 uses support and resistance levels to identify breakouts, followed by retests for confirmation.
Entry Points: Triggered when a breakout is confirmed and a retest occurs, for both long and short trades.
Exit Points:
Initial Stop Loss: Limits risk for both long and short trades.
Trailing Stop Loss: Locks in profits as the price moves in favor of the position.
This strategy aims to capture the momentum after breakouts and minimize losses through effective use of stop loss and trailing stops. It gives the flexibility of selecting trade direction and ensures trades are taken with confirmation through the retest, which helps to reduce false breakouts.
Original Code by @HoanGhetti

Breaker Blocks + Order Blocks confirm [TradingFinder] BBOB Alert🔵 Introduction
In the realm of technical analysis, various tools and concepts are employed to identify key levels on price charts. These tools assist traders in analyzing market trends with greater precision, enabling them to optimize their trading decisions. Among these tools, the Order Block and Breaker Block hold a significant place, serving as effective instruments for analyzing market structure.
🟣 Order Block
An Order Block refers to zones on a chart where large financial institutions and high-volume traders place their orders. Due to the substantial volume of buy or sell orders in these areas, they are often regarded as pivotal points for potential price reversals or temporary pauses in a trend. Order Blocks are particularly crucial when prices react to these zones after a strong market move, acting as strong support or resistance levels.
🟣 Breaker Block
On the other hand, a Breaker Block refers to areas on a chart that previously functioned as Order Blocks but where the price has managed to break through and continue in the opposite direction. These zones are typically recognized as key points where market trends might shift, helping traders identify potential reversal points in the market.
🟣 Overlapping Block (BBOB)
Now, imagine a scenario where these two essential concepts in technical analysis—Order Blocks and Breaker Blocks—overlap on a chart. Although this overlap is not specifically discussed within the ICT (Inner Circle Trader) trading framework, exploring and utilizing this overlap can provide traders with powerful insights into strong support and resistance zones. The combination of these two robust concepts can highlight critical areas in trading, potentially offering significant advantages in making informed trading decisions.
In this article, we will delve into the concept of this overlap, explaining how to utilize it in trading strategies. Additionally, we will analyze the potential outcomes and benefits of incorporating this concept into your trading decisions.
Bullish Overlapping Block (BBOB) :
Bearish Overlapping Block (BBOB) :
🔵 How to Use
The overlap between Order Blocks and Breaker Blocks is a compelling and powerful concept that can help traders identify key levels on the chart with a high probability of success. This overlap is particularly valuable because it combines two well-regarded concepts in technical analysis—zones of high order volume and critical market shifts.
🟣 Here’s how to effectively use this overlap in your trading
1. Dentifying the Overlapping Block : To make the most of the overlap between Order Blocks and Breaker Blocks, begin by identifying these zones separately. Order Blocks are areas where price typically reacts and reverses after a strong market move.
Breaker Blocks are areas where a previous Order Block has been breached, and the price continues in the opposite direction. When these two zones overlap on a chart, it’s crucial to pay close attention to this area, as it represents a high-probability reaction zone.
2. Analyzing the Overlapping Block : After identifying the overlap zone, carefully analyze price action within this region. Candlestick patterns and price behavior can provide essential clues.
If the price reaches this overlap zone and strong reversal patterns such as Pin Bars or Engulfing patterns are observed, it’s likely that this zone will act as a pivotal reversal point. In such cases, entering a trade with confidence becomes more feasible.
3. Entering the Trade : When sufficient signs of price reaction are present in the overlap zone, you can proceed to enter the trade. If the overlap zone is within an uptrend and bullish reversal signals are evident, a long position might be appropriate.
Conversely, if the overlap zone is in a downtrend and bearish reversal signals are observed, a short position would be more suitable.
4. Risk Management : One of the most critical aspects of trading in overlap zones is managing risk. To protect your capital, place your stop loss near the lowest point of the Order Block (for buy trades) or the highest point (for sell trades). This approach minimizes potential losses if the overlap zone fails to hold.
5. Price Targets : After entering the trade, set your price targets based on other key levels on the chart. These targets could include other support and resistance zones, Fibonacci levels, or pivot points.
Bullish Overlapping Block :
Bearish Overlapping Block :
🟣 Benefits of the Overlapping Block Between Order Block and Breaker Block
1. Enhanced Precision in Identifying Key Levels : The overlap between these two zones usually acts as a highly reliable area for price reactions, increasing the accuracy of identifying entry and exit points.
2. Reduced Trading Risk : Given the high importance of the overlap zone, the likelihood of making incorrect decisions is reduced, contributing to overall lower trading risk.
3. Increased Probability of Success : The overlap between Order Blocks and Breaker Blocks combines two powerful concepts, enhancing the likelihood of success in trades, as multiple indicators confirm the importance of the area.
4. Creation of Better Trading Opportunities : Overlap zones often provide traders with more robust trading opportunities, as these areas typically represent strong reversal points in the market.
5. Compatibility with Other Technical Tools : This concept seamlessly integrates with other technical analysis tools such as Fibonacci retracements, trend lines, and chart patterns, offering a more comprehensive market analysis.
🔵 Setting
🟣 Global Setting
Pivot Period of Order Blocks Detector : Enter the desired pivot period to identify the Order Block.
Order Block Validity Period (Bar) : You can specify the maximum time the Order Block remains valid based on the number of candles from the origin.
Mitigation Level Order Block : Determining the basic level of a Order Block. When the price hits the basic level, the Order Block due to mitigation.
Mitigation Level Breaker Block : Determining the basic level of a Breaker Block. When the price hits the basic level, the Breaker Block due to mitigation.
Mitigation Level Overlapping Block : Determining the basic level of a Overlapping Block. When the price hits the basic level, the Overlapping Block due to mitigation.
🟣 Overlapping Block Display
Show All Overlapping Block : If it is turned off, only the last Order Block will be displayed.
Demand Overlapping Block : Show or not show and specify color.
Supply Overlapping Block : Show or not show and specify color.
🟣 Order Block Display
Show All Order Block : If it is turned off, only the last Order Block will be displayed.
Demand Main Order Block : Show or not show and specify color.
Demand Sub (Propulsion & BoS Origin) Order Block : Show or not show and specify color.
Supply Main Order Block : Show or not show and specify color.
Supply Sub (Propulsion & BoS Origin) Order Block : Show or not show and specify color.
🟣 Breaker Block Display
Show All Breaker Block : If it is turned off, only the last Breaker Block will be displayed.
Demand Main Breaker Block : Show or not show and specify color.
Demand Sub (Propulsion & BoS Origin) Breaker Block : Show or not show and specify color.
Supply Main Breaker Block : Show or not show and specify color.
Supply Sub (Propulsion & BoS Origin) Breaker Block : Show or not show and specify color.
🟣 Order Block Refinement
Refine Order Blocks : Enable or disable the refinement feature. Mode selection.
🟣 Alert
Alert Name : The name of the alert you receive.
Alert Overlapping Block Mitigation :
On / Off
Message Frequency :
This string parameter defines the announcement frequency. Choices include: "All" (activates the alert every time the function is called), "Once Per Bar" (activates the alert only on the first call within the bar), and "Once Per Bar Close" (the alert is activated only by a call at the last script execution of the real-time bar upon closing). The default setting is "Once per Bar".
Show Alert Time by Time Zone :
The date, hour, and minute you receive in alert messages can be based on any time zone you choose. For example, if you want New York time, you should enter "UTC-4". This input is set to the time zone "UTC" by default.
🔵 Conclusion
The overlap between Order Blocks and Breaker Blocks represents a critical and powerful area in technical analysis that can serve as an effective tool for determining entry and exit points in trading.
These zones, due to the combination of two key concepts in technical analysis, hold significant importance and can help traders make more confident trading decisions.
Although this concept is not specifically discussed in the ICT framework and is introduced as a new idea, traders can achieve better results in their trades through practice and testing.
Utilizing the overlap between Order Blocks and Breaker Blocks, in conjunction with other technical analysis tools, can significantly improve the chances of success in trading.

Breaker Blocks | Flux Charts💎 GENERAL OVERVIEW
Introducing our new Volumized Breaker Blocks indicator! This new indicator can render breaker blocks with their volumetric information. It's highly customizable with detection, invalidation and style settings.
Features of the new Volumized Breaker Block indicator :
Render Bullish & Bearish Breaker Blocks
Enable / Disable Volumetric Information
Enable / Disable Historic Zones
Visual Customizability
📌 HOW DOES IT WORK ?
Breaker blocks form when an order block fails, or "breaks". It is often associated with market going in the opposite direction of the broken order block, and they can be spotted by following order blocks and finding the point they get broken, ie. price goes below a bullish order block.
The volume of a breaker block is simply the total volume of the bar that the original order block is broken.
🚩UNIQUENESS
This indicator can not only detect breaker blocks, but it can also detect them with their volumetric information. Volumetric information can be crucial when considering an breaker block's strength, which can be a crucial form of confluence in certain trading strategies.
⚙️SETTINGS
1. General Configuration
Volumetric Info -> The volumetric information of the Breaker Blocks will be rendered if activated.
Zone Invalidation -> Select between Wick & Close price for Breaker Block Invalidation.
Swing Length -> Swing length is used when finding breaker block formations. Smaller values will result in finding smaller breaker blocks.

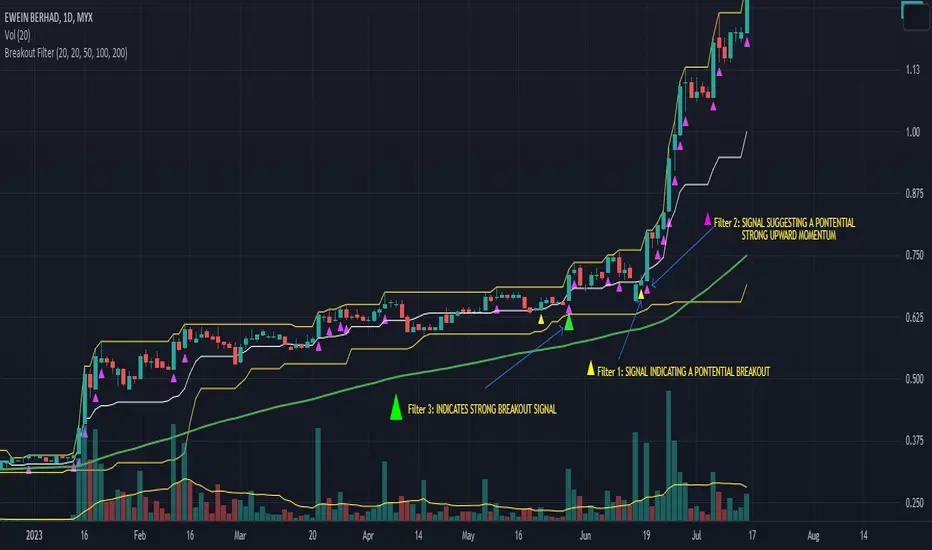
Breakout FilterIntroduction:
The Breakout Filter is a technical analysis indicator designed to identify potential breakout trading opportunities in the financial markets. It combines breakout conditions based on price and volume with the visualization of Exponential Moving Average (EMA) lines. This indicator can be a valuable tool for traders seeking to capture breakout movements while utilizing EMA lines for additional trend analysis.
Indicator Overview:
The Breakout Filter consists of three main filters: Filter 1, Filter 2, and Filter 3. Each filter has its own set of conditions that need to be met for a breakout signal to be generated. Additionally, the indicator plots EMA lines on the chart to provide further insights into the market trend.
Filter 1: Price & Volume Breakout (Default symbol: Tiny Yellow Triangle)
Filter 1 focuses on identifying breakouts based on both price and volume criteria. It considers the following conditions:
- Price Breakout: The close price crosses above the Donchian Channel's middle line, indicating a potential upward breakout.
- Volume Breakout: The trading volume exceeds the moving average of volume, suggesting increased market participation during the breakout.
When both the price breakout and volume breakout conditions are met, Filter 1 generates a signal indicating a potential breakout in the market. This filter helps traders identify significant price movements accompanied by higher trading volumes.
Filter 2: Upper Band Breakout
Filter 2 specifically looks for breakouts above the upper band of the Donchian Channel. This condition suggests a potential strong upward momentum in the market. When the high price exceeds the upper band, Filter 2 generates a signal, indicating a breakout above the recent price range.
Filter 3: Combined Filter 1 and Filter 2
Filter 3 combines the conditions of both Filter 1 and Filter 2. It requires that both Filter 1 and Filter 2 generate signals simultaneously. When this happens, it indicates a strong breakout signal with price and volume confirming the upward momentum.
EMA Lines:
The Breakout Filter with EMA Lines also includes the visualization of Exponential Moving Average (EMA) lines on the chart. EMA is a popular technical indicator used to identify the overall trend in the market. The indicator plots three EMA lines with different periods: EMA1, EMA2, and EMA3. Traders can choose the periods for each EMA line based on their preference and trading strategy.
The EMA lines can provide additional insights into the market trend and potential support or resistance levels. By observing the interaction between the price and the EMA lines, traders can gain a better understanding of the prevailing market sentiment and make informed trading decisions.
How to screen these filters using Trading View Screener
Insert column "DONCHIAN20 UP" and set to "EQUAL HIGH"
Conclusion:
The Breakout Filter with EMA Lines is a comprehensive indicator that combines breakout conditions based on price and volume with the visualization of EMA lines. It helps traders identify potential breakout trading opportunities while providing insights into the market trend. By using this indicator, traders can enhance their trading strategies and potentially improve their trading outcomes.
Please note that this write-up is for informational purposes only and should not be considered as financial advice. Traders should conduct their own analysis and exercise caution when making trading decisions.
Breakouts With Timefilter Strategy [LuciTech]This strategy captures breakout opportunities using pivot high/low breakouts while managing risk through dynamic stop-loss placement and position sizing. It includes a time filter to limit trades to specific sessions.
How It Works
A long trade is triggered when price closes above a pivot high, and a short trade when price closes below a pivot low.
Stop-loss can be set using ATR, prior candle high/low, or a fixed point value. Take-profit is based on a risk-reward multiplier.
Position size adjusts based on the percentage of equity risked.
Breakout signals are marked with triangles, and entry, stop-loss, and take-profit levels are plotted.
moving average filter: Bullish breakouts only trigger above the MA, bearish breakouts below.
The time filter shades the background during active trading hours.
Customization:
Adjustable pivot length for breakout sensitivity.
Risk settings: percentage risked, risk-reward ratio, and stop-loss type.
ATR settings: length, smoothing method (RMA, SMA, EMA, WMA).
Moving average filter (SMA, EMA, WMA, VWMA, HMA) to confirm breakouts.

Breakaway Fair Value Gaps [LuxAlgo]The Breakaway Fair Value Gap (FVG) is a typical FVG located at a point where the price is breaking new Highs or Lows.
🔶 USAGE
In the screenshot above, the price range is visualized by Donchian Channels.
In theory, the Breakaway FVGs should generally be a good indication of market participation, showing favor in the FVG's breaking direction. This is a combination of buyers or sellers pushing markets quickly while already at the highest high or lowest low in recent history.
While this described reasoning seems conventional, looking into it inversely seems to reveal a more effective use of these formations.
When the price is pushed to the extremities of the current range, the price is already potentially off balance and over-extended. Then an FVG is created, extending the price further out of balance.
With this in consideration, After identifying a Breakaway FVG, we could logically look for a reversion to re-balance the gap.
However, it would be illogical to believe that the FVG will immediately mitigate after formation. Because of this, the dashboard display for this indicator shows the analysis for the mitigation likelihood and timeliness.
In the example above, the information in the dashboard would read as follows (Bearish example):
Out of 949 Bearish Breakaway FVGs, 80.19% are shown to be mitigated within 60 bars, with the average mitigation time being 13 bars.
The other 19.81% are not mitigated within 60 bars. This could mean the FVG was mitigated after 60 bars, or it was never mitigated.
The unmitigated FVGs within the analysis window will extend their mitigation level to the current bar. We can see the number of bars since the formation is represented to the right of the live mitigation level.
Utilizing the current distance readout helps to better judge the likelihood of a level being mitigated.
Additionally, when considering these mitigation levels as targets, an additional indicator or analysis can be used to identify specific entries, which would further aid in a system's reliability.
🔶 SETTINGS
Trend Length: Sets the (DC) Trend length to use for Identifying Breakaway FVGs.
Show Mitigation Levels: Optionally hide mitigation levels if you would prefer only to see the Breakaway FVGs.
Maximum Duration: Sets the analysis duration for FVGs, Past this length in bars, the FVG is counted as "Un-Mitigated".
Show Dashboard: Optionally hide the dashboard.
Use Median Duration: Display the Median of the Bar Length data set rather than the Average.

Breakout Trend Trading Strategy - V1Strategy in nutshell:
This strategy is made to be used in daily time-frames. Works better on trending instruments where volume is available. Hence, this is more suitable for trending shares rather than currencies, commodities and indexes where volume data is either not present or not reliable.
Breakout signifies the continuation of trend. Hence, trade in the direction of breakouts. Breakouts are calculated based on high volume and price movement in a day. This will be combined with few other conditions to generate buy and sell signals along with stop and compound targets. Supertrend is used for trend bias. Our buy and sell targets do not directly depend on the bias. But, entry criteria in opposite trend is made much difficult than that of trend direction. Further explanation of method and input parameters are explained below.
Backtesting parameters :
Capital and position sizing : Capital and position sizing parameters are set to test investing 2000 wholly on certain stock without compounding.
Initial Capital : 2000
Order Size : 100% of equity
Pyramiding : 1
ExitOnSignal : If unchecked exit is triggered solely on trailing stop
Trade Direction : Long, Short or All. Short condition is riskier than long conditions and often results in losses as per my observation. On most of the stocks trending up, strategy will not generate any short signals. This is achieved by comparing yearly high lows to previous two years to decide whether to allow short or long entries.
allowImmediateCompound : Applicable only if compounding/pyramiding is enabled in trade. If checked allows to place compounding orders immediately. If unchecked, it waits for stopline to cross order price before placing next compound.
Display Mode :
Targets : Whenever breakout happens, show marker for upTarget and downTarget
TargetChannel : Show up target and downtarget as a channel
Target With Stop : Along with targets, show also stop levels for breakouts
Up Channel : Channel created from UpTarget and respective stops
Down Channel : Channel created from DownTarget and respective stops
ShowTrailingStop : Shows trailing stop and compound lines when there is a trading position.
ShowTargetLevels : Shows Buy Sell target levels along with stop and compound lines. Trades are done as market orders. Hence, target levels are displayed after strategy makes the trade. Since only one order allowed per side without compounding, target, stop and compound levels are shown sometimes even without trade being made. These can be considered as entry levels if there is no existing position.
ShowPreviousLevels : Shows previous buy/sell target levels. When enabled, layout can look messy.
StopMultiplyer: To Set trailing stop loss.
BacktestYears: Number of years to include in backtest
So far my test cases are:
Positive : AAPL, AMZN, TSLA, RUN, VRT, ASX:APT
Negative Test Cases: WPL, WHC, NHC, WOW, COL, NAB (All ASX stocks)
Special test case: WDI
Negative test cases still show losses in backtesting. I have attempted including many conditions to eliminate or reduce the loss. But, further efforts has resulted in reduction in profits in positive cases as well. Still experimenting. Will update whenever I find improvements. Comments and suggestions welcome :)

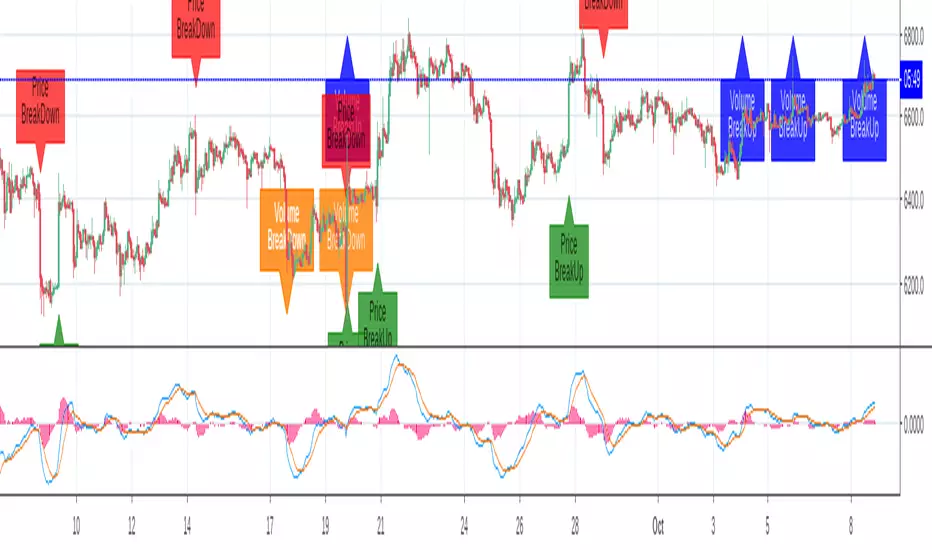
Breakout Labels and Alert For Price And VolumeThe indicator is developped for bitcoin and other cryptocurrencies, whose price and volume changes heavily within minutes. For the other Asset Classes, you may need to adjust the parameters.
Benefits:
1. Since a breakout of price or volume often means the start of a trend, this indicator alerts and displays a label when there is a breakout in price or volume.
2. The indicator prints labels on the chart, which helps people to study the relationship between a breakout and the trend.
3. The volume change is compared to a SMA of volume, instead of the last bar, which can reflect the change compared to a certain period.
4. You can set an alert for breakouts of both price and volume, instead of do it two times.
Settings:
SMA Length for volume: is the length to calculator volume SMA, default:108.
Toggle on/off to display or hide labels for price or volume breakout.
Customize the alert threshhold for price or volume breakout in different time period:3m,5m,15m,30m,60m and other
Use percentageGapForSlopeshape to adjust the relative position of labels.
Style - color settings: Orange for Volume Down, Blue for Volume Up, Red for Price Down, Green for Price Up.
Breakout/Breakdown Indicator (30 Min Range) by InvestYourAsset👉The indicator provided here is a technical analysis indicator for TradingView users that identifies potential breakout and breakdown opportunities on the initial 30-minute range in every trading session.
👉The indicator high and low of the initial 30-minute period and plotting them as horizontal lines on the chart. The high is marked in green line and the low is marked in red line.
📈The indicator then generates buy and sell signals based on whether the current close price crosses above or below the previous 30-minute high and low, respectively.
📢The indicator also has two inputs:
👉 sessionStartHour : The hour at which the trading session begins. The default value is 9, However users can change the time according to their own trading style.
👉 sessionStartMinute : The minute at which the trading session begins. The default value is 0.
These inputs can be used to adjust the indicator to the specific trading session that you are interested in.
✅How to use the Indicator:
👉To use the 30 Minute Breakout/Breakdown Indicator, simply add it to your chart and configure the inputs to your liking. Once the indicator is added to the chart, it will plot the 30-minute high and low as horizontal lines, as well as generate buy and sell signals based on the current close price.
✅Here is a step-by-step guide:
📈Open TradingView and select the chart that you want to add the indicator to.
📈Click on the "Indicators" tab and search for "30 Minute Breakout/Breakdown Indicator by InvestYourAsset".
📈Click on the indicator to add it to your chart.
📈Configure the inputs to your liking. The default values are typically fine, but you can experiment with different values to see what works best for you.
📈Once you are satisfied with the settings, click on the "Apply" button.
📈The indicator will now be displayed on your chart. You will see two horizontal lines representing the previous 30-minute high and low, as well as triangles representing buy and sell signals.
✅How to interpret the signals:
📈Buy signal : A buy signal is generated when the current close price crosses above the previous 30-minute high. This suggests that the price is likely to continue moving higher in the short term.
📈Sell signal : A sell signal is generated when the current close price crosses below the previous 30-minute low. This suggests that the price is likely to continue moving lower in the short term.
👉Traders should remember that the present indicator is just one tool that can be used to identify potential trading opportunities. It is important to use other technical analysis tools and risk management techniques to confirm your trading signals before entering any trades.
✅Things to consider while using the indicator:
📈Look for buy signals in an uptrend and sell signals in a downtrend. This will increase the likelihood of your trades being successful.
📈Place your stop losses below the previous 30-minute low for buy signals and above the previous 30-minute high for sell signals. This will help to limit your losses if the trade goes against you.
📈Consider taking profits at key resistance and support levels. This will help you to lock in your profits and avoid giving them back to the market.
Follow us for timely updates regarding indicators that we may publish in future and give it a like if you appreciate the indicator.

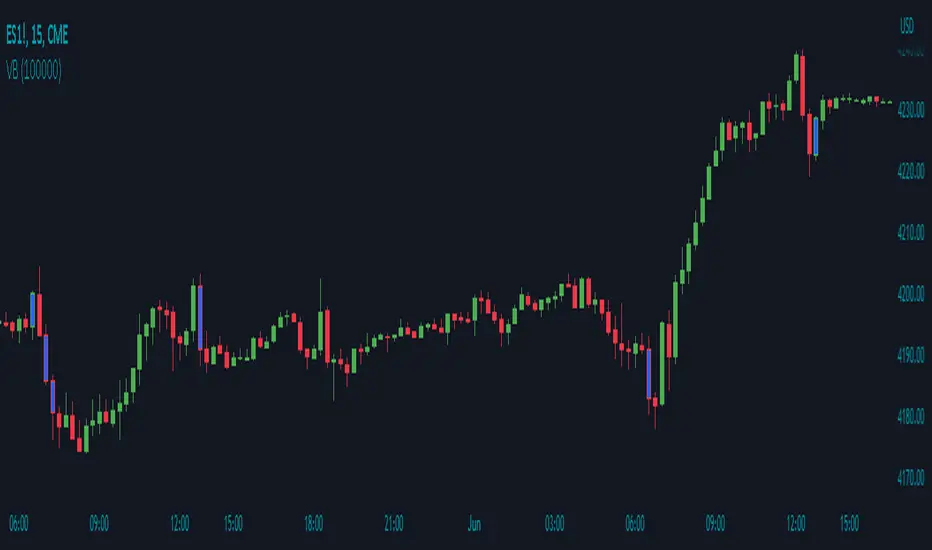
Volume Breakout by Chosen VolumeDescription:
The Volume Breakout indicator (VB) is a technical analysis tool that highlights candles with significant trading volume. It helps traders identify potential breakout periods characterized by high volume activity.
How it Works:
The Volume Breakout indicator compares the volume of each candle with a user-defined minimum volume threshold. If the volume of a candle exceeds or is equal to the specified minimum volume requirement, the indicator identifies it as a volume breakout and marks it accordingly.
Usage:
To effectively utilize the Volume Breakout indicator, follow these steps:
1. Apply the VB indicator to your chart by adding it from the available indicators.
2. Customize the minimum required volume parameter according to your trading preferences. This parameter determines the threshold volume level that a candle must meet or exceed to be considered a breakout candidate.
3. Observe the candles on the chart:
- Candles that meet or exceed the minimum required volume are highlighted with a specific color (yellow by default), indicating potential breakout periods.
4. Pay attention to the volume breakout indications within the candles, as they suggest periods of increased trading activity.
5. Analyze the price action accompanying the volume breakout candles. Breakouts often indicate a surge in buying or selling pressure, potentially leading to significant price moves or trend reversals.
6. Combine the analysis of volume breakout candles with other technical analysis tools, such as trend lines, support and resistance levels, or indicators, to confirm potential trade setups.
7. Implement appropriate risk management strategies, including setting stop-loss orders and position sizing, to manage your trades effectively and protect your capital.
Breakout/Consolidation Filter [jwammo12]This indicator acts as a filter for determining recent breakouts and consolidations in price.
The first way to use the indicator is with a short lookback period. It then will paint yellow most of the time, with red marking a sharp recent breakdown in price and green marking a sharp breakout in price. This can be used to follow the breakout, or to fade it.
The second way to use the indicator is a long lookback period. This will change the output to be colored most of the time, with small sections of yellow. The yellow indicators areas where price has not made a large move in a while, or periods of consolidation. This can then be used to plan reversal trades, or follows any new trend.
The blue line is a Average True Range Percent Rank, when this value is high, it means that breakouts are less likely to trigger, since price has been moving rapidly recently, and a relative breakout would have to be a large move. When the line is low, breakouts will trigger more easily, since price has been moving relatively slowly

Breakout ScannerThis is a Breakout Scanner that shows you the immediate trend across 4 higher timeframes for up to 10 different tickers. It calculates a score from 1 to 3 for bullish and -1 to -3 for bearish based on where price is currently at compared to the previous higher timeframe’s candle levels.
When price is breaking out of the previous higher timeframe candle’s range, then it will have a score of 3 for bullish breakout or -3 for bearish breakout. When price is above the high or below the low of multiple different higher timeframe candles, you can expect price to continue the breakout and move to a new area of price range.
The brighter red or green the color is, the stronger the trend is on that timeframe. When it shows a bright green or red box on the far right side of a ticker, it is notifying you that the ticker is bullish or bearish on all timeframes and trending strongly, so switch over to that chart and look to trade in the direction of that trend.
The tickers, colors and time frames can be customized to suit your preference and you can also turn off as many tickers or time frames as you’d like if you want less tickers or time frames to show up on the indicator. It also includes alerts for when all timeframes are bullish or all timeframes are bearish for one ticker.
Make sure to keep each timeframe set to a timeframe that is higher than your chart timeframe.
Bullish Scoring & Colors
If the current candle close is above the midline of the higher time frame candle, it is given a score of 1 and a dark green background. If the current candle close is above the higher timeframe candle body, then it is given a score of 2 and a medium green background. If the current candle close is above the high of the higher time frame candle, it is given a score of 3 and a bright green background.
The higher the score the stronger the bullish trend and the brighter green the color will be.
Bearish Scoring & Colors
If the current candle close is below the midline of the higher timeframe candle, it is given a score of -1 and a dark red background. If the current candle close is below the higher timeframe candle body, then it is given a score of -2 and a medium red background. If the current candle close is below the low of the higher timeframe candle, it is given a score of -3 and a bright red background.
The lower the score, the stronger the bearish trend and the brighter red the color will be.
Total Score Display
On the right side of the indicator table, there is a column that displays the total score by adding all the scores together so you can easily tell the overall strength of the trend across all timeframes. Wait for the trend score to be at least 75% of the possible score to trade so you can ensure you are only trading very strong trends and increase your probability of winning your trade. The total score will update according to how many time frames you have enabled in the settings. You can also turn on or off the total score count if you prefer. The default setting is off.
All Timeframe Trends Agree
When all of the timeframes that you have turned on are in the same direction at the same time, a green or red box will appear on the far right side of the scanner. This is a visual cue that lets you know the strongest trending markets without having to read any of the numbers. Make sure to check out the charts for the markets that have a green or red box on the far right side and look for potential trend trading opportunities.
Alerts
You can set alerts for when all time frames for a certain ticker are bullish or bearish. If you have some time frames turned off at the time of creating your alerts, then it will only require all time frames that are on to be all bullish or bearish to generate an alert. Make sure to set your alerts to once per bar close to ensure you don’t get premature alerts that aren’t yet valid.
Best Way To Use The Scanner
For best results, make sure you wait for the trend to show all bullish or all bearish at the same time and then look to trade in the direction of the strong trend. If you can be patient enough to do that, you will increase the probability of winning your trade because you are trading with the direction of the overall higher timeframe trend when the market is trending strongly and making new highs or lows.
When one of the markets in the scanner shows all timeframes trending, go to that chart and see how price action is reacting to the previous higher timeframe candle levels. You can see those levels easily by adding our Higher Timeframe Candle Levels indicator to your chart and using the same timeframes as your Breakout Scanner is using.
If price is holding the higher timeframe candle levels well, then look to place trades in the direction of the trend that the Breakout Scanner is showing.
Other Indicators To Pair This With
Use this in combination with our Higher Timeframe Candle Levels indicator so you can see all of these levels being used to calculate the trend strength scores and watch how price reacts to those levels. You should also use our Trend Strength Indicator to easily read the historical trends of price compared to the higher timeframes and use those trends to guide you on when to trade and which direction to trade.
Trend Strength Indicator, Higher Timeframe Candle Levels and the Breakout Scanner all use the same levels to calculate the trend scores so they are designed to work all together to help you quickly be able to read a chart and find what direction to trade in.
