Premium/Discount Zones with Confirmation Signals📌 Indicator Description: Premium/Discount Zones with Confirmed Signals
This indicator identifies dynamic Premium, Discount, and Equilibrium zones based on recent swing highs and lows, helping traders visualize where price is considered expensive, cheap, or fair value. It’s designed for Smart Money Concepts (SMC), ICT-style trading, and anyone who values precision in zone-based analysis.
🔍 Key Features
Swing-Based Zones: Automatically detects swing highs/lows over a customizable lookback period (default: 48 bars — equivalent to 2 days on a 1-hour chart).
Premium & Discount Levels: Define overbought and oversold zones using percentage inputs (default: 25%).
Equilibrium Band (middle): Highlights the no-trade value zone with adjustable width (default: 5%).
Signal Engine: Generates trade signals based on two styles:
Bounce: Reversal signals when price reacts to a zone and confirms direction.
Breakout: Continuation signals when price breaks through a zone with momentum.
Trade Type Selector: Choose between Bounce, Breakout, or Both from the input menu.
Signal Filtering: Limits signals to one per direction at a time to reduce noise.
Visual Styling: Toggle between colored or monochrome themes for clean charting.
🧠 How It Works
Buy signals appear when price confirms strength from the discount zone or breaks above the premium zone.
Sell signals appear when price confirms weakness from the premium zone or breaks below the discount zone.
All signals include a built-in 3-bar confirmation delay to reduce false triggers.
🎯 Ideal For
Traders using SMC, ICT, or price action strategies
Zone-based scalping, swing trading, or intraday setups
Visualizing market structure and value areas with clarity
I hope you find this useful — and wish you Happy Trades!
Cari dalam skrip untuk "breakout"

Algo Trading Signals - Buy/Sell System# 📊 Algo Trading Signals - Dynamic Buy/Sell System
## 🎯 Overview
**Algo Trading Signals** is a sophisticated intraday trading indicator designed for algorithmic traders and active day traders. This system generates precise buy and sell signals based on a dynamic box breakout strategy with intelligent position management, add-on entries, and automatic target adjustment.
The indicator creates a reference price box during a specified time window (default: 9:15 AM - 9:45 AM IST) and generates high-probability signals when price breaks out of this range with confirmation.
---
## ✨ Key Features
### 📍 **Smart Signal Generation**
- **Primary Entry Signals**: Clear buy/sell signals on confirmed breakouts above/below the reference box
- **Confirmation Bars**: Reduces false signals by requiring multiple bar confirmation before entry
- **Cooldown System**: Prevents overtrading with configurable cooldown periods between trades
- **Add-On Positions**: Automatically identifies optimal pullback entries for scaling into positions
### 📦 **Dynamic Reference Box**
- Creates a high/low range during your chosen time window
- Automatically updates after each successful trade
- Visual box display with color-coded boundaries (red=resistance, green=support)
- Mid-level reference line for market structure analysis
### 🎯 **Intelligent Position Management**
- **Automatic Target Calculation**: Sets profit targets based on average move distance
- **Add-On System**: Up to 3 additional entries on optimal pullbacks
- **Position Tracking**: Monitors active trades and remaining add-on capacity
- **Auto Box Shift**: Adjusts reference box after target hits for continued trading
### 📊 **Visual Clarity**
- **Color-Coded Labels**:
- 🟢 Green for BUY signals
- 🔴 Red for SELL signals
- 🔵 Blue for ADD-ON buys
- 🟠 Orange for ADD-ON sells
- ✓ Yellow for Target hits
- **TP Level Lines**: Dotted lines showing current profit targets
- **Hover Tooltips**: Detailed information on entry prices, targets, and add-on numbers
### 📈 **Real-Time Statistics**
Live performance dashboard showing:
- Total buy and sell signals generated
- Number of add-on positions taken
- Take profit hits achieved
- Current trade status (LONG/SHORT/None)
- Cooldown timer status
### 🔔 **Comprehensive Alerts**
Built-in alert conditions for:
- Primary buy entry signals
- Primary sell entry signals
- Add-on buy positions
- Add-on sell positions
- Buy take profit hits
- Sell take profit hits
---
## 🛠️ Configuration Options
### **Time Settings**
- **Box Start Hour/Minute**: Define when to begin tracking the reference range
- **Box End Hour/Minute**: Define when to lock the reference box
- **Default**: 9:15 AM - 9:45 AM (IST) - Perfect for Indian market opening range
### **Trade Settings**
- **Target Points (TP)**: Average move distance for profit targets (default: 40 points)
- **Breakout Confirmation Bars**: Number of bars to confirm breakout (default: 2)
- **Cooldown After Trade**: Bars to wait after closing position (default: 3)
- **Add-On Distance Points**: Minimum pullback for add-on entry (default: 40 points)
- **Max Add-On Positions**: Maximum additional positions allowed (default: 3)
### **Display Options**
- Toggle buy/sell signal labels
- Show/hide trading box visualization
- Show/hide TP level lines
- Show/hide statistics table
---
## 💡 How It Works
### **Phase 1: Box Formation (9:15 AM - 9:45 AM)**
The indicator tracks the high and low prices during your specified time window to create a reference box representing the opening range.
### **Phase 2: Breakout Detection**
After the box is locked, the system monitors for:
- **Bullish Breakout**: Price closes above box high for confirmation bars
- **Bearish Breakout**: Price closes below box low for confirmation bars
### **Phase 3: Signal Generation**
When confirmation requirements are met:
- Entry signal is generated with clear visual label
- Target price is calculated (Entry ± Target Points)
- Position tracking activates
- Cooldown timer starts
### **Phase 4: Position Management**
During active trade:
- **Add-On Logic**: If price pulls back by specified distance but stays within favorable range, additional entry signal fires
- **Target Monitoring**: Continuously checks if price reaches TP level
- **Box Adjustment**: After TP hit, box automatically shifts to new range for next opportunity
### **Phase 5: Trade Exit & Reset**
On target hit:
- Position closes with TP marker
- Statistics update
- Box repositions for next setup
- Cooldown activates
- System ready for next signal
---
## 📌 Best Use Cases
### **Ideal For:**
- ✅ Intraday breakout trading strategies
- ✅ Algorithmic trading systems (via alerts/webhooks)
- ✅ Opening range breakout (ORB) strategies
- ✅ Index futures (Nifty, Bank Nifty, Sensex)
- ✅ High-liquidity stocks with clear ranges
- ✅ Automated trading bots
- ✅ Scalping and day trading
### **Markets:**
- Indian Stock Market (NSE/BSE)
- Futures & Options
- Forex pairs
- Cryptocurrency (adjust timing for 24/7 markets)
- Global indices
---
## ⚙️ Integration with Algo Trading
This indicator is **algo-ready** and can be integrated with automated trading systems:
1. **TradingView Alerts**: Set up alert conditions for each signal type
2. **Webhook Integration**: Connect alerts to trading platforms via webhooks
3. **API Automation**: Use with brokers supporting TradingView integration (Zerodha, Upstox, Interactive Brokers, etc.)
4. **Signal Data Access**: All signals are plotted for external data retrieval
---
## 📖 Quick Start Guide
1. **Add Indicator**: Apply to your chart (works best on 1-5 minute timeframes)
2. **Configure Time Window**: Set your desired box formation period
3. **Adjust Parameters**: Tune confirmation bars, targets, and add-on settings to your trading style
4. **Set Alerts**: Create alert conditions for automated notifications
5. **Backtest**: Review historical signals to validate strategy performance
6. **Go Live**: Enable alerts and start receiving real-time trading signals
---
## ⚠️ Risk Disclaimer
This indicator is a **tool for analysis** and does not guarantee profits. Trading involves substantial risk of loss. Always:
- Use proper position sizing
- Implement stop losses (not included in this indicator)
- Test thoroughly before live trading
- Understand market conditions
- Never risk more than you can afford to lose
- Consider your risk tolerance and trading experience
**Past performance does not indicate future results.**
## 🔄 Version History
**v1.0** - Initial Release
- Dynamic box formation system
- Confirmed breakout signals
- Add-on position management
- Visual signal labels and statistics
- Comprehensive alert system
- Auto-adjusting target boxes
---
## 📞 Support & Feedback
If you find this indicator helpful:
- ⭐ Please leave a like/favorite
- 💬 Share your feedback in comments
- 📊 Share your results and improvements
- 🤝 Suggest features for future updates
---
## 🏷️ Tags
`breakout` `daytrading` `signals` `algo` `automated` `intraday` `ORB` `opening-range` `buy-sell` `scalping` `futures` `nifty` `banknifty` `algorithmic` `box-strategy`
*Remember: The best indicator is combined with proper risk management and trading discipline.* Use it at your own rist, not as financial advie

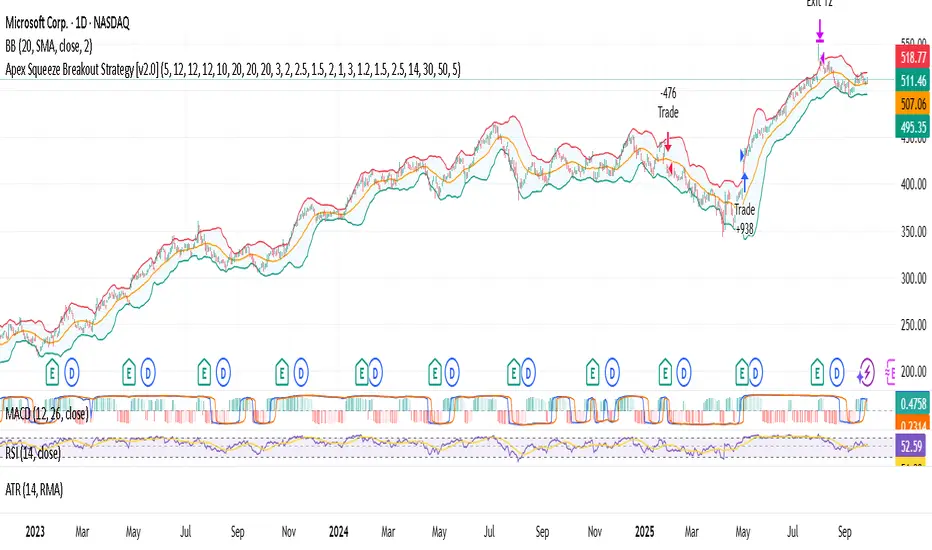
Apex Squeeze Breakout Strategy (v1.0 by SKC)The Apex Squeeze Breakout Strategy is a powerful momentum-based system designed to capture explosive price moves following periods of low volatility compression (squeeze). It combines five key conditions to validate high-probability breakouts:
🔵 TTM Squeeze Detection using Bollinger Bands and Keltner Channels
🔊 Volume Spike Confirmation relative to a moving average
📈 Breakout Trigger above/below a recent high/low range
💪 Momentum Acceleration using percentage change over time
♻️ RSI Recovery / Overbought Logic to confirm shift in strength
The strategy includes:
Configurable swing/day trading modes
Dynamic ATR-based Stop Loss and TP1/TP2 system
Modular input structure for easy customization
Clear entry/exit visual markers and trade zones
It’s designed for disciplined traders who want to catch high-energy moves after consolidation, suitable for both intraday and swing setups.
Nirvana True Duel전략 이름
열반의 진검승부 (영문: Nirvana True Duel)
컨셉과 철학
“열반의 진검승부”는 시장 소음은 무시하고, 확실할 때만 진입하는 전략입니다.
EMA 리본으로 추세 방향을 확인하고, 볼린저 밴드 수축/확장으로 변동성 돌파를 포착하며, OBV로 거래량 확인을 통해 가짜 돌파를 필터링합니다.
전략 로직
매수 조건 (롱)
20EMA > 50EMA (상승 추세)
밴드폭 수축 후 확장 시작
종가가 상단 밴드 돌파
OBV 상승 흐름 유지
매도 조건 (숏)
20EMA < 50EMA (하락 추세)
밴드폭 수축 후 확장 시작
종가가 하단 밴드 이탈
OBV 하락 흐름 유지
진입·청산
손절: ATR × 1.5 배수
익절: 손절폭의 1.5~2배에서 부분 청산
시간 청산: 설정한 최대 보유 봉수 초과 시 강제 청산
장점
✅ 추세·변동성·거래량 3중 필터 → 노이즈 최소화
✅ 백테스트·알람 지원 → 기계적 매매 가능
✅ 5분/15분 차트에 적합 → 단타/스윙 트레이딩 활용 가능
주의점
⚠ 횡보장에서는 신호가 적거나 실패 가능
⚠ 수수료·슬리피지 고려 필요
📜 Nirvana True Duel — Strategy Description (English)
Name:
Nirvana True Duel (a.k.a. Nirvana Cross)
Concept & Philosophy
The “Nirvana True Duel” strategy focuses on trading only meaningful breakouts and avoiding unnecessary noise.
Nirvana: A calm, patient state — waiting for the right opportunity without emotional trading.
True Duel: When the signal appears, enter decisively and let the market reveal the outcome.
In short: “Ignore market noise, trade only high-probability breakouts.”
🧩 Strategy Components
Trend Filter (EMA Ribbon): Stay aligned with the main market trend.
Volatility Squeeze (Bollinger Band): Detect volatility contraction & expansion to catch explosive moves early.
Volume Confirmation (OBV): Filter out false breakouts by confirming with volume flow.
⚔️ Entry & Exit Conditions
Long Setup:
20 EMA > 50 EMA (uptrend)
BB width breaks out from recent squeeze
Close > Upper Bollinger Band
OBV shows positive flow
Short Setup:
20 EMA < 50 EMA (downtrend)
BB width breaks out from recent squeeze
Close < Lower Bollinger Band
OBV shows negative flow
Risk Management:
Stop Loss: ATR × 1.5 below/above entry
Take Profit: 1.5–2× stop distance, partial take-profit allowed
Time Stop: Automatically closes after max bars held (e.g. 8h on 5m chart)
✅ Strengths
Triple Filtering: Trend + Volatility + Volume → fewer false signals
Mechanical & Backtestable: Ideal for objective trading & performance validation
Adaptable: Works well on Bitcoin, Nasdaq futures, and other high-volatility markets (5m/15m)
⚠️ Things to Note
Low signal frequency or higher failure rate in sideways/range markets
Commission & slippage should be factored in, especially on lower timeframes
ATR multiplier and R:R ratio should be optimized per asset

Inakis-BB-Stoch-ATR-ADX StrategyStrategy Description
This advanced trading strategy combines multiple technical indicators to identify high-probability breakout opportunities in trending markets. The system uses a multi-layered filtering approach to ensure only the strongest signals trigger trades.
Key Components:
Primary Signals:
Bollinger Bands Breakout: Identifies price extremes when price breaks below the lower band (buy) or above the upper band (sell)
Stochastic Oscillator: Confirms oversold (<30) and overbought (>70) conditions
ADX Filter: Ensures sufficient trend strength is present (ADX > 20)
ATR Volatility Filter: Trades only during periods of adequate volatility
Advanced Features:
DMI Higher Timeframe Analysis: Incorporates directional movement from higher timeframes (default 1H) to align trades with the dominant trend
Volume Confirmation: Requires above-average volume for signal validation
Cooldown Period: Prevents overtrading by enforcing minimum bars between signals
Visual Feedback: Color-coded background based on higher timeframe trend direction
Risk Management:
Fixed position sizing with customizable contract size
Predefined Stop Loss (default 500 points) and Take Profit (default 1000 points) levels
Clear risk-reward ratio of 1:2
Trading Logic:
Long Entry: Price breaks below BB lower band + Stochastic < 30 + Higher TF bullish trend
Short Entry: Price breaks above BB upper band + Stochastic > 70 + Higher TF bearish trend
All entries require confirmation from ADX, ATR, and volume filters
Customization:
All parameters are fully adjustable through the input panel, allowing traders to optimize the strategy for different markets and timeframes. Each filter can be individually enabled/disabled for testing and optimization purposes.
This strategy is designed for trending markets and performs best on liquid instruments with clear directional moves.

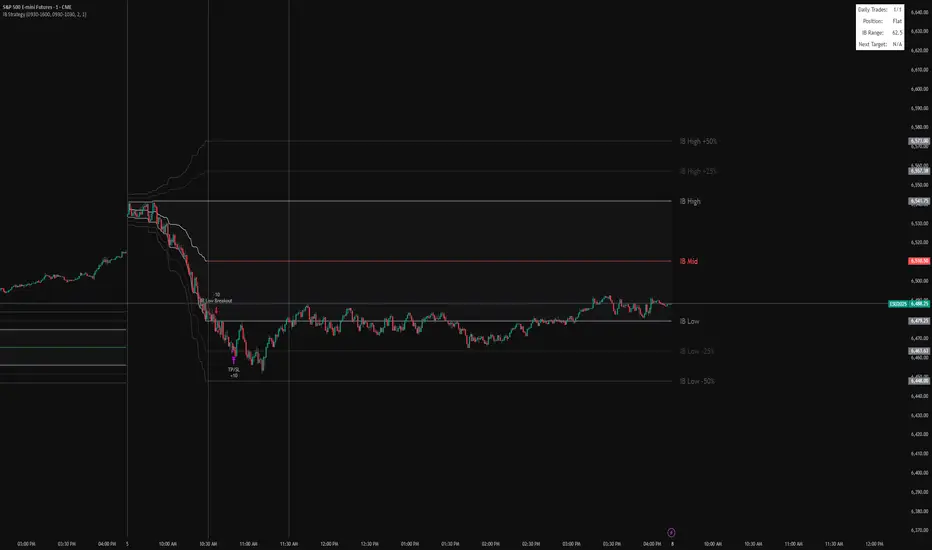
IB BreakoutIt marks the IB range (high, low, midpoint) from a chosen session window (default 9:30–10:30).
It plots the IB lines, midpoint (colored based on close), and extension levels (+/–25% and 50%).
After the IB session ends, it looks for breakouts:
Long if price closes above IB high.
Short if price closes below IB low.
Each trade targets the 25% extension in the breakout direction, with an optional stop at the opposite IB level.
It limits the number of trades per day and displays info (trades, position, IB range, next target) in a table.
Smart Money Price Action ProSmart Money Price Action Pro - Smart Money and Price Action Dynamic Toolkit
The Smart Money Price Action Pro is designed to bring together multiple layers of market analysis into a single, cohesive framework, combining trend identification and consolidation detection in an actionable format. While individual indicators can provide useful insights, they often work in isolation. This toolkit integrates market flow detection, range analytics, and adaptive visualization into one system, allowing traders to see the bigger picture without piecing together multiple disconnected tools.
Building on principles from institutional trading behaviors, the toolkit gives traders a clearer picture of where “smart money” may be entering or exiting the market. Its design emphasizes confluence: signals from multiple independent modules overlap to create higher conviction setups, offering a structured edge when planning entries, exits, and risk levels.
At its core, the toolkit addresses the duality of market conditions: trending versus ranging. By offering a combination of trend-following signals and contrarian insights, it helps traders operate with a deeper understanding of market structure. While it provides actionable signals and visual guidance, it is intended as an assistive system, helping traders make more informed decisions rather than serving as a single source of truth.
Key Modules
1. Smart Money Signal Module
The Smart Money Signal Module identifies potential institutional activity by analyzing price swings and momentum shifts. Using configurable swing detection, it highlights potential reversal or continuation zones, expressed as adaptive zones around key market levels.
Signals are augmented with trend-colored candle overlays, offering immediate guidance on market bias. Bullish and bearish zones are clearly marked, while continuation and reversal markers help distinguish between trend shifts and market noise.
At its core, the engine applies swing detection combined with a sensitivity filter to track directional momentum across recent bars. This allows it to pinpoint bullish pivots (where downside momentum fades and strength returns) and bearish pivots (where upside momentum collapses). Once a pivot is confirmed, the system draws flow lines that map the breakout and classify it as either continuation or reversal, depending on broader market bias.
Momentum zones are then plotted to show areas where buyers stepped in with strength or sellers forced price lower. These levels extend forward dynamically, shifting in real time as new data forms. Zones change color the moment they break, visually confirming whether market structure has held or failed. Gradient shading highlights periods of extreme pressure, giving traders a clear visual of when momentum surges into overbought or oversold territory.
Instead of simply showing trend direction, this module also maps accumulation and distribution zones tied to institutional flows. When combined with the Range Module, these zones become more meaningful — for example, when institutional accumulation aligns with a breakout from consolidation.
Practical Use: Traders can use these signals to align trades with institutional flows. For example, entering a long position near a bullish accumulation zone or managing risk when bearish distribution areas form. By combining these insights with higher timeframe analysis, traders can filter out false signals and improve decision-making.
2. Range Detection Module
The Range Detection engine continuously monitors price action to flag when markets transition into consolidation phases. Ranges are defined not just by flat price action, but by a measurable contraction in volatility, repeated touches of boundary levels, and the clustering of traded volume around a central equilibrium point.
Once a valid range is identified, the system assigns a compression strength score (0–100). This score reflects how cleanly defined and structurally sound the consolidation is—higher scores indicate tighter boundaries and stronger evidence of accumulation or distribution.
Breakout tendencies are modeled dynamically. The system updates a forward-looking bias by incorporating:
Boundary time distribution – how often price presses against upper vs. lower edges
Historical breakout patterns – probability benchmarks derived from structurally similar ranges
Volume skew – whether traded volume leans toward buyers or sellers inside the range
Momentum alignment – auxiliary filters such as slope-based oscillators that indicate when energy is building for a directional move
The result is a live breakout forecast that evolves bar by bar as the range matures. Each active range carries a visual strength meter plotted above the consolidation zone, quantifying both compression and breakout potential in real time.
The module also supports range memory, preserving completed consolidations even after a breakout. This allows traders to review the prior structure for post-analysis or to track whether price respects the boundaries of the old range as support or resistance going forward.
Practical Use : Traders can use these ranges to anticipate breakout direction or step aside when conditions are unclear. A tight consolidation near a bullish zone, for instance, often signals a potential long opportunity, while overlapping bearish flows warn of false breakouts.
Integrated Workflow
The strength of the toolkit lies in its synergy. Each module is effective on its own, but the real advantage comes when their signals align.
A typical workflow may include:
Assessing the market trend using the Smart Money Signal Module and its trend-colored overlays
Identifying consolidation and breakout zones with the Range Detection Module
Watching for confluences: institutional accumulation aligning with range compression, or dashboard bias matching local setups
Executing trades with structured confidence, using these layered confirmations rather than relying on a single trigger
This integrated workflow streamlines decision-making and avoids the conflicting signals that can occur when combining unrelated indicators.
Additional Features
Adaptive Visualization : Dynamic zones and trend overlays adjust to volatility, keeping charts clear and focused
Analytics Dashboard : A compact summary panel shows active zones, bullish vs bearish flow counts, and current bias, giving context at a glance
Instead of simply adding more signals, the dashboard provides a meta-layer of analysis — context, bias, and flow strength — helping traders manage risk and stay aligned with broader market conditions.
Use Cases
Trend Confluence : Entering trades in line with prevailing smart money flows while filtering out counter-trend setups
Breakout Trading : Using the Range Detection Module to anticipate breakout zones and confirming direction with institutional flow signals
Contrarian Reversal Trades : Targeting accumulation/distribution zones where both modules indicate potential reversals
Each use case demonstrates how layered confluence creates clarity and conviction, making the toolkit a strong complement to other forms of technical analysis.
Conclusion
The Smart Money Signals Toolkit simplifies complex market analysis into actionable, visually intuitive insights. While standalone indicators provide value, this toolkit goes further by combining smart money flows, range detection, adaptive zones, and dashboard analytics into one cohesive system.
It doesn’t just generate buy/sell markers — it shows why a setup matters, where it is occurring, and how it aligns with broader conditions. This allows traders to operate with greater clarity, structure, and discipline.
Risk Disclaimer : This toolkit and its features are for educational and informational purposes only. Past performance does not guarantee future results. All suggested use cases are theoretical and should be applied with proper risk management.

Opening Range Breakout🚀 ORB – Optimized for Peak Performance 🚀
Catch the morning breakout moves with zero guesswork!
This plug-and-play Opening Range Breakout strategy is fully optimized ; no settings to tweak, no parameters to adjust.
✅ Pre-tuned for U.S. market open on 5-minute charts.
✅ Built-in risk management with stop loss, take profit, and one trade per day.
✅ Auto exit before market close to lock in gains and avoid late-day whipsaws.
Perfect for day traders who want to focus on execution, not experimentation.
Just load it, trade it, and let the strategy do the heavy lifting.
⚠ Disclaimer : Educational use only. Always backtest and paper trade before using with real capital.
Key Features
• No Guesswork – Pre-set with the best-performing configuration.
• Opening Range Breakout Logic – Identifies the early range of the market and trades strong breakouts.
• Strict Risk Management – Stop loss and take profit levels are automatically calculated from the range size.
• One Trade Per Day – Prevents overtrading and keeps the focus on quality setups.
• End-of-Day Auto Exit – Closes all open trades at 3:30 PM EST to avoid late-session volatility.
How It Works
1. Opening Range Calculation: At market open (9:30 AM EST), the strategy monitors opening range.
2. Breakout Entry: Monitors the breakouts with moment.
3. Risk & Profit Targets: Stop loss and take profit are calculated automatically based on the range size. Risk-to-reward ratio is set for balanced performance.
4. Trade Control: Only one trade per day (either long or short). All trades are force-closed at 3:30 PM EST.

BTC/USD Confluence Breakout Pro – IST EditionBTC/USD Confluence Breakout Pro – IST Edition is a multi-factor breakout trading system designed for intraday and swing traders.
It combines trend, momentum, price action, volume, and candlestick analysis with time-based volatility windows to deliver high-probability Buy/Sell signals.
Key Features:
Trend Filters: EMA 9/21 crossover + optional EMA 200 bias filter.
Price Action Breakouts: Detects closes above/below the last N bars’ range.
Candlestick Patterns: Bullish/Bearish engulfing, hammer, and shooting star.
Momentum Indicators: RSI (14) with configurable thresholds, MACD (12/26/9).
Volume Confirmation: Volume spike vs 20-period SMA.
IST Breakout Windows: Highlights Early London, London–US Overlap, and US Open momentum periods (Hyderabad/IST time). Optionally restricts signals to these windows.
Risk Management: ATR-based stop-loss + auto-plotted 1R, 2R, and 3R take-profit levels.
Visual Aids: EMA plots, bar coloring, shaded volatility windows, and clear entry/exit labels.
Alerts: Configurable alerts for both Buy and Sell signals.
Best Use:
Apply on 1m–15m charts for intraday trading or 1H–4H for swings.
Works best during high-volatility IST windows (London–US overlap & US open).
Ideal for BTC/USD but adaptable to other crypto or forex pairs.

Trend Range Detector (Zeiierman)█ Overview
Trend Range Detector (Zeiierman) is a market structure tool that identifies and tracks periods of price compression by forming adaptive range boxes based on volatility and price movement. When prices remain stable within a defined band, the script dynamically draws a range box; when prices break out of that structure, the box highlights the breakout in real-time.
By combining a volatility-based envelope with a custom weighted centerline, this tool filters out noise and isolates truly stable zones — providing a clean framework for traders who focus on accumulation, distribution, breakout anticipation, and reversion opportunities.
Whether you're range trading, spotting trend consolidations, or looking for volatility contractions before major moves, the Trend Range Detector gives you a mathematically adaptive, visually intuitive structure that maps the heartbeat of the market.
█ How It Works
⚪ Range Formation Engine
The core of this indicator revolves around two conditions:
Distance Filter: The maximum distance between all recent closes and a dynamic centerline must remain within a volatility envelope.
Volatility Envelope: Based on an ATR(2000) multiplied by a user-defined factor to account for broader market volatility trends.
If both conditions are satisfied over the most recent length bars, a range box is drawn to visually anchor the zone.
⚪ Dynamic Breakout Coloring
When price breaks out of the top or bottom of the active range box, the box color shifts in real-time:
Blue Boxes represent areas where price has remained within a defined volatility envelope over a sustained number of bars. These zones reflect stable, low-volatility periods, often associated with consolidation, equilibrium, or market indecision.
Green Boxes for bullish breakouts.
Red Boxes for bearish breakdowns.
This allows traders to visually spot transitions from consolidation to expansion phases without relying on lagging signals.
█ Why Use a Weighted Close Instead of SMA?
A standard Simple Moving Average (SMA) treats all past closes equally, which works well in theory, but not in dynamic, fast-shifting markets. In this script, we replace the traditional SMA with a speed-weighted average that reflects how aggressively the market has moved bar-to-bar.
⚪ Here's why it matters:
Bars with higher momentum (larger price differences between closes) are given more weight.
Slow, sideways candles (typical in noise or low volume) contribute less to the calculated centerline.
This method creates a more accurate snapshot of market behavior, especially during volatile phases. As a result, the indicator adapts to market conditions more effectively, helping traders identify real consolidation zones, not just average lines distorted by flat bars or noise.
█ How to Use
⚪ Range Detection
Boxes form only when price remains consistently close to the speed-weighted mean.
Helps identify sideways zones, consolidations, and low-volatility structures where price is “charging up.”
⚪ Breakout Confirmation
Once price exits the top or bottom boundary, the box immediately highlights the direction of the break.
Use this signal in conjunction with your own momentum, volume, or trend filters for higher-confidence trades.
█ Settings
Minimum Range Length: Number of candles required for a valid range to form.
Range Width Multiplier: Adjusts the envelope around the weighted average using ATR(2000).
Highlight Box Breaks: Enables real-time coloring of breakouts and breakdowns for immediate visual feedback.
-----------------
Disclaimer
The content provided in my scripts, indicators, ideas, algorithms, and systems is for educational and informational purposes only. It does not constitute financial advice, investment recommendations, or a solicitation to buy or sell any financial instruments. I will not accept liability for any loss or damage, including without limitation any loss of profit, which may arise directly or indirectly from the use of or reliance on such information.
All investments involve risk, and the past performance of a security, industry, sector, market, financial product, trading strategy, backtest, or individual's trading does not guarantee future results or returns. Investors are fully responsible for any investment decisions they make. Such decisions should be based solely on an evaluation of their financial circumstances, investment objectives, risk tolerance, and liquidity needs.

Jags Dynamic S/R with Breakout & Weakness SignalsThis script is designed to automatically identify and display significant support and resistance levels on your chart. It then goes a step further by actively monitoring for potential breakouts and signs of support weakness.
Core Functionality: Identifying Key Levels
At its heart, the script uses a pivot logic to find recent price highs and lows, which it then plots as horizontal lines representing potential resistance and support, respectively. You have full control over how these levels are identified:
Timeframe: You can choose to find these pivot points on the current chart's timeframe or a higher one (e.g., daily pivots on an hourly chart).
Lookback Period: You can define how many bars to the left and right of a pivot point the script should consider, allowing you to fine-tune the significance of the levels it identifies.
Line Management: To keep your chart clean, you can set the maximum number of support and resistance lines to display. The script also has a clever "merge" feature that combines new pivot levels with existing ones if they are very close together, preventing clutter.
Breakout Detection
A key feature of this indicator is its ability to signal when the price breaks through one of these identified support or resistance levels. You can enable or disable this feature and choose from several confirmation methods to suit your trading style:
Simple Price Action: A breakout is confirmed simply by the price closing above a resistance level or below a support level.
ATR (Average True Range): For a breakout to be valid, the price must close a certain distance (based on the ATR) beyond the level, filtering out minor fluctuations.
Volume: This option adds another layer of confirmation by requiring a significant increase in trading volume during the breakout, suggesting strong conviction behind the move.
Momentum: This method uses the RSI (Relative Strength Index) to confirm that the breakout is supported by strong underlying momentum.
Quantitative: A more advanced option that uses a combination of the Rate of Change (ROC) and a Volume-Weighted Moving Average (VWMA) to provide a robust, multi-faceted confirmation of the breakout.
When a confirmed breakout occurs, the script will:
Color the breakout bar green for a bullish breakout (upward) or red for a bearish breakout (downward).
Place an arrow below a bullish breakout or above a bearish breakout.
Trigger an alert to notify you of the event.
Support Weakness Detection
To provide an early warning of a potential breakdown, the script includes a unique "Support Weakness Detection" feature. When enabled, it looks for a specific confluence of bearish signals as the price approaches a support level:
The price is hovering just above a key support level.
The short-term trend has already turned bearish (based on a moving average).
Momentum is fading (indicated by a falling RSI).
If all these conditions are met, a blue down-arrow will appear above the price bar, signalling that the nearby support may not hold.
Range Breakout [sgbpulse]Range Breakout
1. Overview
The "Range Breakout " indicator is a powerful tool designed to identify and visually display price ranges on your chart using pivot points. It dynamically draws two distinct boxes – an External Range and an Internal Range – helping traders pinpoint potential support and resistance zones. Beyond its visual representation, the indicator offers a comprehensive set of 12 unique breakout alerts, providing real-time notifications for significant price movements outside these defined ranges. Additionally, it integrates RSI and MFI metrics for momentum confirmation.
2. How It Works
The indicator operates by identifying pivot points based on user-defined "left" and "right" bar lengths. A high pivot is a bar with a specified number of lower highs both to its left and right, and similarly for a low pivot.
External Range: Calculated using longer pivot lengths (default: 15 bars left, 6 bars right). This range represents broader, more significant price consolidation areas.
Internal Range: Calculated using shorter pivot lengths (default: 4 bars left, 3 bars right). This range captures tighter, more immediate price consolidations within the broader trend.
The External Range will always be greater than or equal to the Internal Range, as it's based on a wider historical context. Both ranges are displayed as transparent boxes on your chart, dynamically adjusting as new pivots are formed.
3. Key Features and Settings
Customizable Pivot Lengths:
External Range (Left/Right Bars): Adjust sensitivity for identifying the broader price range. Longer lengths lead to more stable, but less frequent, range updates.
Internal Range (Left/Right Bars): Adjust sensitivity for the tighter, more immediate price range.
Tool Tips: Minimum 6 bars for the External Range, and minimum 2 bars for the Internal Range.
Customizable Range Colors: Easily change the background colors of the External and Internal Range boxes to match your chart's aesthetic.
Dynamic Range Display: The indicator automatically updates the range boxes as new pivot highs and lows are formed, always presenting the most current valid ranges.
RSI / MFI Settings:
Timeframe Source: Select the timeframe for RSI and MFI calculation.
- Chart: Calculation based on the current chart timeframe.
- Daily: Always calculated based on the daily ("D") timeframe, even if the chart is on a lower timeframe.
RSI Length: Period length for RSI calculation (default: 14).
RSI Overbought Level: Overbought level for RSI (default: 70.0).
RSI Oversold Level: Oversold level for RSI (default: 30.0).
MFI Length: Period length for MFI calculation (default: 14).
MFI Overbought Level: Overbought level for MFI (default: 80.0).
MFI Oversold Level: Oversold level for MFI (default: 20.0).
4. Synergy of Ranges & Breakout Strength
The interaction between the External and Internal Ranges provides deep insights into price movement and breakout strength:
Immediate Direction: The movement of the Internal Range (up or down) indicates the short-term directional bias within the broader framework of the External Range.
Strength Confirmation: A breakout of the External Range, followed by a breakout of the Internal Range, confirms the strength of the move and increases confidence in the breakout.
Strong Momentum ("Leaving" Ranges Behind): When price breaks out with exceptionally strong momentum, it continues to move aggressively and does not immediately form new pivots. In such situations, the existing ranges (External and Internal) remain in place while the candles "leave them behind." A "Full Candle" breakout, where the entire candle moves past both ranges, indicates a particularly powerful and decisive move.
Momentum (RSI / MFI) as Confirmation:
- RSI (Relative Strength Index): Measures the speed and change of price movements. Extreme values (above 70 or below 30) indicate overbought/oversold conditions respectively, confirming strong momentum in a breakout.
- MFI (Money Flow Index): Similar to RSI but incorporates volume. Extreme values (above 80 or below 20) indicate strong money flow in/out, reinforcing breakout confirmation.
- Importance of Confirmation: If a breakout occurs but momentum indicators do not confirm it (for example, an upside breakout while RSI is declining), this could signal weakness in the move and the risk of a false breakout (Fakeout).
5. Visuals
The indicator provides clear visual representations on the chart:
Range Boxes:
Two dynamic boxes are drawn on the chart: one for the External Range and one for the Internal Range.
These boxes update continuously, displaying the current range boundaries based on the latest pivots. They provide an immediate visual indication of support and resistance levels.
RSI/MFI Status Labels:
Small text labels appear to the right of the current bar, vertically centered.
They display the status of RSI and MFI: RSI OB (Overbought), RSI OS (Oversold), MFI OB, MFI OS, along with the exact value.
Important: The labels remain on the chart as long as the condition holds (indicator is above/below the level), unlike alerts which mark a singular crossover event.
Plotting of Key Values:
The indicator plots six invisible series on the chart, primarily to allow the user to view the exact numerical values of:
- The upper and lower bounds of the External Range (External High, External Low).
- The upper and lower bounds of the Internal Range (Internal High, Internal Low).
- The calculated RSI and MFI values (RSI, MFI).
These values are accessible for viewing through TradingView's Data Window and also via the Status Line when hovering over the relevant candle. This enables more precise quantitative analysis of range levels and momentum.
6. Comprehensive Breakout Alerts
The "Range Breakout " indicator provides 12 distinct alert conditions for breakouts, allowing you to select the required level of confirmation for each alert. All alerts are triggered only upon a fully confirmed bar close (barstate.isconfirmed) to minimize false signals and ensure reliability.
All breakout alerts are configured to detect a Crossover/Crossunder of the levels, meaning a specific event where the price moves from one side of the range to the other.
External Range Breakout UP
- Close: Price closes above the External Range.
- Real Body: The entire "real body" of the candle (min of open/close prices) closes above the External Range.
- Full Candle: The entire candle (the lowest point of the candle) closes above the External Range.
External Range Breakout DOWN
- Close: Price closes below the External Range.
- Real Body: The entire "real body" of the candle (max of open/close prices) closes below the External Range.
- Full Candle: The entire candle (the highest point of the candle) closes below the External Range.
Internal Range Breakout UP
- Close: Price closes above the Internal Range.
- Real Body: The "real body" of the candle closes above the Internal Range.
- Full Candle: The entire candle closes above the Internal Range.
Internal Range Breakout DOWN
- Close: Price closes below the Internal Range.
- Real Body: The "real body" of the candle closes below the Internal Range.
- Full Candle: The entire candle closes below the Internal Range.
7. Ideal Use Cases
This indicator is ideal for traders who:
Want to clearly identify and monitor price consolidation zones.
Seek confirmation for breakout strategies across various timeframes.
Require reliable and automated alerts for potential entry or exit points based on range expansion.
8. Complementary Indicator
For even more comprehensive market analysis, we highly recommend using this indicator in conjunction with Market Structure Support & Resistance External/Internal & BoS .
This powerful complementary indicator automatically and accurately identifies significant support and resistance levels by locating high and low pivot points, as well as key Pre-Market High/Low levels. Its strength lies in its dynamic adaptability to any timeframe and asset, providing precise and relevant real-time levels while maintaining a clean chart. It also identifies Break of Structure (BoS) to signal potential trend changes or continuations.
Using both indicators together provides a robust framework for identifying defined ranges and potential trend shifts, enabling more informed trading decisions.
View Market Structure Support & Resistance External/Internal & BoS Indicator
9. Important Note: Trading Risk
This indicator is intended for educational and informational purposes only and does not constitute investment advice or a recommendation for trading in any form whatsoever.
Trading in financial markets involves significant risk of capital loss. It is important to remember that past performance is not indicative of future results. All trading decisions are your sole responsibility. Never trade with money you cannot afford to lose.

Ultimate_Priceaction_Tool for INTRADAY by Chaitu50cUltimate_Priceaction_Tool for INTRADAY by Chaitu50c
This indicator is crafted for intraday traders who rely on raw price action. It identifies support and resistance zones based on engulfing candle structures and 2-bar breakout formations. These patterns often signal meaningful reversals or momentum-based breakouts.
Key features:
• Real-time support and resistance zone detection
Uses green-to-red and red-to-green candle transitions where open and close levels align within a defined buffer. Also includes logic to capture two-bar breakout patterns that confirm directional conviction.
• Dynamic line behavior
Line width increases as the level holds for more bars, visually representing zone strength. Breakout buffers also expand with time to reduce false signals.
• Session-based resets
At the start of each new session, all zones reset automatically. This ensures only current, relevant intraday structures are shown, reducing clutter and improving focus.
• Dashed zone detection
Within the main high-low range, additional price levels are plotted as dashed lines when qualifying patterns appear. These zones are suppressed if similar ones already exist nearby.
• Fully customizable
Includes adjustable buffer range, breakout margin, dash suppression distance, line width control, and visual styling for both resistance and support zones.
Recommended usage:
This tool is optimized for the 1-minute and 5-minute timeframes. It is best suited for scalpers and intraday traders who depend on breakout reactions, pullback validation, and session structure shifts.
Use it to identify areas of interest, react to price action, and refine intraday decision-making with high precision.

ZigZag ProZigZag Pro is a precise market structure indicator that automatically detects two independent ZigZag patterns and highlights breakouts whenever significant highs or lows are breached.
The indicator calculates two separate ZigZag structures in real time. ZigZag1 captures the broader market swings and is ideal for trend or swing trading. ZigZag2 is optional and reacts more quickly – perfect for intraday or scalping setups. Both layers are fully customizable in terms of depth, color, and line width.
What makes this tool especially useful: whenever a previous swing high (for long trades) or swing low (for short trades) is broken, the indicator draws a horizontal breakout line on the chart. This makes it easy to spot structural breakouts and take advantage of potential momentum moves.
ZigZag Pro is designed for traders who rely on clean, rule-based market structure — whether you're trading classic breakouts, smart money concepts, or simply want a clearer view of trend shifts. The visuals are minimal, responsive, and suitable for any timeframe.

VWAP Predictive Breakout + RSI + OB + Trend/Chop📈 VWAP Predictive Breakout + RSI + Order Blocks + Trend/Chop Filter
This multi-layered day trading and scalping tool is designed to predict price direction after a VWAP breakout, rather than react to it. It combines volume, RSI, candlestick structure, order blocks, and trend/chop analysis to improve the accuracy of intraday signals.
🔍 Core Features
VWAP Predictive Breakout
Signals are generated when price breaks above/below VWAP with strength (volume spike + strong candle body), supported by trend confirmation.
RSI Momentum Filter
Uses RSI divergence behavior to validate breakouts, filtering out weak or exhausted moves.
Order Block Detection
Marks bullish and bearish engulfing patterns and checks for proximity to these zones as confirmation for breakouts.
Trend vs Chop Detection
Uses ADX, ATR, EMA distance, Bollinger Band width, and candlestick cleanliness to dynamically identify whether the market is trending or choppy.
Clean Candle Behavior
Filters out noisy or indecisive candles by analyzing wick-to-body ratio and ATR-based body size.
📌 Visual Markers
🟢 Buy Signal: Green triangle below bar
🔴 Sell Signal: Red triangle above bar
🟢⚪ Bullish Order Block: Green circle
🔴⚪ Bearish Order Block: Red circle
🟩 Trending Background: Light green
🟥 Choppy Background: Light red
🛎 Alerts Included
Long signal: VWAP breakout + RSI + Order Block + Clean Candle
Short signal: VWAP breakdown + RSI + Order Block + Clean Candle
🧠 Best Use Cases
Scalping high-probability VWAP reversals or continuations
Day trading in markets where trend clarity is critical
Filtering noise in sideways conditions using real-time chop detection

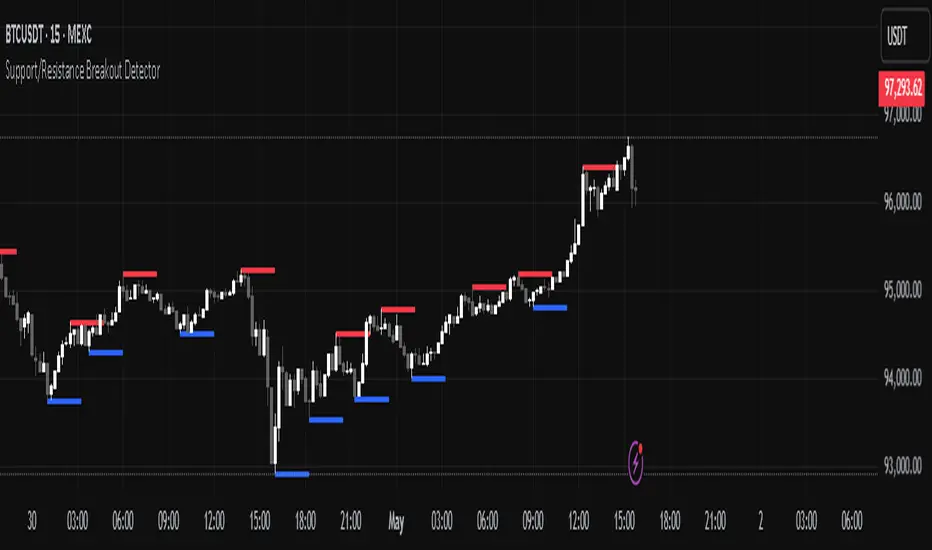
Support/Resistance Breakout DetectorThis indicator automatically detects and plots dynamic support and resistance levels using pivot highs and lows.
✅ It draws red resistance lines and blue support lines,
✅ The lines extend forward but automatically stop when the price touches them,
✅ It monitors for breakouts with strong volume,
✅ When a breakout happens, it shows labels like “B” or “Bull Wick” / “Bear Wick” on the chart,
✅ It also triggers alerts when support or resistance breaks with high volume.
Main settings:
Pivot lookback period
Show/hide breakout labels
Minimum volume for breakout
Maximum extension length for lines
This tool helps traders easily spot key price levels and watch for meaningful breakouts.
RSI Support & Resistance Breakouts with OrderblocksThis tool is an overly simplified method of finding market squeeze and breakout completely based on a dynamic RSI calculation. It is designed to draw out areas of price levels where the market is pushing back against price action leaving behind instances of short term support and resistance levels you otherwise wouldn't see with the common RSI.
It uses the changes in market momentum to determine support and resistance levels in real time while offering price zone where order blocks exist in the short term.
In ranging markets we need to know a couple things.
1. External Zone - It's important to know where the highs and lows were left behind as they hold liquidity. Here you will have later price swings and more false breakouts.
2. Internal Zone - It's important to know where the highest and lowest closing values were so we can see the limitations of that squeeze. Here you will find the stronger cluster of orders often seen as orderblocks.
In this tool I've added a 200 period Smoothed Moving Average as a trend filter which causes the RSI calculation to change dynamically.
Regular Zones - without extending
The Zones draw out automatically but are often too small to work with.
To solve this problem, you can extend the zones into the future up to 40 bars.
This allows for more visibility against future price action.
--------------------------------------------
Two Types of Zones
External Zones - These zones give you positioning of the highest and lowest price traded within the ranging market. This is where liquidity will be swept and often is an ultimate breaking point for new price swings.
How to use them :
External Zones - External zones form at the top of a pullback. After this price should move back into its impulsive wave.
During the next corrective way, if price breaches the top of the previous External Zone, this is a sign of trend weakness. Expect a divergence and trend reversal.
Internal Zones - (OrderBlocks) Current price will move in relation to previous internal zones. The internal zone is where a majority of price action and trading took place. It's a stronger SQUEEZE area. Current price action will often have a hard time closing beyond the previous Internal Zones high or low. You can expect these zones to show you where the market will flip over. In these same internal zones you'll find large rejection candles.
**Important Note** Size Doesn't Matter
The size of the internal zone does not matter. It can be very small and still very powerful.
Once an internal zone has been hit a few times, its often not relevant any longer.
Order Block Zone Examples
In this image you can see the Internal Zone that was untouched had a STRONG price reaction later on.
Internal Zones that were touched multiple times had weak reactions later as price respected them less over time.
Zone Overlay Breakdown
The Zones form and update in real time until momentum has picked up and price begins to trend. However it leaves behind the elements of the inducement area and all the key levels you need to know about for future price action.
Resistance Fakeout : Later on after the zone has formed, price will return to this upper zone of price levels and cause fakeouts. A close above this zone implies the market moves long again.
Midline Equilibrium : This is simply the center of the strongest traded area. We can call this the Point of Control within the orderblock. If price expands through both extremes of this zone multiple times in the future, it eliminates the orderblock.
Support Fakeout : Just like its opposing brother, price will wick through this zone and rip back causing inducement to trap traders. You would need a clear close below this zone to be in a bearish trend.
BARCOLOR or Candle Color: (Optional)
Bars are colored under three conditions
Bullish Color = A confirmed bullish breakout of the range.
Bearish Color = A confirmed bearish breakout of the range.
Squeeze Color = Even if no box is formed a candle or candles can have a squeeze color. This means the ranging market happened within the high and low of that singular candle.

Price and Volume Breakout - Jemmy TradeThe "Price and Volume Breakout" indicator is designed to identify potential breakout opportunities by analyzing both price and volume trends. It uses a combination of historical price highs, volume peaks, and a customizable Simple Moving Average (SMA) to signal bullish breakouts. When the price exceeds the highest price of the defined breakout period and is supported by high volume, the indicator triggers visual alerts on the chart. These include dotted lines, labels, and boxes highlighting accumulation zones, along with dynamically calculated stop loss and take profit levels.
Key Features:
• Breakout Detection: Compares the current closing price to the highest price and volume over specified periods to signal a breakout.
• Customizable Stop Loss Options: Offers three methods for setting stop loss levels:
o Below SMA: Positions stop loss a user-defined percentage below the SMA.
o Lowest Low: Uses the lowest low over a specific look-back period.
o Range Average: Calculates an average based on the previous price range.
• Dynamic Take Profit Calculation: Automatically computes take profit levels based on the defined risk-to-reward ratio.
• Visual Chart Elements: Draws breakout lines, stop loss and take profit indicators, labels (e.g., "🚀 Breakout Buy", "🔴 Stop Loss", "🟢 Take Profit"), and boxes marking accumulation zones for easy visualization.
• Alert Conditions: Includes alert functionality to notify traders when breakout conditions are met, enabling timely trading decisions.
How to Use:
1. Customization: Adjust settings such as the breakout periods for price and volume, the length of the SMA, stop loss options, and the risk-to-reward ratio to fit your trading strategy.
2. Signal Identification: When the price exceeds the highest value from the previous period, accompanied by high volume and confirmation from the SMA, the indicator displays a "Breakout Buy" signal.
3. Risk Management: The indicator calculates appropriate stop loss and take profit levels automatically based on your selected parameters, ensuring a balanced risk/reward setup.
4. Alerts: Utilize the built-in alert conditions to receive notifications whenever the breakout criteria are satisfied, helping you act promptly.
PLEASE USE IT AS PER YOUR OWN RISK MANAGEMENT STRATEGIES.
Keywords:
#Breakout #Trading #VolumeAnalysis #TechnicalAnalysis #PriceAction #RiskManagement #TrendFollowing #TradingSignals #PriceBreakout #SmartTrading #JemmyTrade

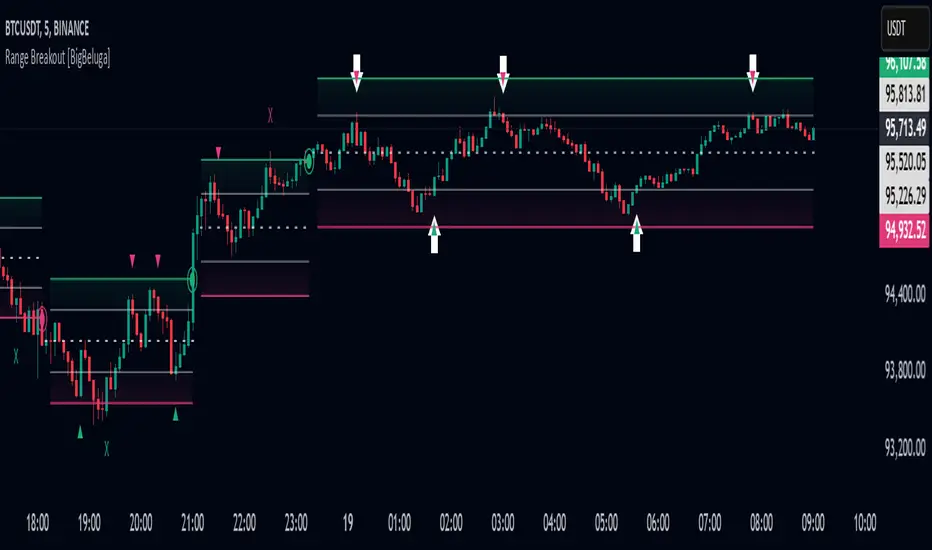
Range Breakout [BigBeluga]Range Breakout is a dynamic channel-based indicator designed to identify breakout opportunities and price reactions within defined ranges. It automatically creates upper and lower bands with a midline, helping traders spot breakout zones, retests, and potential fakeouts.
🔵 Key Features:
Dynamic Channel Formation:
Automatically plots upper and lower channel bands with a midline based on ATR calculations.
Channels adjust upon breakout events or after a predefined number of bars to reflect new price ranges.
Breakout Detection:
Green circles appear when price breaks above the upper channel edge.
Red circles appear when price breaks below the lower channel edge.
A new channel is formed after each breakout, allowing traders to monitor evolving price ranges.
Retest Signals:
Upward-pointing green triangles signal a retest of the lower band, indicating potential support.
Downward-pointing red triangles indicate a retest of the upper band, suggesting possible resistance.
Filter Signals by Trends (New Feature):
Optional toggle to filter ▲ and ▼ signals based on channel breakout conditions.
When enabled:
In a bullish channel (confirmed by a green circle breakout), only ▲ signals are displayed.
In a bearish channel (confirmed by a red circle breakout), only ▼ signals are displayed.
Helps traders align retest signals with the prevailing trend for higher-quality trade setups.
Fakeout Identification:
'X' symbols appear when price breaks the upper or lower edge of the channel and quickly returns back inside.
Helps traders identify and avoid false breakouts.
🔵 Usage:
Breakout Trading: Use the green and red circle signals to identify potential breakout trades.
Retest Confirmation: Look for triangle markers to confirm retests of key levels, aiding in entry or exit decisions.
Fakeout Alerts: Utilize the 'X' signals to spot and avoid potential trap moves.
Dynamic Range Monitoring: Stay aware of changing market conditions with automatically updating channels.
Range Breakout is an essential tool for traders seeking to capitalize on range breakouts, retests, and fakeout scenarios. Its dynamic channels and clear visual signals provide a comprehensive view of market structure and potential trade setups.
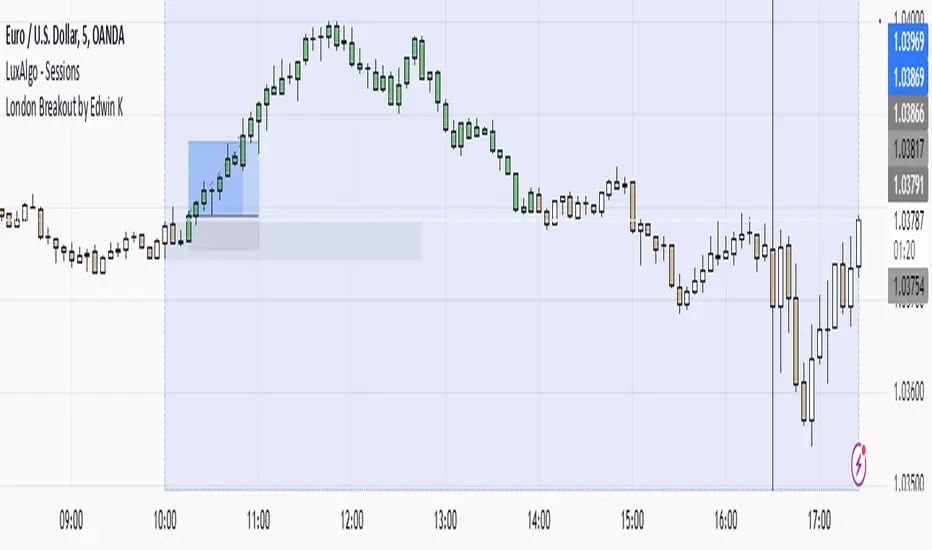
London Breakout by Edwin KPurpose:
The strategy visualizes breakouts based on price action during the London session. It highlights the candles from 09:59 AM to 01:59 PM UTC+3 with different colors depending on whether the price is above or below the high/low from the 10 AM candle.
Key Parts:
Timestamps:
The code defines specific times for the 09:59 AM candle, 10:00 AM candle, and 01:59 PM UTC+3 times.
The timestamp('UTC+3', ...) function creates the timestamps for those moments.
High and Low of the 10 AM Candle:
The high and low of the 10 AM candle are captured and stored in the ten_am_high and ten_am_low variables.
Bullish and Bearish Conditions:
If the price breaks above (bullish_break) or below (bearish_break) the high or low of the 10 AM candle, respectively.
Bar Coloring:
If the conditions are met (price breaking above or below the 10 AM levels), the script colors the candles during the time frame (09:59 AM to 01:59 PM).
Green color is applied for bullish breakouts.
Red color is applied for bearish breakouts.
Volatility Momentum Breakout StrategyDescription:
Overview:
The Volatility Momentum Breakout Strategy is designed to capture significant price moves by combining a volatility breakout approach with trend and momentum filters. This strategy dynamically calculates breakout levels based on market volatility and uses these levels along with trend and momentum conditions to identify trade opportunities.
How It Works:
1. Volatility Breakout:
• Methodology:
The strategy computes the highest high and lowest low over a defined lookback period (excluding the current bar to avoid look-ahead bias). A multiple of the Average True Range (ATR) is then added to (or subtracted from) these levels to form dynamic breakout thresholds.
• Purpose:
This method helps capture significant price movements (breakouts) while ensuring that only past data is used, thereby maintaining realistic signal generation.
2. Trend Filtering:
• Methodology:
A short-term Exponential Moving Average (EMA) is applied to determine the prevailing trend.
• Purpose:
Long trades are considered only when the current price is above the EMA, indicating an uptrend, while short trades are taken only when the price is below the EMA, indicating a downtrend.
3. Momentum Confirmation:
• Methodology:
The Relative Strength Index (RSI) is used to gauge market momentum.
• Purpose:
For long entries, the RSI must be above a mid-level (e.g., above 50) to confirm upward momentum, and for short entries, it must be below a similar threshold. This helps filter out signals during overextended conditions.
Entry Conditions:
• Long Entry:
A long position is triggered when the current closing price exceeds the calculated long breakout level, the price is above the short-term EMA, and the RSI confirms momentum (e.g., above 50).
• Short Entry:
A short position is triggered when the closing price falls below the calculated short breakout level, the price is below the EMA, and the RSI confirms momentum (e.g., below 50).
Risk Management:
• Position Sizing:
Trades are sized to risk a fixed percentage of account equity (set here to 5% per trade in the code, with each trade’s stop loss defined so that risk is limited to approximately 2% of the entry price).
• Stop Loss & Take Profit:
A stop loss is placed a fixed ATR multiple away from the entry price, and a take profit target is set to achieve a 1:2 risk-reward ratio.
• Realistic Backtesting:
The strategy is backtested using an initial capital of $10,000, with a commission of 0.1% per trade and slippage of 1 tick per bar—parameters chosen to reflect conditions faced by the average trader.
Important Disclaimers:
• No Look-Ahead Bias:
All breakout levels are calculated using only past data (excluding the current bar) to ensure that the strategy does not “peek” into future data.
• Educational Purpose:
This strategy is experimental and provided solely for educational purposes. Past performance is not indicative of future results.
• User Responsibility:
Traders should thoroughly backtest and paper trade the strategy under various market conditions and adjust parameters to fit their own risk tolerance and trading style before live deployment.
Conclusion:
By integrating volatility-based breakout signals with trend and momentum filters, the Volatility Momentum Breakout Strategy offers a unique method to capture significant price moves in a disciplined manner. This publication provides a transparent explanation of the strategy’s components and realistic backtesting parameters, making it a useful tool for educational purposes and further customization by the TradingView community.

Three Candle Breakout Marker**Title: Three Candle Breakout Marker**
**Description:**
The **Three Candle Breakout Marker** is a powerful trading indicator designed for traders who want to identify significant price movements based on recent price action. This script marks candles that break above the highest high or below the lowest low of the previous three candles, providing clear visual signals for potential trading opportunities.
### Key Features:
- **Visual Indicators**: The indicator uses upward blue triangles to signify when a candle closes above the highest high of the last three candles, indicating a bullish breakout. Conversely, it uses downward orange triangles to mark when a candle closes below the lowest low of the last three candles, signaling a bearish breakout.
- **Customizable Alerts**: Traders can easily customize this indicator to suit their trading strategies by adjusting colors and sizes for better visibility on their charts.
- **Enhanced Chart Analysis**: With optional horizontal lines drawn at the breakout levels, traders can quickly assess key support and resistance areas, enhancing their decision-making process.
### How to Use:
1. **Add to Chart**: Simply add the indicator to your TradingView chart for any asset or timeframe you are analyzing.
2. **Identify Breakouts**: Look for blue triangles above candles for bullish breakout signals and orange triangles below candles for bearish breakout signals.
3. **Combine with Other Tools**: Use this indicator in conjunction with other technical analysis tools and indicators to confirm signals and improve your trading strategy.
### Conclusion:
The **Three Candle Breakout Marker** is an essential tool for traders looking to capitalize on momentum shifts in the market. By clearly marking breakout points, it helps traders make informed decisions and enhances their ability to react swiftly to changing market conditions.
Feel free to explore and customize this indicator to fit your trading style! Happy trading!

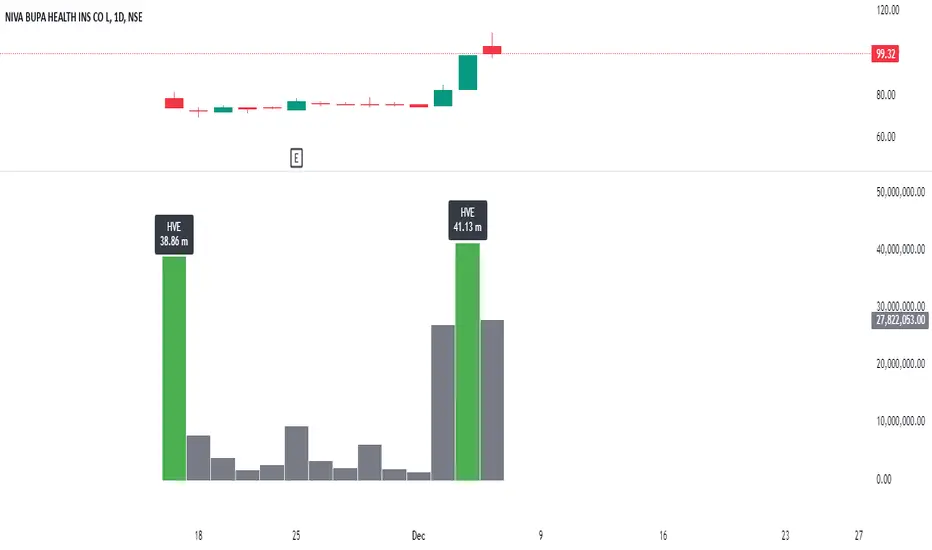
Highest Volume EverOverview:
The Highest Volume Ever (HVE) indicator highlights the highest volume bar in the visible chart history. It visually emphasizes significant volume spikes, helping traders identify key moments of market activity, such as breakout signals or accumulation phases.
Key Features:
Automatic Detection of Highest Volume:
The indicator dynamically scans the entire chart history to identify the bar with the highest trading volume, marking it with a clearly visible label.
Volume in Millions:
The label displays the highest volume in millions, providing a concise and readable format for better interpretation.
Adaptive Positioning:
The label is positioned slightly above the volume bar, ensuring it doesn't obstruct other chart elements while remaining close to the bar for easy reference.
Use Cases:
Identify Significant Market Activity: Detect periods of unusually high volume, often indicating the start of strong trends or the end of consolidations.
Confirm Breakouts: High volume often confirms the strength of breakout moves.
Spot Accumulation or Distribution: Unusually high volume can signal institutional buying or selling.
How to Use:
Add the indicator to your chart on TradingView.
The highest volume bar will be highlighted with a green bar and an "HVE" label above it.
Adjust the chart range to see how the indicator dynamically updates.
Perfect for:
Traders who rely on volume analysis to confirm price movements and detect significant market events.