Cari dalam skrip untuk "candle"

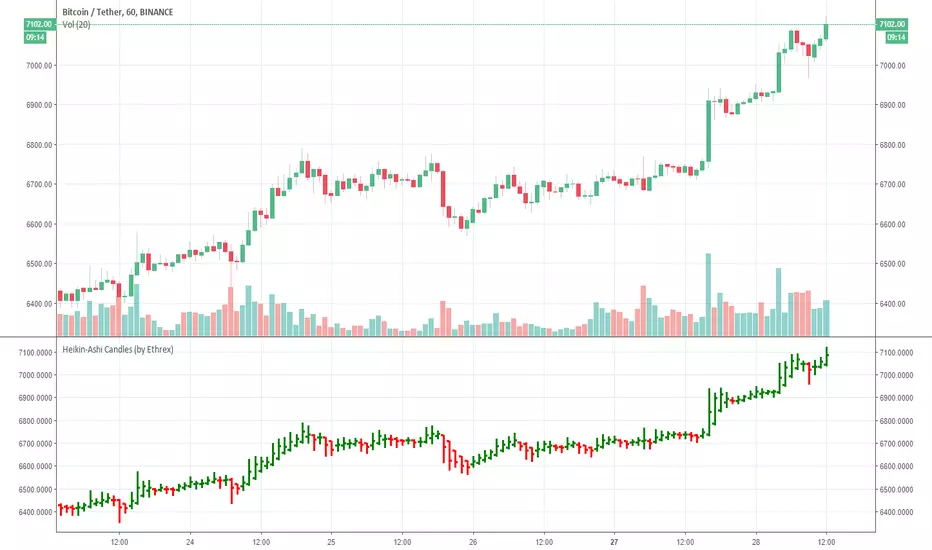
Heikin-Ashi Candles (by Ethrex)Allows to see how Heikin-Ashi candles are computed and see the bars side-by-side with normal prices.
RSI Candles 3 - by SatoshiHeavyCandles will show you oversold dark red, very oversold bright red, over bought dark green, very over bought bright green
ALMA Candles V1.0 by @overratedtraderChanges the solid colored candles based on the price action around the Arnaud Legoux Moving Average. Please modify / improve and share with the community.
TradeSkull Opening Candle Range BoxThis will give you and extended range box of the opening candle of your choice on what ever timeframe you like

TradeSkull Opening Candle Box range of your choiceopening candle range box....pick your time and you will have the high/low and extended range box that you can edit


Daily/Weekly Swing Highs-Lows + Candle PatternsDescription
Daily/Weekly Swing Highs-Lows + Candle Patterns
This indicator plots the most recent Daily and Weekly Swing Highs and Lows (key support/resistance levels) using a simple and effective logic: a swing high/low is confirmed when the previous bar's extreme is higher/lower than both the current and the one before it.
Features:
• Daily Swing Highs/Lows (teal/maroon circles) – toggleable
• Weekly Swing Highs/Lows (blue/purple circles) – optional
• Visual separators for new daily and weekly bars (light background color)
• Daily candle pattern labels (optional):
- US = Up Swing (strong bullish continuation)
- DS = Down Swing (strong bearish continuation)
- IN = Inside Bar
- OUT = Outside Bar
• Daily close position labels (optional):
- P = Positive (close in upper 25% of the range)
- mP = minor Positive (50–75%)
- mN = minor Negative (25–50%)
- N = Negative (lower 25%)
All elements are fully customizable (colors, visibility) and work on any timeframe.
Best suited for intraday timeframes (1 min to 4 hours) where daily and weekly key levels provide important context for price action and reversals.
The optional "Trading session length" input is mainly useful for markets with shorter sessions (e.g., European indices) and does not affect swing detection.
Open-source, free to use and modify.
How to Use the Indicator + Practical Use Case
Key Settings (Inputs)
Trading session length (hours) → Default 8.5 h (useful for FTSEMIB, DAX, etc.). Leave it as is unless you trade a market with a different session length.
Daily Swing Levels → Show/Hide daily swing highs (teal) and lows (maroon).
Weekly Swing Levels → Usually keep off on intraday charts to avoid clutter (turn on for higher-timeframe context).
Daily Candle Patterns → Enable only if you want to see US/DS/IN/OUT labels on the daily close.
Close Position (P/mP/mN/N) → Enable if you want to quickly see how strong/weak the daily close was.
What You See on the Chart
Teal circles = Last confirmed daily swing high (resistance).
Maroon circles = Last confirmed daily swing low (support).
Blue/purple circles (if enabled) = Weekly swing high/low.
Light gray background = Start of a new trading day.
Purple background (if weekly enabled) = Start of a new week.
Small labels on daily close (if enabled):
- US = strong bullish day
- DS = strong bearish day
- IN = inside bar (consolidation)
- OUT = outside bar (expansion)
- P/mP/mN/N = how far the close was from the high/low of the day.
Best Timeframes 1 min to 240 min charts → Daily levels act as major support/resistance zones for intraday trading.
Avoid using on daily or higher charts (the logic is designed for intraday context).
Why this works well intraday:
The daily swing high/low levels are high-probability zones where institutions and algorithms often defend positions. On intraday charts, they act as “magnets” for price, giving you clean entries and exits with clear invalidation levels.
This indicator keeps your chart clean while providing exactly the context most intraday traders need: key daily levels + daily momentum context.

First 5-Min Candle DetectorHighlights the high and low of the first 5-minute candle of the regular trading session, beginning at 9:30am EST.

G-BOT ENGULFING CANDLE - FIXED SL & TP // Description:
This Pine Script strategy identifies bullish and bearish engulfing candle patterns over a defined lookback period and places trades based
on recent market highs and lows. It calculates stop loss and take profit levels using the Average True Range (ATR) multiplied by a user-defined factor, with the ability to adjust the risk-to-reward ratio for each trade.

Previous Day Candle [ApexFX]Previous Day Candle is a precision tool designed for intraday traders who rely on previous daily structures to find support and resistance.
While most indicators simply mark the previous high and low, this tool focuses on Session Continuity. It highlights the full 24-hour range of the previous day and extends those levels into the "Killzone" of the current trading day (up to 2:00 PM EST / 12:00 PM MST).
Why use this? Market reaction often occurs at the previous day's extremes. By extending these lines into the current session, you can easily spot:
Breakouts: Price pushing through yesterday's high.
Failed Auctions: Price sweeping yesterday's low and reversing.
Support/Resistance Flips: Old highs becoming new support.
Main Features:
Asset Class Presets: Don't worry about timezones. Simply select your market:
Forex: Aligns to the standard 5:00 PM EST New York Open.
Indices: Aligns to the 6:00 PM EST Globex Open.
Crypto: Aligns to UTC Midnight.
Custom: Full manual control for specific needs.
Visual "Boxing": Vertical dotted lines clearly demarcate the start and end of the previous trading day.
Dynamic History: Choose to show just yesterday's levels or look back at the last 5+ days.
Smart Color Coding: The indicator automatically cycles colors for each day (Blue = Yesterday, Green = 2 Days Ago, etc.), making it instant to read historical price action.
Best Used On: Intraday timeframes (5m, 15m, 1h).

First 5-Min Candle High/Low by grantratcliff7Draws two pale yellow lines at the open and the close of the first 5 min candle of the trading session (9:35 EDT)

Candle Opens by HAZED🎯 Candle Opens by HAZED - Multi-Timeframe Open Levels Indicator
📊 Overview
This powerful indicator displays multiple timeframe opening prices on your chart, providing crucial reference levels that institutional traders and algorithms frequently monitor. Track up to 7 different timeframe opens simultaneously, from 1-hour to yearly, with advanced visualization features including dynamic coloring, heatmap analysis, and real-time status tracking.
✨ Key Features
📈 Multi-Timeframe Support:
- 1H, 4H, Daily, Weekly, Monthly, Quarterly, and Yearly opens
- Each timeframe can be individually enabled/disabled
- Automatic visibility adjustment based on chart timeframe
🎨 Dynamic Visual System:
- Smart Color Coding: Lines automatically change color based on price position (green above, red below)
- Customizable Styling: Adjust line thickness, transparency, and colors
- Intelligent Line Positioning: Choose between equal-length or staggered lines for better visibility
- Enhanced Labels: Display timeframe only or include price with colored background
🌈 Advanced Heatmap:
- Background coloring shows overall market sentiment across all timeframes
- Gradient or solid color modes
- Instantly see when multiple timeframes align bullish or bearish
📊 Status Table Dashboard:
- Real-time overview of all active opens
- Shows current price position relative to each open
- Simplified view when all timeframes align
- Customizable position and font style
⚙️ Professional Tools:
- Alert system for new open levels
- Extended hours session support
- Price discovery mode for EOD/intraday discrepancies
- Left/right line extensions for enhanced visibility
💡 Trading Applications
Support & Resistance:
Opening prices act as natural support/resistance levels. Price often reacts at these levels, providing entry/exit opportunities.
Trend Confirmation:
When price is above multiple opens (especially higher timeframes), it confirms bullish momentum. The opposite indicates bearish pressure.
Mean Reversion:
Price tends to revert to significant opens, particularly daily and weekly levels. Use these as targets for counter-trend trades.
Breakout Trading:
Monitor when price breaks above/below clustered opens for potential continuation moves.
Risk Management:
Use opens as logical stop-loss levels or position sizing references based on distance from key opens.
🔧 Indicator Settings
Timeframes Section:
- Toggle each timeframe on/off
- Customize individual colors
Visual Style Section:
- Dynamic Colors: Auto-color based on price position
- Line Thickness: 1-4 pixels
- Transparency: 0-80%
- Extension Length: How far lines extend right
- Label Style: Plain or enhanced with price
Heatmap Section:
- Enable/disable background coloring
- Adjust transparency
- Choose gradient or solid zones
Status Table Section:
- Position on chart
- Font selection
Advanced Section:
- Enable alerts for new opens
- Price discovery mode
- Extended hours inclusion
]📈 Best Practices
1. Timeframe Selection:
- For intraday: Focus on 1H, 4H, and Daily
- For swing trading: Daily, Weekly, Monthly
- For position trading: Monthly, Quarterly, Yearly
2. Color Coding:
- Enable dynamic colors for instant sentiment reading
- Use heatmap for overall market bias
3. Confluence Zones:
- Pay special attention when multiple opens cluster
- These zones often produce stronger reactions
4. Alignment Signals:
- When all timeframes show same color = strong trend
- Mixed colors = potential consolidation or reversal zone
🎯 Pro Tips
- Volume Confirmation: Combine with volume indicators to confirm reactions at open levels
- Multiple Instruments: Compare opens across correlated assets for divergences
- News Events: Opens often act as magnets after major news releases
- Options Trading: Weekly and monthly opens align with options expiry levels
- Algorithmic Levels: Many algorithms use these opens for entries/exits
🔄 Updates in Version 8.3
- Added 1H and 4H timeframe support
- Enhanced dynamic color system
- Implemented heatmap visualization
- Added real-time status table
- Optimized performance for smoother operation
- Improved label styling options
- Better yearly timeframe detection
⚡ Performance Optimizations
This indicator uses advanced Pine Script v6 features for optimal performance:
- Efficient object reuse instead of recreation
- Smart calculation loops
- Minimal repainting
- Optimized for real-time updates
📝 Notes
- Works on all markets (stocks, forex, crypto, futures)
- Best on timeframes lower than the opens you're tracking
- Lines automatically hide when their timeframe is lower than chart timeframe
- Past opens are not displayed (indicator shows current opens only)
🙏 Credits & Support
Created by HAZED | Version 8.3
Optimized for TradingView Pine Script v6
For questions, suggestions, or bug reports, please comment below.
If you find this indicator useful, please consider leaving a like and a follow!
Remember: No indicator is perfect. Always use proper risk management and combine multiple confirmation signals in your trading decisions.

🔫 10:00 AM Candle Range – Bhavishya Sniper ScriptMarks the 10:00 AM candle high and low for intraday breakout trading. Designed for Bhavishya’s sniper entry system during Trading Reset 3.0."

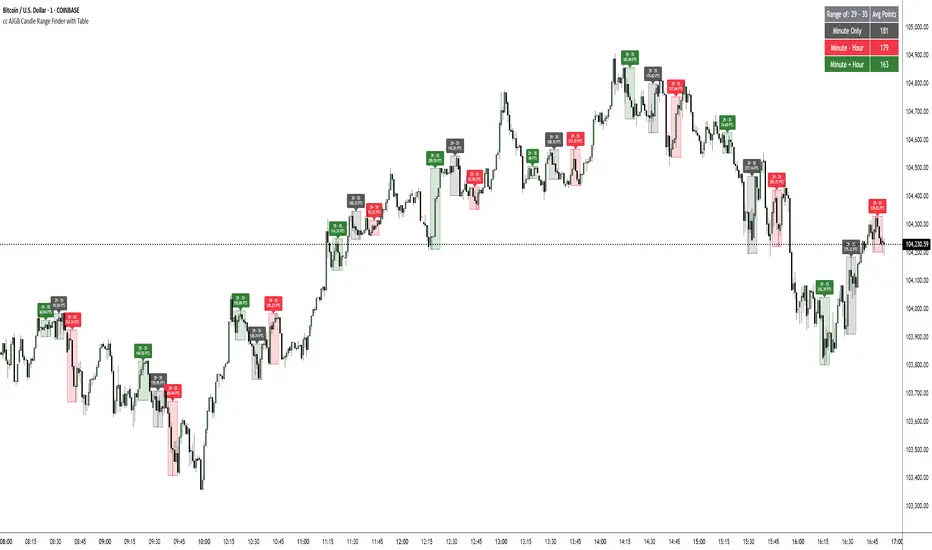
cc AJGB Candle Range Finder with TableOverview:
The "cc AJGB Candle Range Finder with Table" is a versatile Pine Script indicator designed to identify and visualize price ranges within the 1 minute charts based on UTC+2 Time Zone. Unlike traditional range indicators, it offers three unique calculation methods to define ranges based on minute and hour interactions, displays ranges as boxes with labeled point values, and summarizes average range sizes in a customizable table. This tool is ideal for analyzing price ranges of specific time based ranges.
Features:
Customizable Time Range: Users specify a start and end minute (0-59) to define the range period (e.g., 29th to 35th minute).
Three Calculation Methods:
Minute Only: Uses the minute of each bar to identify ranges (e.g., matches user-specified minutes).
Minute - Hour: Adjusts the minute by subtracting the hour, allowing for dynamic range detection across hourly cycles.
Minute + Hour: Combines minute and hour values for a unique range calculation, useful for specific intraday patterns.
Visual Output: Draws boxes around detected ranges, with labels showing the start/end minutes and range size in points.
Summary Table: Displays the average range size (in points) for each method, with customizable position, colors, and text size.
How It Works:
The indicator evaluates each bar’s timestamp in (UTC+2 ONLY) to match user-specified minutes using one or more selected methods. When a start minute is detected, it tracks the high and low prices until the end minute, drawing a box to highlight the range and labeling it with the range size in points. A table summarizes the average range size for each method, helping traders assess typical price movements during the specified period.
Market Analysis: Compare range sizes across different methods to understand intraday volatility patterns.
Settings Customization: Adjust colors, table position, and label sizes to suit your chart preferences.
Settings:
Range to Find: Set start and end minutes.
Range Selection: Enable/disable each method and customize colors.
Range Label Size: Choose label size (Tiny to Huge).
Table Settings: Configure table position (Top, Bottom, Left, Right), sub-position, text size, and colors.
Notes:
Only works on 1 minute charts
The indicator works best using Start Times that are lower than the End Times.
Ensure the chart is set to UTC+2 Time Zone for accurate range detection.
Why It’s Unique:
Unlike standard range indicators that focus on sessions or fixed periods, this tool allows precise minute-based range detection with three distinct calculation methods, offering flexibility for data gathering. The interactive table provides quick insights into average range sizes.
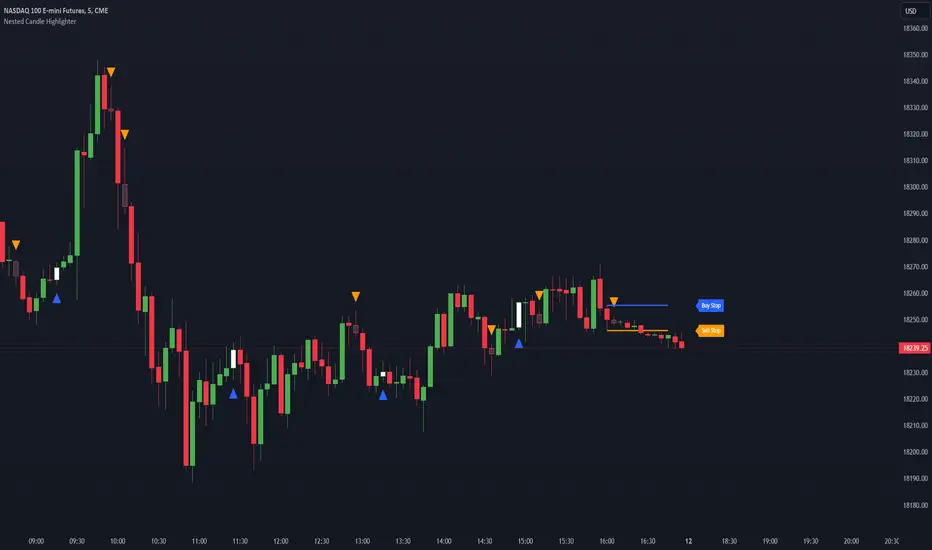
Nested Candle Highlighter @shrilssThe Nested Candle Highlighter identifies when the current candle's body is completely enclosed by the previous candle's wick zones. It examines the upper wick zone, from the previous high to the open or close, and the lower wick zone, from the low up to the open or close. This focused analysis can signal consolidation and potential shifts in momentum, offering an insightful addition to your trading analysis.
Candle Body Color change with Alert-Yogesh PawarThose who wants to get alert for Candle Body Color change, can try this. It will help you.

Traders Reality Vector Candle ZonesVector Candle Zone indicator displays areas of unrecovered liquidity based on PVSRA with override option for the chart symbol.
Developed for TradersReality by infernixx with library conversion by peshocore

HTF Candle Close EpidcoThis draws a label to alert user when a higher timeframe candle closes on a intraday chart.
Purpose of it is so that people who mainly use lower timeframe charts do not forget to look at higher timeframe candle closes.

Hammers & Stars Candle [2022]Hammer and Shooting Star Candle analysis >)
“The home crowd have been right behind their team and there are boos for the officials as they walk off at half-time. Elanga was unfortunate not to win the free-kick, although the clearer foul on him had come before the final tumble. He is entitled to think the ref would bring that back. Instead, United are a goal down.
