Cari dalam skrip untuk "candle"

EL Fly Candle (spinning top) by Epullemanhighlight spinning top candle with alerted volume > vol sma 20 and stoch above 50

Candle counterI've created a simple red/green candle counting script with a custom number of candles to look back on.
Let me know if any bugs, issues, or suggestions.


All Candlestick Patterns - ExportThis is a copy of the built-in All Candlestick Patterns indicator, but with an additional plot for each indicator to support exporting. When exporting, each candlestick pattern will have its own column, with a 1 indicating the candlestick pattern was detected, and 0 indicating it wasn't. The plots are all overlaid, so are they are not useful for viewing, they are only used to generate values to export. This indicator also does not include alerts, so the built-in indicator should be used for everything except exporting.

Candlestick Pattern FinderThis script identifies common candlestick patterns and marks them with a tool-tip on the chart. It is a compilation of Tradingview's built-in candlestick finding scripts so it uses the same rules defined by Tradingview to identify the patterns. Instead of using a separate indicator for each candlestick pattern, you can use this script to find all the candlestick patterns with a single indicator.
By default, the script does not mark any of the detected patterns on the chart. You will have to open the indicator settings and enable the patterns you would like to see on the chart. There are also three tick-boxes that let you to enable/disable all the selected bearish/bullish/neutral patterns at once, i.e. if you would like to only see bearish patterns, you can disable all the bullish and neutral patterns at once with the corresponding tick boxes. When you enable bullish patterns again, the script will show your selection of bullish patterns again on the chart.
When you hover on the tool-tips with your cursor, a short description about the pattern will be displayed.

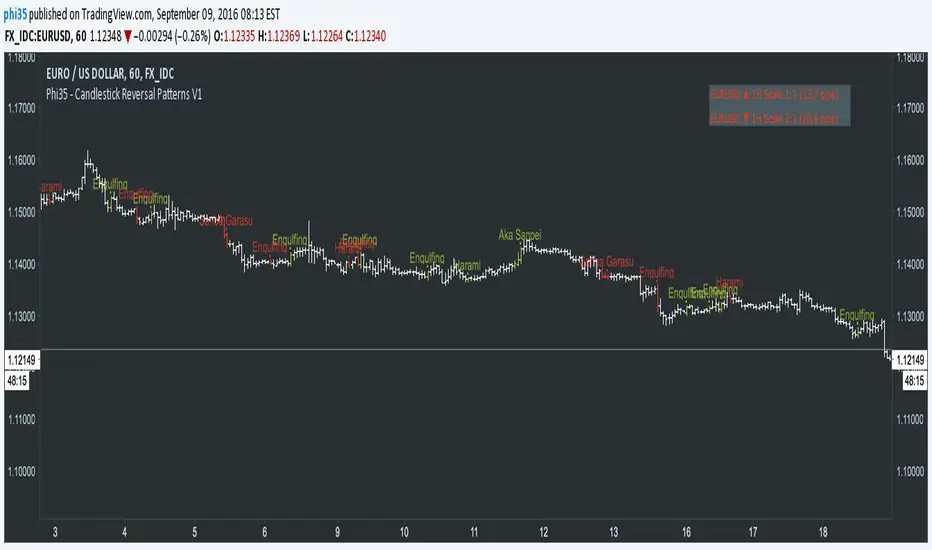
Phi35 - Candlestick Reversal Patterns V1 ©Candlestick Reversal Pattern V1 by Phi35 - 9rd September 2016 ©
Check also my " Candlestick Continuation Pattern " indicator which will follow soon!
Do not modify the code without my permission!
If there is an issue or any suggestions, feel free to contact me on the link below
www.tradingview.com
www.tradingview.com
It seems to work well but still no guarantee on completeness!
RISK WARNING! PAST PERFORMANCE IS NOT NECESSARILY INDICATIVE OF FUTURE RESULTS. IN MAKING AN INVESTMENT DECISION, TRADERS MUST RELY ON THEIR OWN EXAMINATION OF THE ENTITY MAKING THE TRADING DECISIONS!
Wait always for confirmation (next opening price or closing price)!!
RECOGNIZABLE REVERSAL PATTERNS
01.Engulfing
02.Harami
03.Piercing Line
04.Morning Star
05.Evening Star
06.Belt Hold
07.Three White Soldiers
08.Three Black Crows
09.Three Stars in the South
10.Stick Sandwich
11.Meeting Line
12.Kicking
13.Ladder Bottom
Although the Engulfing and Harami Patterns are important but can occur too often and give false signals, I give you the option to turn them completely off.
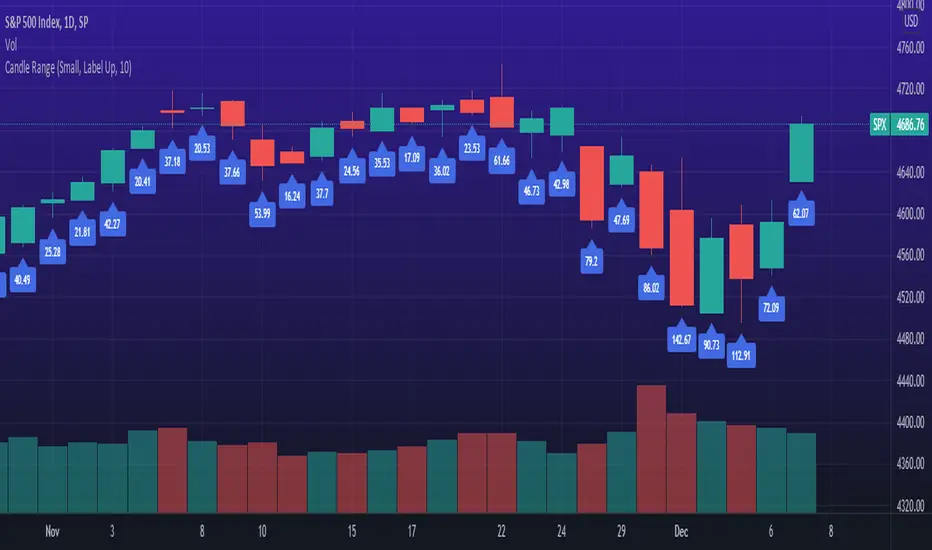
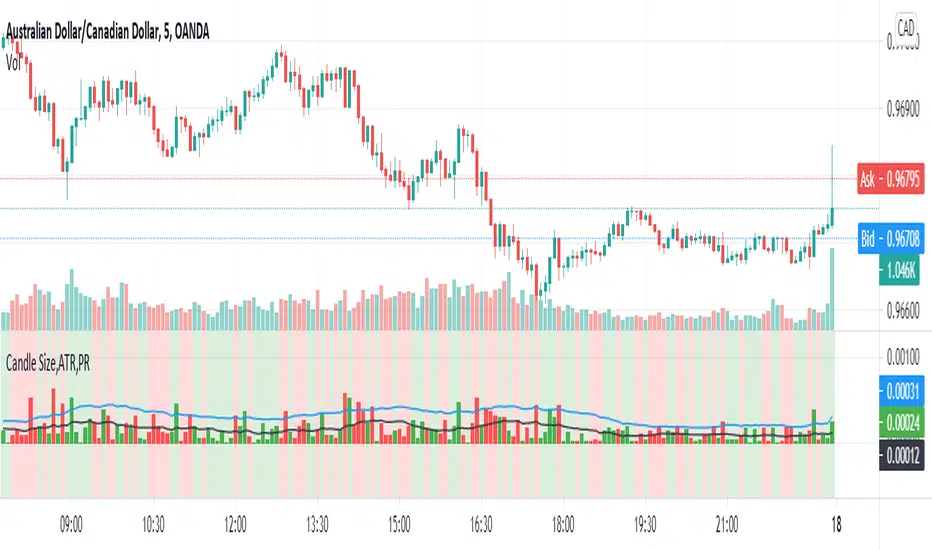
Candle LevelsCandle Levels
Allows chart levels to be plotted automatically, simply add tool to chart and the interactive mode will prompt for candle selection, timeframe anchor and some label choices such as displaying time, price or disabling labels altogether.
Also a note can be supplied that will be shown in the labels if they're displayed, if not it'll be up in the indicator values if those are enabled. Colors and individual labels can be customized, encourage saving over defaults for repeated usage.
Levels calculated:
Standard OHLC
Close to open mid point
High to low mid point
High wick mid point (either between close or open, whichever is higher)
Low wick mid point (either between close or open, whichever is lower)
I have plans to better detected levels and labels overlap to perhaps do something with that, for now manually toggling display of label should suffice.
I've tested with various markets such as futures, standard stock markets and also various higher and lower timeframes, if something is found to not be working please let me know.
Enjoy!
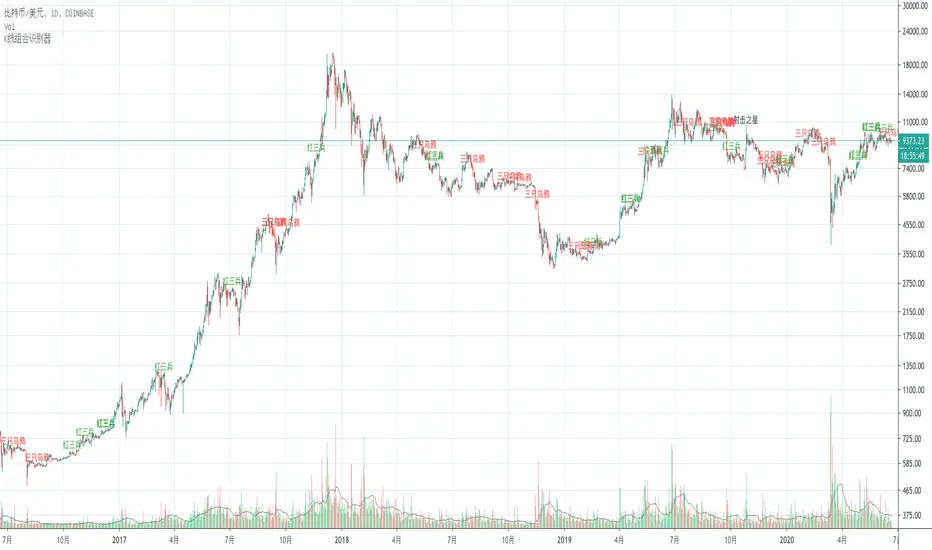
K线组合识别器(Candlestick Pattern Monitor)This is a Candlestick Pattern Monitor which design for Chinese.
这是一个K线组合的识别器。
本脚本的目的在于帮助使用中文的人了解该指标,特别是其用法。同时将该指标代码添加完整的中文注释,方便使用中文的人学习Pine语言。
K线组合是国内技术分析里最常见的分析方式之一。K线组合种类丰富,各类证券类书籍中均有总结,本识别器选取其中几种传播度最高几个K线组合,将其量化,使用机器辅助识别K线组合。
射击之星
射击之星,在股价运行的高位,一根中阳或者大阳线之后出现长上影K线,往往是较为强烈的看空信号,K线的实体部分很小或者为十字线,上影线一般为实体K线的两倍以上。
量化要点:
1 上一根K线须是一根实体高度必须大于最近10根K线实体平均值1.5倍;
2 上影线至少是实体的2倍;
3 下影线不大于实体的0.5倍。
乌云盖顶
乌云盖顶组合,第一根K线为大阳线或者中阳线,第二天跳空高开,第二根K线的开盘价远高于第一根K线的最高价,但是收盘却跌入第一根K线的实体部分,第二根K线收盘价越底,则拐点的信号越明确。
量化要点:
1 跳开,即当前K线开盘价大于上一根收盘价;
2 上一根K线须是一根实体高度必须大于最近10根K线实体平均值1.5倍;
3 当前K线收于前一根K线实体下半部分。
三只乌鸦
三只乌鸦组合的构成,股价上涨的高位区域,一根大阳线之后连续出现三根小阴线,每一根阴线都是跳空高开,但是收在当日最低附近。
量化要点:
1 连续三根阴线;
2 三根阴线的实体都小于最近十根K线实体的平均值。
下跌三部曲
下跌三部曲的构成,一根大阴线或者中阴线之后,随后的交易日连续三根价量逐日萎缩的小阳线,三根小阳线的最高价未能击破前面阴线的开盘价,随即股价重回下跌趋势,并再报收大阴线或者中阴线。
量化要点:
1 组合第一根K线为阴线;
2 组合的第二至第四根K线都为阳线;
3 第四根K线收盘价不高于第一根K线开盘价;
4 第五根K线为阴线,且收盘价低于第二根K线开盘价。
早晨之星
早晨之星由三根K线组合成,第一根是中阴线或者大阴线,第二根是小阳线或者小阴线,第三根为中阳线或者大阳线,如果第二根是十字线,也成为早晨之星,第三根阳线实体切入第一根阴线的实体之内,切入的幅度越大,信号越明确。
量化要点:
1 第一根K线为阴线,且实体高度大于最近十根K线实体的平均值的1.5倍;
2 第二根K线实体高度小于最近十根K线实体的平均值,且上影线小于实体的0.5倍,下影线大于实体的2倍;
3 第三根K线为阳线,且收盘价大于第一根K线开盘价。
红三兵
红三兵构成,三根上涨的小阳K线,如果出现在大跌之后的底部区域或者盘整区域,再配合成交量,往往成为上涨行情的先兆。
量化要点:
1 三根K线均为阳线;
2 三根K线的实体均小于最近十根K线实体的平均值。
指标局限性
因K线组合出现的频次均较高,所以K线组合需结合其他分析方式一起考虑。
Candlestick smoother + x-SignalingHey!
This is a script I remade from various scripts I had.
It's a smoother of candlestick by VWMA , that means that will give information about the trend strenght and actual situation, as you might notice.
I also added a crossing over signaling with RED/GREEN colours.
When the chart is coloured red, means that soon there will be a selling opportunity.
When the chart is coloured green, means that soon there will be a buying opportunity.
For any question, just do it! ;)
Enjoy the ride, and always φ !

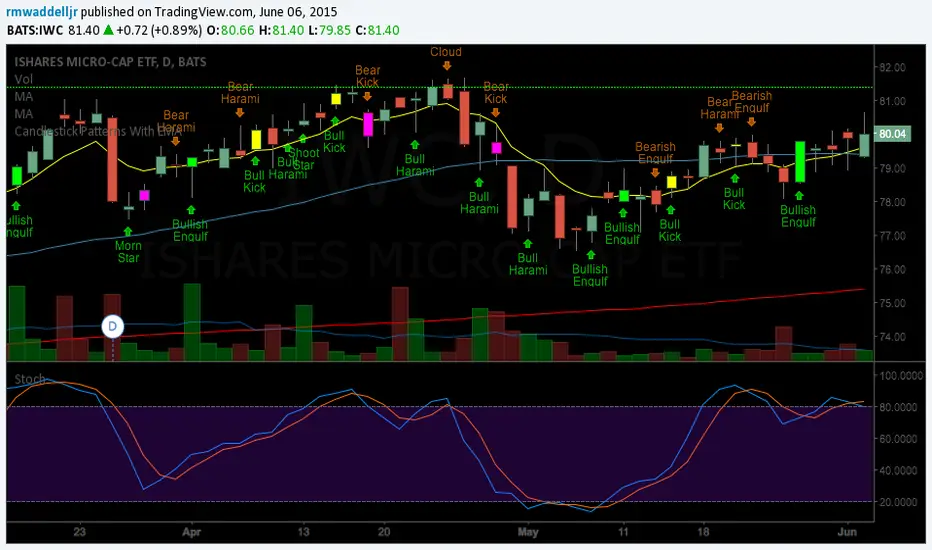
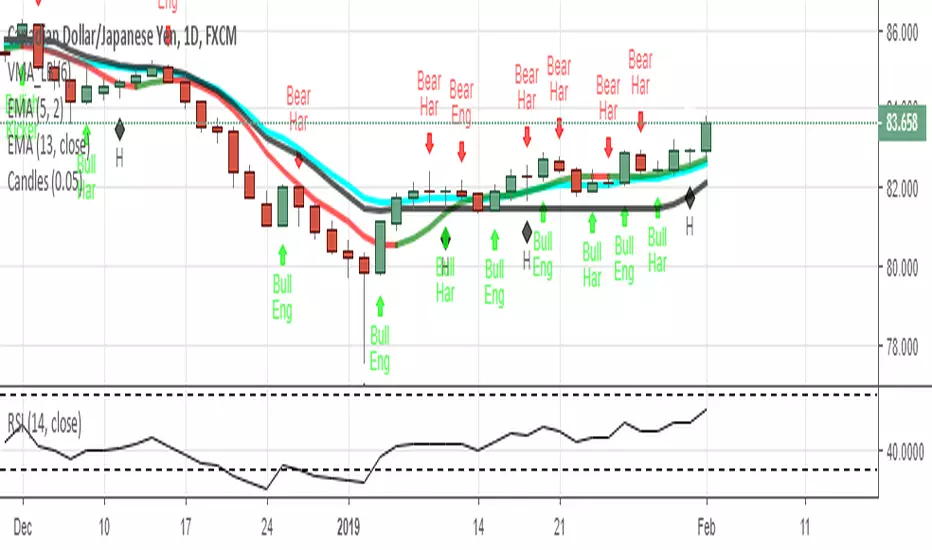
Candlestick Patterns With EMA
Thanks to repo32 as I embellished on his script "Candlestick patterns Identified" I also copied code ideas from DavidR
and Chris Moody. I have huge respect for you guys who publish script with such ease. My coding is a work in progress.
This script still needs improving. So let me know if you have suggestions.
The whole idea was to present these patterns in context of Steve Bigalow's work. I hope it helps in some way.
UDI barCandle has been divide into 3 types up bar, down bar and inside bar,
These bar classified comparing previous candle high low to current candle close.
This method used to ride the trend without exiting position.
We can use this candle color as a stop loss and take profit.
Previous candle H&L Vs Cur. Candle Close
I
U
D
------------------------
I - Inside Candle
U - Up Candle
D - Down Candle


Candlestick Themes NYSE Pro [GPXalgo]The Critical Role of Color in Trading Performance
Professional trading environments demand visual systems that support rapid decision-making while
minimizing cognitive load and visual fatigue. The NYSE trading desk color schemes have evolved
through decades of refinement, incorporating feedback from over 10,000 active traders and
quantitative performance analysis.
Key Design Principles
1. Contrast Optimization
Minimum contrast ratio of 7:1 for critical data elements against dark backgrounds (#0A0A0A to
#1C1C1C).
2. Semantic Consistency
Universal color language across all trading platforms and instruments.
3. Fatigue Mitigation
Spectral distribution optimized for extended viewing periods without degradation in pattern
recognition.
4. Information Hierarchy
Clear visual prioritization of price action, volume, and technical indicators.
Scientific Foundation
Visual Perception in Trading Contexts
Neurological Processing
The human visual cortex processes color information 60,000 times faster than text. In trading
contexts, this translates to:
• 0.13 seconds average recognition time for color-coded signals
• 0.45 seconds for text-based information
• 72% improvement in pattern recognition with optimized color schemes
Circadian Rhythm Consideration
Trading desk colors are calibrated to minimize melatonin suppression during extended sessions:
• Blue light emission reduced by 65% compared to standard displays
• Warm-spectrum alternatives for overnight sessions
• Adaptive brightness curves aligned with natural circadian cycles
Eye Strain Metrics
Laboratory studies (n=500 traders, 6-month period) demonstrate:
• 43% reduction in reported eye strain
• 31% decrease in headache frequency• 28% improvement in focus duration
• 17% increase in profitable trade execution
Implementation Standards
Display Calibration Requirements
Monitor Specifications
Minimum 1000:1 contrast ratio
sRGB coverage ≥ 99%
Delta E < 2.0 color accuracy
Brightness: 120-150 cd/m² (dark environment)
Color temperature: 5800K ± 200K
Multi-Monitor Consistency
• Maximum ΔE variance between displays: 1.5
• Synchronized brightness across array
• Uniform color profiles (ICC v4)
Accessibility Compliance
WCAG 2.1 Level AA Standards
Normal text: 4.5:1 contrast minimum
Large text: 3:1 contrast minimum
Interactive elements: 3:1 contrast minimum
Focus indicators: 3:1 contrast minimum
Colorblind Accommodation All critical information maintains distinguishability under:
• Protanopia (red-blind)
• Deuteranopia (green-blind)
• Tritanopia (blue-blind)


Price_ActionCandlestick analysis
Here is a summary of candlestick analysis that seems useful.
pin bar
inside bar
outside bar
thrust bar
reversal bar
runway bar
morning star
evening star
hammer
inverted hammer
thank you for reading.
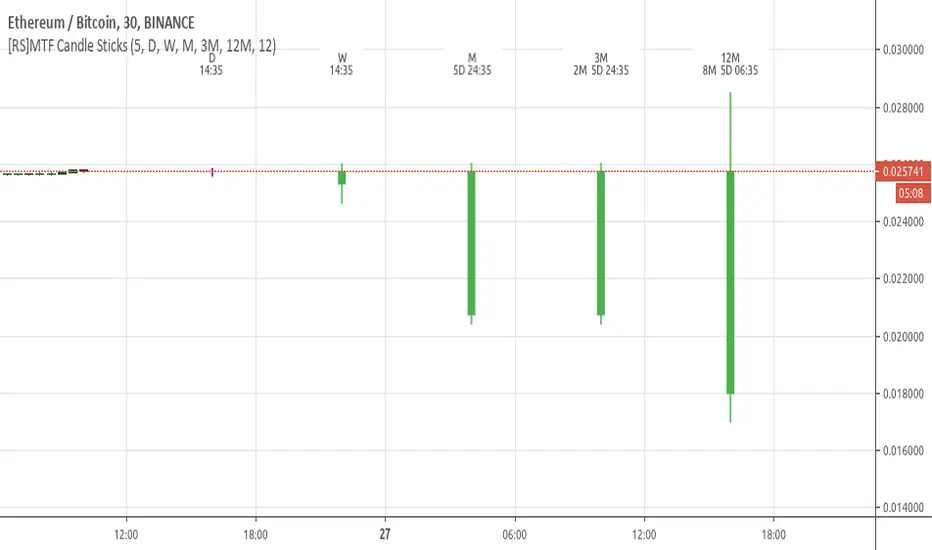
Dekidaka-Ashi - Candles And Volume Teaming Up (Again)The introduction of candlestick methods for market price data visualization might be one of the most important events in the history of technical analysis, as it totally changed the way to see a trading chart. Candlestick charts are extremely efficient, as they allow the trader to visualize the opening, high, low and closing price (OHLC) each at the same time, something impossible with a traditional line chart. Candlesticks are also cleaner than bars charts and make a more efficient use of space. Japanese peoples are always better than everyone at an incredible amount of stuff, look at what they made, the candlesticks/renko/kagi/heikin-ashi charts, the Ichimoku, manga, ecchi...
However classical candlesticks only include historical market price data, and won't include other type of data such as volume, which is considered by many investors a key information toward effective financial forecasting as volume is an indicator of trading activity. In order to tackle to this problem solutions where proposed, the most common one being to adapt the width of the candle based on the amount of volume, this method is the most commonly accepted one when it comes to visualizing both volume and OHLC data using candlesticks.
Now why proposing an additional tool for volume data visualization ? Because the classical width approach don't provide usable data regarding volume (as the width is directly related to the volume data). Therefore a new trading tool based on candlesticks that allow the trader to gain access to information about the volume is proposed. The approach is based on rescaling the volume directly to the price without the direct use of user settings. We will also see that this tool allow to create support and resistances as well as providing signals based on a breakout methodology.
Dekidaka-Ashi - Kakatte Koi Yo!
"Dekidaka" (出来高) mean "Volume" in a financial context, while "Ashi" (足) mean "leg" or "bar". In general methods based on candlesticks will have "Ashi" in their name.
Now that the name of the indicator has been explained lets see how it works, the indicator should be overlayed directly to a candlestick chart. The proposed method don't alter the shape of the candlesticks and allow to visualize any information given by the candles. As you can see on the figure below the candle body of the proposed tool only return the border of the candle, this allow to show the high/low wick of the candle.
The body size of the candle is based on two things : the absolute close/open difference, and the volume, if the absolute close/open difference is high and the volume is high then the body of the candle will be clearly visible, if the volume is high but the absolute close/open difference is low, then the body will be less visible. This approach is used because of the rescaling method used, the volume is divided by the sum between the current volume value and the precedent volume value, this rescale the volume in a (0,1) range, this result is multiplied by the absolute close/open difference and added/subtracted to the high/low price. The original approach was based on normalization using the rolling maximum, but this approach would have led to repainting.
You have access to certain settings that can help you obtain a better visualization, the first one being the body size setting, with higher values increasing the body amplitude.
In green body with size 2, in red with size 1. The smooth parameter will smooth the volume data before being used, this allow to create more visible bodies.
Here smooth = 100.
Making Bands From The Dekidaka-Ashi
This tool is made so it output two rescaled volume values, with the highest value being denoted as "Dekidaka-high" and the lowest one as "Dekidaka-low". In order to get bands we must use two moving averages, one using the Dekidaka-high as input and the other one using Dekidaka-low, the body size parameter should be fairly high, therefore i will hide the tool as it could cause trouble visualizing the bands.
Bands with both MA's of period 20 and the body size equal to 20. Larger periods of the MA's will require a larger amount of body size.
Breakout Signals
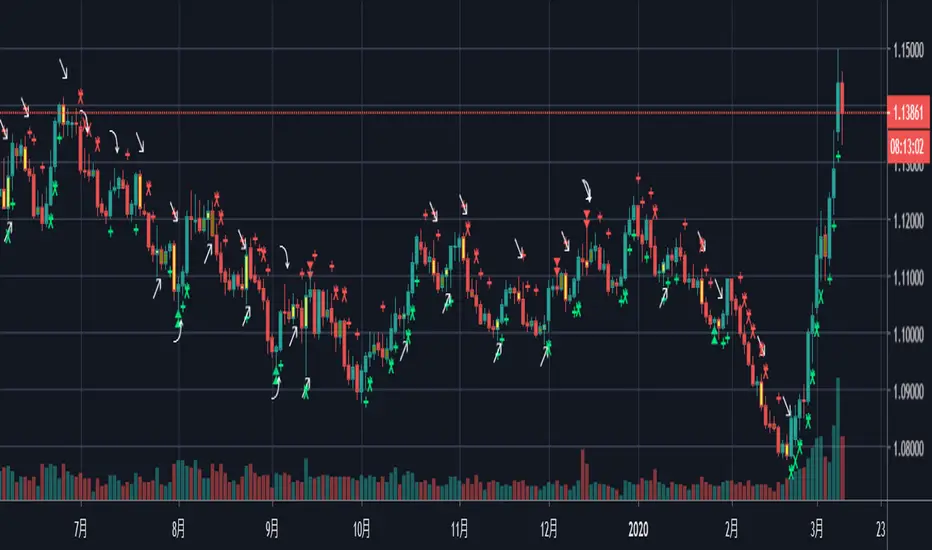
There is a wide variety of signals that can be made from candles, ones i personally like comes from the HA candles. The proposed tool is no exception and can produce a wide variety of signals. The signals generated are basic ones based on a breakout methodology, here is each signal with their associated label :
Strong Bullish signal "⇈" : The high price cross the Dekidaka-high and the closing price is greater than the opening price
Strong Bearish signal "⇊" : The low price cross the Dekidaka-low and the closing price is lower than the opening price
Weak Bullish signal "↑" : The high price cross the Dekidaka-high and the closing price is lower than the opening price
Weak Bearish signal "↓" : The low price cross the Dekidaka-low and the closing price is greater than the opening price
Uncertain "↕" : The high price cross the Dekidaka-high and the low price cross the the Dekidaka-low
In order to see the signals on the chart check the "Show signals" option. Note that such signals are not based on an advanced study, and even if they are based on a breakout methodology we can see that volatile movement rarely produce signals, therefore signals mostly occur during low volume/volatility periods, which isn't necessarily a great thing.
Conclusion
A trading tool based on candlesticks that aim to include volume information has been presented and a brief methodology has been introduced. A study of the signals generated is required, however i'am not confident at all on their accuracy, i could work on that in the future. We have also seen how to make bands from the tool.
Candlesticks remain a beautiful charting technique that can provide an enormous amount of information to the trader, and even if the accuracy of patterns based on candlesticks is subject to debates, we can all agree that candlesticks will remain the most widely used type of financial chart.
On a side note i mostly use a dark color for a bullish candle, and a light gray for a bearish candle, with the border color being of the same color as the bullish candle. This is in my opinion the best setup for a candlestick chart, as candles using the traditional green/red can kill the eyes and because this setup allow to apply a wide variety of colors to the plot of overlayed indicators without the fear of causing conflict with the candles color.
Thanks for reading ! :3 Nya
A Word
This morning i received some hateful messages on twitter, the users behind them certainly coming from tradingview, so lets be clear, i know i'am not the most liked person in this community, i know that perfectly, but no one merit to be receive hateful messages. I'am not responsible for the losses of peoples using my indicators, nor is tradingview, using technical indicators does not guarantee long term returns, your ability to be profitable will mostly be based on the quality and quantity of knowledge you have.

2Rsi buy & sell & candlesticks patterns in rsi[Trader's Journal]An Ingenious Trading Indicator: RSI, Japanese Candlesticks, and Buy/Sell Signals
The world of trading is a subtle game of analysis, where the smallest piece of information can make the difference between success and failure. In this perpetual quest to anticipate market movements, one indicator stands out: the Relative Strength Index (RSI), a powerful tool that measures the strength of price movements. However, RSI alone may not always suffice for informed trading decisions.
This is where our indicator comes into play, adding a new dimension to your analysis. The indicator skillfully combines RSI with Japanese candlesticks, those small candles rich in market movement information. The goal is clear: to generate buy and sell signals during trend reversals while keeping a keen eye on overbought and oversold zones.
RSI: Guardian of Extremes
The RSI is a basic tool that measures buying and selling pressure on an asset. It oscillates between 0 and 100, signaling overbought levels when the RSI exceeds 70 and oversold levels below 30. These extreme zones are often the stage for trend reversals, but timing is crucial.
Japanese Candlesticks: Messengers of the Market
Japanese candlesticks are more than just candles on a chart. They depict market emotions, reflecting the ongoing struggle between buyers and sellers. Trend reversals are typically heralded by specific candlestick patterns such as the Bearish Engulfing, Evening Star, or Inverted Hammer. These candlesticks act as powerful visual signals.
The Indicator in Action: Timing and Confirmation
When the RSI reaches the overbought zone (above 70) or oversold zone (below 30), our indicator is on alert. This is when vigilance is at its peak. However, buy and sell signals don't occur automatically. They await confirmation from Japanese candlesticks.
For a sell signal, the indicator awaits an exit from the overbought zone, followed by a bearish reversal candlestick. When these conditions are met, the sell signal is triggered. For a buy signal, the process is similar, but upon exiting the oversold zone and in the presence of a bullish candlestick.
The Elegance of the Combination
The beauty of this indicator lies in its ability to combine RSI analysis with the power of Japanese candlesticks. It doesn't just predict trend reversals, it does so elegantly, demanding visual confirmation, thus avoiding false signals.
As the market moves relentlessly, this indicator is your ally for making informed decisions. It reminds you that the wisdom of trading lies in combining different analytical tools to decipher the mysteries of the financial market. Envelop your trading strategies with this indicator, and witness how it can illuminate your path to success.
