OPEN-SOURCE SCRIPT
Telah dikemas kini Candle Levels
Candle Levels
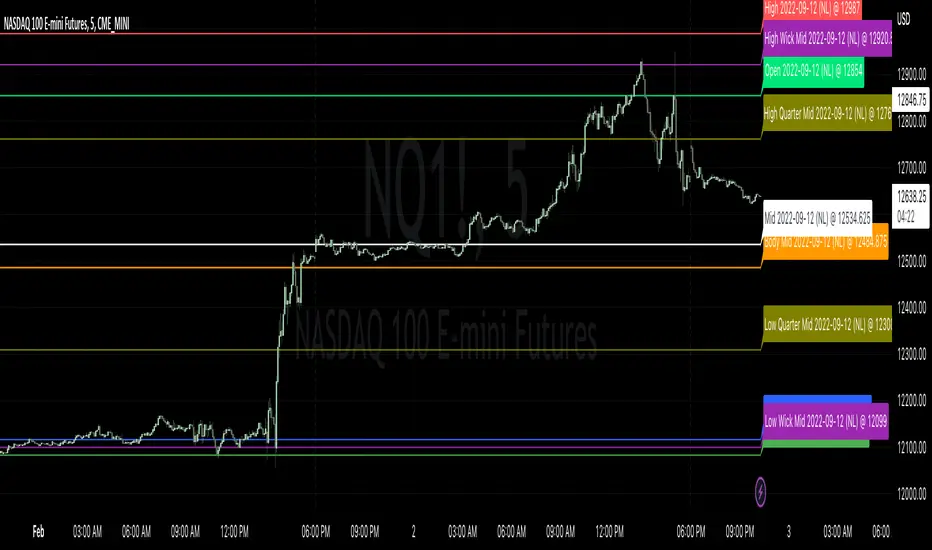
Allows chart levels to be plotted automatically, simply add tool to chart and the interactive mode will prompt for candle selection, timeframe anchor and some label choices such as displaying time, price or disabling labels altogether.
Also a note can be supplied that will be shown in the labels if they're displayed, if not it'll be up in the indicator values if those are enabled. Colors and individual labels can be customized, encourage saving over defaults for repeated usage.
Levels calculated:
I have plans to better detected levels and labels overlap to perhaps do something with that, for now manually toggling display of label should suffice.
I've tested with various markets such as futures, standard stock markets and also various higher and lower timeframes, if something is found to not be working please let me know.
Enjoy!
Allows chart levels to be plotted automatically, simply add tool to chart and the interactive mode will prompt for candle selection, timeframe anchor and some label choices such as displaying time, price or disabling labels altogether.
Also a note can be supplied that will be shown in the labels if they're displayed, if not it'll be up in the indicator values if those are enabled. Colors and individual labels can be customized, encourage saving over defaults for repeated usage.
Levels calculated:
- Standard OHLC
- Close to open mid point
- High to low mid point
- High wick mid point (either between close or open, whichever is higher)
- Low wick mid point (either between close or open, whichever is lower)
I have plans to better detected levels and labels overlap to perhaps do something with that, for now manually toggling display of label should suffice.
I've tested with various markets such as futures, standard stock markets and also various higher and lower timeframes, if something is found to not be working please let me know.
Enjoy!
Nota Keluaran
- Added quarter plots between high and mid, and low and mid.
- Misc perf adjustment.
Skrip sumber terbuka
Dalam semangat sebenar TradingView, pencipta skrip ini telah menjadikannya sumber terbuka supaya pedagang dapat menilai dan mengesahkan kefungsiannya. Terima kasih kepada penulis! Walaupun anda boleh menggunakannya secara percuma, ingat bahawa menerbitkan semula kod ini adalah tertakluk kepada Peraturan Dalaman kami.
@tradeseekers (YouTube, Twitter)
Penafian
Maklumat dan penerbitan adalah tidak dimaksudkan untuk menjadi, dan tidak membentuk, nasihat untuk kewangan, pelaburan, perdagangan dan jenis-jenis lain atau cadangan yang dibekalkan atau disahkan oleh TradingView. Baca dengan lebih lanjut di Terma Penggunaan.