Ultimate T3 Fibonacci for BTC Scalping. Look at backtest report!Hey Everyone!
I created another script to add to my growing library of strategies and indicators that I use for automated crypto trading! This strategy is for BITCOIN on the 30 minute chart since I designed it to be a scalping strategy. I calculated for trading fees, and use a small amount of capital in the backtest report. But feel free to modify the capital and how much per order to see how it changes the results:)
It is called the "Ultimate T3 Fibonacci Indicator by NHBprod" that computes and displays two T3-based moving averages derived from price data. The t3_function calculates the Tilson T3 indicator by applying a series of exponential moving averages to a combined price metric and then blending these results with specific coefficients derived from an input factor.
The script accepts several user inputs that toggle the use of the T3 filter, select the buy signal method, and set parameters like lengths and volume factors for two variations of the T3 calculation. Two T3 lines, T3 and T32, are computed with different parameters, and their colors change dynamically (green/red for T3 and blue/purple for T32) based on whether the lines are trending upward or downward. Depending on the selected signal method, the script generates buy signals either when T32 crosses over T3 or when the closing price is above T3, and similarly, sell signals are generated on the respective conditions for crossing under or closing below. Finally, the indicator plots the T3 lines on the chart, adds visual buy/sell markers, and sets alert conditions to notify users when the respective trading signals occur.
The user has the ability to tune the parameters using TP/SL, date timerames for analyses, and the actual parameters of the T3 function including the buy/sell signal! Lastly, the user has the option of trading this long, short, or both!
Let me know your thoughts and check out the backtest report!
Cari dalam skrip untuk "crypto"

Robinhood Crypto Combined Volume Tracker
This indicator provides a comprehensive visualization of the combined trading volume for all cryptocurrency pairs available on Robinhood, tailored to the selected region (USA or Europe). The chart dynamically updates based on your selected region, providing actionable insights into market activity.
Features:
Dynamic Region Selection: Toggle between USA and Europe to display the relevant trading pairs for your region.
Combined Volume Visualization: Aggregates and plots the total trading volume for all selected cryptocurrency pairs.
Dynamic Background: Background color changes based on the selected region for visual clarity.
Real-Time Debug Label: Displays the selected region and current total combined volume on the latest bar.
Color-Coded Chart: Distinct plot colors for USA (blue) and Europe (green) to easily identify the region.
Use Cases:
Market Trends: Monitor total crypto market activity to gauge investor interest and trading momentum in different regions.
Region-Specific Analysis: Compare trading behavior between USA and Europe by switching regions.
Volume Comparisons: Assess market strength by observing changes in combined volume over time.
How to Use:
Select your desired region (USA/Europe) using the "Select Region" dropdown.
View the combined trading volume plot on the chart.
Use the background color and chart plot for quick identification of region-specific data.
Notes:
The combined volume calculation is based on the daily timeframe (D) and updates dynamically.
Ensure the selected region matches your area of interest to get accurate insights.
This indicator is ideal for traders looking to analyze and compare crypto trading activity across regions in a consolidated view.

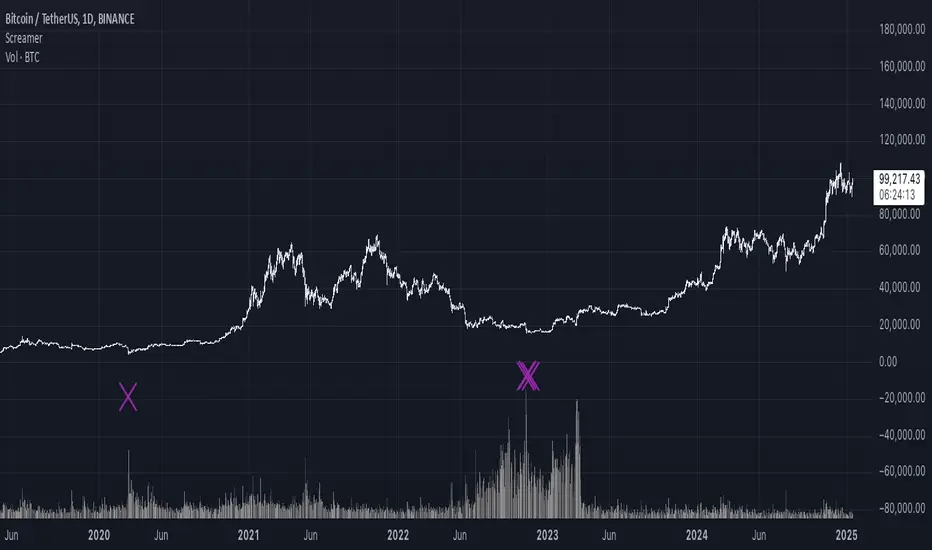
It Screams When Crypto BottomsGet ready to ride the crypto rollercoaster with your new favourite tool for catching Bitcoin at its juiciest, most oversold moments.
This isn’t just another boring indicator — it screams when it’s time to load your bags and get ready for the ride back up!
Expect it to scream just once or twice per cycle at the very bottom, so you know exactly when the party starts!
Why You'll Love It:
Crypto-Exclusive Magic: It does not really matter what chart you are on; this indicator only bothers about the original and realised market cap of BTC. We all know the rest will follow.
Big Picture Focus: Designed for daily. No noisy intraday drama — just pure, clear signals.
Screaming Alerts: When the signal hits, it’s like a neon sign screaming, “Crypto Bottomed!"
Think of this indicator as your backstage pass to the crypto world’s most dramatic moments. It’s not subtle — it’s bold, loud, and ready to help you time the market like a pro.
P.S.: Use it only on a daily chart. Don’t even try it on shorter timeframes — it won’t scream, and you’ll miss the show! 🙀
AlphaEdge Crypto Tracker [CHE]AlphaEdge Crypto Tracker
Efficiently Identify Top Performers and Underperformers Among 40 Crypto Assets at a Glance
In the fast-paced world of cryptocurrency trading, staying ahead requires the ability to quickly assess the performance of multiple assets simultaneously. AlphaEdge Crypto Tracker is an advanced Pine Script™ indicator designed for TradingView that empowers traders to effortlessly monitor and evaluate 40 different crypto assets in real-time.
This tool is my Christmas gift to all traders. I wish you all a Merry Christmas and successful trades in the coming year!
Why It’s Important to Identify Winners and Losers Among 40 Assets at a Glance:
1. Time Efficiency: Managing a diverse portfolio can be overwhelming. With AlphaEdge Crypto Tracker, traders can swiftly identify which assets are performing exceptionally well (winners) and which are underperforming (losers) without the need to analyze each asset individually.
2. Informed Decision-Making: By having a clear overview of top gainers and losers, traders can make strategic decisions such as reallocating investments, taking profits, or cutting losses, thereby optimizing their trading strategies.
3. Risk Management: Quickly spotting underperforming assets helps in mitigating potential losses and adjusting positions to maintain a balanced and profitable portfolio.
4. Opportunity Identification: Recognizing top-performing assets allows traders to capitalize on emerging trends and maximize their returns by focusing on the most promising opportunities.
Key Features of AlphaEdge Crypto Tracker :
- Comprehensive Asset Tracking: Monitors 40 crypto assets simultaneously, providing a broad view of the market landscape.
- Max Gain and Adjusted Max Loss Calculations: Utilizes a 14-bar (configurable) period to calculate the highest gains and the adjusted maximum losses for each asset, offering insights into potential profitability and risk.
- Dynamic Ranking: Automatically sorts and ranks assets based on their performance, highlighting the top 10 gainers and top 10 losers for easy comparison.
- Customizable Display:
- Table Settings: Adjust the size, position, and colors of the performance table to fit your chart layout.
- Interactive Tooltips: Hover over asset names to view detailed tooltips, enhancing usability and information accessibility.
- Visual Alerts: Changes in asset performance are visually indicated through background color updates, allowing for immediate recognition of significant shifts.
- User-Friendly Interface: Intuitive table layout with clear headers and organized data presentation, making it easy for traders of all levels to interpret the information.
How It Works:
1. Data Calculation: For each of the 40 tracked assets, AlphaEdge Crypto Tracker calculates the maximum gain and adjusted maximum loss over the defined trading period.
2. Sorting and Ranking: The assets are sorted based on their maximum gains and adjusted maximum losses, automatically updating to reflect the latest market movements.
3. Real-Time Display: The top 10 gainers and losers are displayed in a neatly organized table directly on your TradingView chart, providing immediate visual insights.
4. Customization: Users can tailor the tracking period, select specific assets to monitor, and adjust the table’s appearance to match their trading style and preferences.
Conclusion:
AlphaEdge Crypto Tracker is an essential tool for cryptocurrency traders seeking to enhance their market analysis and decision-making processes. By providing a comprehensive and customizable overview of multiple assets, it enables traders to efficiently identify profitable opportunities and manage risks effectively. Whether you’re a seasoned trader or just starting, AlphaEdge Crypto Tracker equips you with the insights needed to navigate the dynamic crypto market with confidence.
Get Started Today:
Integrate AlphaEdge Crypto Tracker into your TradingView setup and take control of your crypto trading strategy with unparalleled clarity and precision.
Disclaimer:
The content provided, including all code and materials, is strictly for educational and informational purposes only. It is not intended as, and should not be interpreted as, financial advice, a recommendation to buy or sell any financial instrument, or an offer of any financial product or service. All strategies, tools, and examples discussed are provided for illustrative purposes to demonstrate coding techniques and the functionality of Pine Script within a trading context.
Any results from strategies or tools provided are hypothetical, and past performance is not indicative of future results. Trading and investing involve high risk, including the potential loss of principal, and may not be suitable for all individuals. Before making any trading decisions, please consult with a qualified financial professional to understand the risks involved.
By using this script, you acknowledge and agree that any trading decisions are made solely at your discretion and risk.
License Information:
This Pine Script™ code is subject to the terms of the Mozilla Public License 2.0. You can view the full license (mozilla.org).
© chervolino

4-Year Cycles [jpkxyz]Overview of the Script
I wanted to write a script that encompasses the wide-spread macro fund manager investment thesis: "Crypto is simply and expression of macro." A thesis pioneered by the likes of Raoul Pal (EXPAAM) , Andreesen Horowitz (A16Z) , Joe McCann (ASYMETRIC) , Bob Loukas and many more.
Cycle Theory Background:
The 2007-2008 financial crisis transformed central bank monetary policy by introducing:
- Quantitative Easing (QE): Creating money to buy assets and inject liquidity
- Coordinated global monetary interventions
Proactive 4-year economic cycles characterised by:
- Expansionary periods (low rates, money creation)
- Followed by contraction/normalisation
Central banks now deliberately manipulate liquidity, interest rates, and asset prices to control economic cycles, using monetary policy as a precision tool rather than a blunt instrument.
Cycle Characteristics (based on historical cycles):
- A cycle has 4 seasons (Spring, Summer, Fall, Winter)
- Each season with a cycle lasts 365 days
- The Cycle Low happens towards the beginning of the Spring Season of each new cycle
- This is followed by a run up throughout the Spring and Summer Season
- The Cycle High happens towards the end of the Fall Season
- The Winter season is characterised by price corrections until establishing a new floor in the Spring of the next cycle
Key Functionalities
1. Cycle Tracking
- Divides market history into 4-year cycles (Spring, Summer, Fall, Winter)
- Starts tracking cycles from 2011 (first cycle after the 2007 crisis cycle)
- Identifies and marks cycle boundaries
2. Visualization
- Colors background based on current cycle season
- Draws lines connecting:
- Cycle highs and lows
- Inter-cycle price movements
- Adds labels showing:
- Percentage gains/losses between cycles
- Number of days between significant points
3. Customization Options
- Allows users to customize:
- Colors for each season
- Line and label colors
- Label size
- Background opacity
Detailed Mechanism
Cycle Identification
- Uses a modulo calculation to determine the current season in the 4-year cycle
- Preset boundary years include 2015, 2019, 2023, 2027
- Automatically tracks and marks cycle transitions
Price Analysis
- Tracks highest and lowest prices within each cycle
- Calculates percentage changes:
- Intra-cycle (low to high)
- Inter-cycle (previous high to current high/low)
Visualization Techniques
- Background color changes based on current cycle season
- Dashed and solid lines connect significant price points
- Labels provide quantitative insights about price movements
Unique Aspects
1. Predictive Cycle Framework: Provides a structured way to view market movements beyond traditional technical analysis
2. Seasonal Color Coding: Intuitive visual representation of market cycle stages
3. Comprehensive Price Tracking: Captures both intra-cycle and inter-cycle price dynamics
4. Highly Customizable: Users can adjust visual parameters to suit their preferences
Potential Use Cases
- Technical analysis for long-term investors
- Identifying market cycle patterns
- Understanding historical price movement rhythms
- Educational tool for market cycle theory
Limitations/Considerations
- Based on a predefined 4-year cycle model (Liquidity Cycles)
- Historic Cycle Structures are not an indication for future performance
- May not perfectly represent all market behavior
- Requires visual interpretation
This script is particularly interesting for investors who believe in cyclical market theories and want a visual, data-driven representation of market stages.

Bollinger Breakout Strategy with Direction Control [4H crypto]Bollinger Breakout Strategy with Direction Control - User Guide
This strategy leverages Bollinger Bands, RSI, and directional filters to identify potential breakout trading opportunities. It is designed for traders looking to capitalize on significant price movements while maintaining control over trade direction (long, short, or both). Here’s how to use this strategy effectively:
How the Strategy Works
Indicators Used:
Bollinger Bands:
A volatility-based indicator with an upper and lower band around a simple moving average (SMA). The bands expand or contract based on market volatility.
RSI (Relative Strength Index):
Measures momentum to determine overbought or oversold conditions. In this strategy, RSI is used to confirm breakout strength.
Trade Direction Control:
You can select whether to trade:
Long only: Buy positions.
Short only: Sell positions.
Both: Trade in both directions depending on conditions.
Breakout Conditions:
Long Trade:
The price closes above the upper Bollinger Band.
RSI is above the midline (50), confirming upward momentum.
The "Trade Direction" setting allows either "Long" or "Both."
Short Trade:
The price closes below the lower Bollinger Band.
RSI is below the midline (50), confirming downward momentum.
The "Trade Direction" setting allows either "Short" or "Both."
Risk Management:
Stop-Loss:
Long trades: Set at 2% below the entry price.
Short trades: Set at 2% above the entry price.
Take-Profit:
Calculated using a Risk/Reward Ratio (default is 2:1).
Adjust this in the strategy settings.
Inputs and Customization
Key Parameters:
Bollinger Bands Length: Default is 20. Adjust based on the desired sensitivity.
Multiplier: Default is 2.0. Higher values widen the bands; lower values narrow them.
RSI Length: Default is 14, which is standard for RSI.
Risk/Reward Ratio: Default is 2.0. Increase for more aggressive profit targets, decrease for conservative exits.
Trade Direction:
Options: "Long," "Short," or "Both."
Example: Set to "Long" in a bullish market to focus only on buy trades.
How to Use This Strategy
Adding the Strategy:
Paste the script into TradingView’s Pine Editor and add it to your chart.
Setting Parameters:
Adjust the Bollinger Band settings, RSI, and Risk/Reward Ratio to fit the asset and timeframe you're trading.
Analyzing Signals:
Green line (Upper Band): Signals breakout potential for long trades.
Red line (Lower Band): Signals breakout potential for short trades.
Blue line (Basis): Central Bollinger Band (SMA), helpful for understanding price trends.
Testing the Strategy:
Use the Strategy Tester in TradingView to backtest performance on your chosen asset and timeframe.
Optimizing for Assets:
Forex pairs, cryptocurrencies (like BTC), or stocks with high volatility are ideal for this strategy.
Works best on higher timeframes like 4H or Daily.
Best Practices
Combine with Volume: Confirm breakouts with increased volume for higher reliability.
Avoid Sideways Markets: Use additional trend filters (like ADX) to avoid trades in low-volatility conditions.
Optimize Parameters: Regularly adjust the Bollinger Bands multiplier and RSI settings to match the asset's behavior.
By utilizing this strategy, you can effectively trade breakouts while maintaining flexibility in trade direction. Adjust the parameters to match your trading style and market conditions for optimal results!

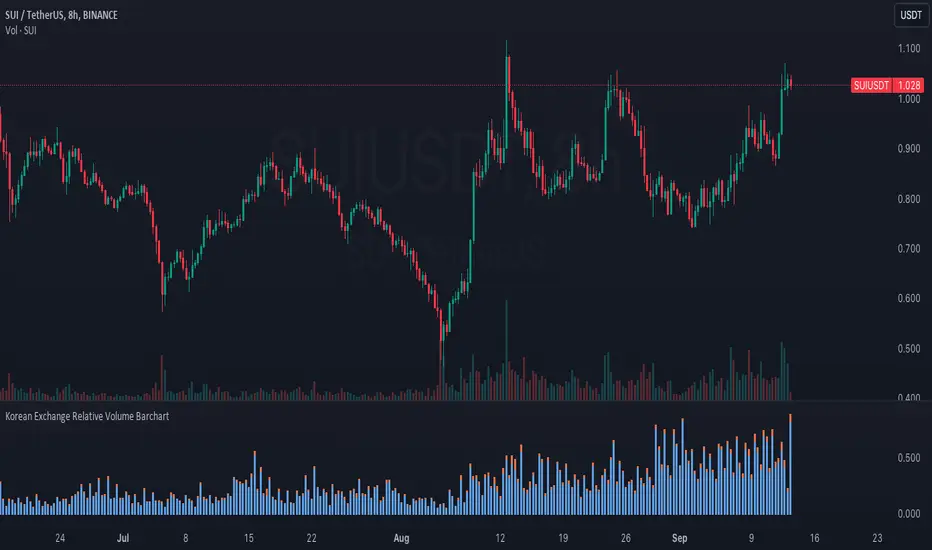
Korean Exchange Relative Volume BarchartKorean Exchange Relative Volume Barchart
The Korean Exchange Relative Volume Barchart indicator compares the trading volume of a cryptocurrency on any symbol with the combined volumes of major Korean exchanges, Upbit and Bithumb. This tool helps traders understand regional trading activities, offering insights into market sentiment influenced by Korean markets.
For example 0.5 would indicate that the Korean exchanges are doing 50% of the volume of the selected symbol.
Features:
Exchange Selection: Include or exclude Upbit and Bithumb in the comparison.
Automatic Symbol Mapping: Automatically maps the current chart's symbol to equivalent symbols on Upbit and Bithumb.
Stacked Bar Chart Visualization: Plots a stacked bar chart showing the relative volume contributions of Binance, Upbit, and Bithumb.
Usage:
Add the Indicator: Apply it to a cryptocurrency chart on TradingView.
Configure Settings: Toggle inclusion of Upbit and Bithumb in the settings.
Interpret the Chart: The stacked bar chart displays the proportion of trading volumes from each exchange.
Notes:
Symbol Compatibility: Ensure the cryptocurrency is listed on the Korean exchanges for accurate comparison.
Data Accuracy: Volumes are compared in the same base currency (e.g., BTC), so no exchange rate conversion is necessary.
Enhance your trading analysis by understanding the influence of Korean exchanges on cryptocurrency volumes with the Korean Exchange Volume Comparison indicator.
Uptrick: Logarithmic Crypto Bands
Description :
Introduction
The `Uptrick: Logarithmic Crypto Bands` indicator introduces an innovative approach to technical analysis tailored specifically for the cryptocurrency markets. By leveraging logarithmic transformations combined with dynamic exponential bands, this indicator offers a sophisticated method for identifying critical support and resistance levels, assessing market trends, and evaluating volatility. Its unique approach stands out from traditional indicators by addressing the specific challenges of high volatility and erratic price movements inherent in cryptocurrency trading.
Originality and Usefulness
** 1. Unique Logarithmic Transformation: **
- Innovation : Unlike traditional indicators that often use raw price data, the Uptrick: Logarithmic Crypto Bands applies a logarithmic transformation to the closing prices: logPrice = math.log(close). This approach is original because it reduces the impact of extreme price fluctuations, providing a smoother and more stable price series. This transformation addresses a common issue in cryptocurrency markets where large price swings can obscure true market trends.
- Advantage : The logarithmic transformation compresses the price range, which allows traders to better identify long-term trends and reduce the noise caused by outlier price movements. This results in a more reliable basis for analysis and enhances the ability to detect meaningful market patterns.
**2. Dynamic Exponential Bands :**
- Innovation : The indicator employs exponential calculations to derive dynamic support and resistance levels based on a central base line : baseLine * math.pow(multiplier, n). Unlike static bands that remain fixed regardless of market conditions, these bands adjust dynamically according to market volatility.
- Advantage : The dynamic nature of the bands provides a more responsive and adaptive tool for traders. As market volatility changes, the bands widen or narrow accordingly, offering a more accurate reflection of potential support and resistance levels. This adaptability improves the tool's effectiveness in varying market conditions compared to static or traditional bands.
Detailed Description and Substantiation
**1. Logarithmic Price Calculation :**
- Code : ` logPrice = math.log(close)
- Description : This calculation converts the closing price into its logarithmic value. By compressing the price range, it minimizes the distortion caused by extreme price movements, which can be particularly pronounced in the volatile cryptocurrency markets.
- Purpose : To provide a stabilized price series that facilitates more accurate trend analysis and reduces the influence of erratic price fluctuations.
**2. Moving Averages of Logarithmic Prices :**
- ** Long-Term Moving Average :**
- Code : maLongLogPrice = ta.sma(logPrice, longLength)
longLength = 2000
- ** Description : A simple moving average of the logarithmic price over a long period. This average helps filter out short-term noise and provides insight into the long-term market trend.
- Purpose : To offer a perspective on the overall market direction, making it easier to identify enduring trends and distinguish them from short-term price movements.
- Short-Term Moving Average :
- Code : maShortLogPrice = ta.sma(logPrice, shortLength) shortLength = 900
- Description : A simple moving average of the logarithmic price over a shorter period. This component captures more immediate price trends and potential reversal points.
- Purpose : To detect short-term trends and changes in market direction, allowing traders to make timely trading decisions based on recent price action.
**3. Base Line Calculation :**
- Code : baseLine = math.exp(maShortLogPrice)
- Description : Converts the short-term moving average of the logarithmic price back to the original price scale. This base line serves as the central reference point for calculating the surrounding bands.
- Purpose : To establish a benchmark level from which the exponential bands are calculated, providing a central reference for assessing potential support and resistance levels.
**4. Band Calculation and Plotting :**
- ** Code :**
- Band 1: plot(baseLine * math.pow(multiplier, 1), color=color.new(color.yellow, 20), linewidth=1, title="Band 1")
- Band 2: plot(baseLine * math.pow(multiplier, 2), color=color.new(color.yellow, 20), linewidth=1, title="Band 2")
- Band 3: plot(baseLine * math.pow(multiplier, 3), color=color.new(color.yellow, 20), linewidth=1, title="Band 3")
- Band 4: plot(baseLine * math.pow(multiplier, 4), color=color.new(color.yellow, 20), linewidth=1, title="Band 4")
- Band 5: plot(baseLine * math.pow(multiplier, 5), color=color.new(color.yellow, 10), linewidth=1, title="Band 5")
- Band 6: plot(baseLine * math.pow(multiplier, 6), color=color.new(color.yellow, 0), linewidth=1, title="Band 6")
- * Multiplier : Set at 1.3, adjusts the spacing between bands to accommodate varying levels of market volatility.
- Description : Bands are plotted at exponential intervals from the base line. Each band represents a potential support or resistance level, with the spacing between them increasing exponentially. The color opacity of each band indicates its level of significance, with closer bands being more relevant for immediate trading decisions.
** How to Use the Indicator :**
**1. Identifying Support and Resistance Levels :**
- Support Levels : The lower bands, closer to the base line, can act as potential support levels. When the price approaches these bands from above, they may indicate areas where the price could stabilize or reverse direction.
- Resistance Levels : The upper bands, further from the base line, serve as resistance levels. When the price nears these bands from below, they can act as barriers to price movement, potentially leading to reversals or stalls.
**2. Confirming Trends :**
- Uptrend Confirmation : When the price consistently remains above the base line and moves towards higher bands, it signals a strong bullish trend. This confirmation helps traders capitalize on upward price movements.
- Downtrend Confirmation : When the price stays below the base line and approaches lower bands, it indicates a bearish trend. This confirmation assists traders in acting on downward price movements.
3. Analyzing Volatility :
- Wide Bands : Wider spacing between bands reflects higher market volatility. This indicates a more turbulent trading environment, where price movements are less predictable. Traders may need to adjust their strategies to handle increased volatility.
- Narrow Bands : Narrower bands suggest lower volatility and a more stable market environment. This can result in more predictable price movements and clearer trading signals.
**4. Entry and Exit Points :**
- Entry Points : Consider buying when the price bounces off the base line or a band, which could signal support in an uptrend.
- Exit Points : Evaluate selling or taking profits when the price nears upper bands or shows signs of reversal at these levels. This approach helps in locking in gains or minimizing losses during a downtrend.
**Chart Example:**
Here you can see how the price reacted getting closer to this level. All green circles show a bounce-off. So just from looking at the chart we can see a potential bounce again pretty soon.
** Disclosure :**
- ** Performance Claims :** The `Uptrick: Logarithmic Crypto Bands` indicator is designed to assist traders in analyzing price levels and trends. It is important to understand that this tool provides historical data analysis and does not guarantee future performance. The features and benefits described are based on historical market behavior and should not be seen as a prediction of future results. Traders should use this indicator as part of a broader trading strategy and consider other factors before making trading decisions.

Cumulative Net Money FlowDescription:
Dive into the financial depth of the markets with the "Cumulative Net Money Flow" indicator, designed to provide a comprehensive view of the monetary dynamics in trading. This tool is invaluable for traders and investors seeking to quantify the actual money entering or exiting the market over a specified period.
Features:
Value-Weighted Calculations: This indicator multiplies the trading volume by the price, offering a money flow perspective rather than just counting shares or contracts.
Custom Timeframe Adaptability: Adjust the timeframe to match your trading strategy, whether you are day trading, swing trading, or looking for longer-term trends.
Cumulative Insight: Tracks and accumulates net money flow to highlight overall market sentiment, making it easier to spot trends in capital movement.
Color-Coded Visualization: Displays positive money flow in green and negative money flow in red, providing clear, visual cues about market conditions.
Utility: "Cumulative Net Money Flow" is particularly effective in revealing the strength behind market movements. By understanding whether the money flow is predominantly buying or selling, traders can better align their strategies with market sentiment. This indicator is suited for various asset classes, including stocks, cryptocurrencies, and forex.

Lockin Strength Indicator (LSI)How It Works:
RSI Calculation: The standard RSI is calculated using a 14-period by default.
Volume Weighting: If enabled, the LSI modifies the RSI by weighting it based on the volume relative to its moving average. This emphasizes periods of high or low volume, which can be particularly useful for Solana-based assets that might have unique volume profiles.
Plotting: The LSI is plotted with standard overbought and oversold levels, and background highlighting makes these areas visually distinct.
Customization:
RSI Length: You can adjust the length of the RSI period.
Overbought/Oversold Levels: You can modify the levels for overbought and oversold signals.
Volume Weighting: You can toggle volume weighting on or off.
This indicator is designed to give you a more nuanced view of Solana cryptocurrencies by combining RSI with volume dynamics.

Daily Levels Percentual [TOLK] Settings Crypto and ForexPercentage zones refer to specific areas or bands on the price chart of a financial asset that are bounded by percentages of change relative to a reference point, such as the opening price or a reference value from a previous move.
These zones are useful for identifying support and resistance levels, predicting possible price reversals, or setting price targets. For example, on a price chart, you can create percentage zones to observe how the price behaves when it reaches 1%, 2%, 5%, 10%, etc., above or below a certain point.
These zones can be used in conjunction with other technical analysis tools, such as Fibonacci, moving averages, or volume analysis, to improve decision-making in trading strategies.
The default indicator levels are as follows:
SETTINGS Crypto:
Crypto Level 1 > 1.0%
Crypto Level 2 > 1.618%
Crypto Level 3 > 2.0%
Crypto Level 4 > 2.618%
Crypto Level 5 > 3.618%
Crypto Level 6 > 4.618%
Crypto Level 7 > 5.0%
Crypto Level 8 > 7.618%
Crypto Level 9 > 10.0%
Crypto Level 10 > 12.618%
Crypto Level 11 > 13.618%
Crypto Level 12 > 15%
Crypto Level 13 > 17.618%
Crypto Level 14 > 20%
SETTINGS Forex:
Forex Level 1 > 0.10%
Forex Level 2 > 0.1618%
Forex Level 3 > 0.20%
Forex Level 4 > 0.2618%
Forex Level 5 > 0.3618%
Forex Level 6 > 0.4618%
Forex Level 7 > 0.50%
Forex Level 8 > 0.7618%
Forex Level 9 > 1.0%
Forex Level 10 > 1.2618%
Forex Level 11 > 1.3618%
Forex Level 12 > 1.50%
Forex Level 13 > 1.7618%
Forex Level 14 > 2.0%
Percentage Levels This approach helps identify critical price levels where the asset may encounter support or resistance, making it easier to make trading decisions based on price movement patterns.

Capitulation Candle for Bitcoin and Crypto V1.0 [ADRIDEM]Overview
The Capitulation Candle for Bitcoin and Crypto script identifies potential capitulation events in the cryptocurrency market. Capitulation candles indicate a significant sell-off, often marking a potential market bottom. This script highlights such candles by analyzing volume, price action, and other technical conditions. Below is a detailed presentation of the script and its unique features.
Unique Features of the New Script
Volume-Based Analysis : Uses a volume multiplier to detect unusually high trading volumes, which are characteristic of capitulation events. The default multiplier is 5.0, but it can be adjusted to suit different market conditions.
Support Level Detection : Looks back over a customizable period (default is 150 bars) to find support levels, helping to identify significant price breaks.
ATR-Based Range Condition : Ensures that the price range of a capitulation candle is a multiple of the Average True Range (ATR), confirming significant price movement. The default ATR multiplier is 10.0.
Dynamic Dot Sizes : Plots dots of different sizes below capitulation candles based on volume thresholds, providing a visual indication of the volume's significance.
Visual Indicators : Highlights capitulation candles and plots support levels, offering clear visual cues for potential market bottoms.
Originality and Usefulness
This script uniquely combines volume analysis, support level detection, and ATR-based range conditions to identify capitulation candles. The dynamic dot sizes and clear visual indicators make it an effective tool for traders looking to spot potential reversal points in the cryptocurrency market.
Signal Description
The script includes several features that highlight potential capitulation events:
High Volume Detection : Identifies candles with unusually high trading volumes using a customizable volume multiplier.
Support Level Breaks : Detects candles breaking significant support levels over a customizable lookback period.
ATR Range Condition : Ensures the candle's range is significant compared to the ATR, confirming substantial price movement.
Dynamic Dot Sizes : Plots small, normal, and large dots below candles based on different volume thresholds.
These features assist in identifying potential capitulation events and provide visual cues for traders.
Detailed Description
Input Variables
Volume Multiplier (`volMultiplier`) : Detects high-volume candles using this multiplier. Default is 5.0.
Support Lookback Period (`supportLookback`) : The period over which support levels are calculated. Default is 150.
ATR Multiplier (`atrMultiplier`) : Ensures the candle's range is a multiple of the ATR. Default is 10.0.
Small Volume Multiplier Threshold (`smallThreshold`) : Threshold for small dots. Default is 5.
Normal Volume Multiplier Threshold (`normalThreshold`) : Threshold for normal dots. Default is 10.
Large Volume Multiplier Threshold (`largeThreshold`) : Threshold for large dots. Default is 15.
Functionality
High Volume Detection : The script calculates the simple moving average (SMA) of the volume and checks if the current volume exceeds the SMA by a specified multiplier.
```pine
smaVolume = ta.sma(volume, supportLookback)
isHighVolume = volume > smaVolume * volMultiplier
```
Support Level Detection : Determines the lowest low over the lookback period to identify significant support levels.
```pine
supportLevel = ta.lowest(low , supportLookback)
isLowestLow = low == supportLevel
```
ATR Range Condition : Calculates the ATR and ensures the candle's range is significant compared to the ATR.
```pine
atr = ta.atr(supportLookback)
highestHigh = ta.highest(high, supportLookback)
rangeCondition = (highestHigh - low ) >= (atr * atrMultiplier)
```
Combining Conditions : Combines various conditions to identify capitulation candles.
```pine
isHigherVolumeThanNext = volume > volume
isHigherVolumeThanPrevious = volume > volume
bodySize = math.abs(close - open )
candleRange = high - low
rangeBiggerThanPreviousBody = candleRange > bodySize
isCapitulationCandle = isHighVolume and isHigherVolumeThanPrevious and isHigherVolumeThanNext and isLowestLow and rangeCondition and rangeBiggerThanPreviousBody
```
Dynamic Dot Sizes : Determines dot sizes based on volume thresholds and plots them below the identified capitulation candles.
```pine
isSmall = volume > smaVolume * smallThreshold and volume <= smaVolume * normalThreshold
isNormal = volume > smaVolume * normalThreshold and volume <= smaVolume * largeThreshold
isLarge = volume > smaVolume * largeThreshold
plotshape(series=isCapitulationCandle and isSmall, location=location.belowbar, offset=-1, color=color.rgb(255, 82, 82, 40), style=shape.triangleup, size=size.small)
plotshape(series=isCapitulationCandle and isNormal, location=location.belowbar, offset=-1, color=color.rgb(255, 82, 82, 30), style=shape.triangleup, size=size.normal)
plotshape(series=isCapitulationCandle and isLarge, location=location.belowbar, offset=-1, color=color.rgb(255, 82, 82, 20), style=shape.triangleup, size=size.large)
```
Plotting : The script plots support levels and highlights capitulation candles with different sizes based on volume significance.
```pine
plot(supportLevel, title="Support Level", color=color.rgb(255, 82, 82, 50), linewidth=1, style=plot.style_line)
```
How to Use
Configuring Inputs : Adjust the volume multiplier, support lookback period, ATR multiplier, and volume thresholds as needed.
Interpreting the Indicator : Use the plotted support levels and highlighted capitulation candles to identify potential market bottoms and reversal points.
Signal Confirmation : Look for capitulation candles with high volumes breaking significant support levels and meeting the ATR range condition. The dynamic arrow sizes help to assess the volume's significance.
This script provides a detailed and visual method to identify potential capitulation events in the cryptocurrency market, aiding traders in spotting possible reversal points and making informed trading decisions.

Bitcoin Futures vs. Spot Tri-Frame - Strategy [presentTrading]Prove idea with a backtest is always true for trading.
I developed and open-sourced it as an educational material for crypto traders to understand that the futures and spot spread may be effective but not be as effective as they might think. It serves as an indicator of sentiment rather than a reliable predictor of market trends over certain periods. It is better suited for specific trading environments, which require further research.
█ Introduction and How it is Different
The "Bitcoin Futures vs. Spot Tri-Frame Strategy" utilizes three different timeframes to calculate the Z-Score of the spread between BTC futures and spot prices on Binance and OKX exchanges. The strategy executes long or short trades based on composite Z-Score conditions across the three timeframes.
The spread refers to the difference in price between BTC futures and BTC spot prices, calculated by taking a weighted average of futures prices from multiple exchanges (Binance and OKX) and subtracting a weighted average of spot prices from the same exchanges.
BTCUSD 1D L/S Performance
█ Strategy, How It Works: Detailed Explanation
🔶 Calculation of the Spread
The spread is the difference in price between BTC futures and BTC spot prices. The strategy calculates the spread by taking a weighted average of futures prices from multiple exchanges (Binance and OKX) and subtracting a weighted average of spot prices from the same exchanges. This spread serves as the primary metric for identifying trading opportunities.
Spread = Weighted Average Futures Price - Weighted Average Spot Price
🔶 Z-Score Calculation
The Z-Score measures how many standard deviations the current spread is from its historical mean. This is calculated for each timeframe as follows:
Spread Mean_tf = SMA(Spread_tf, longTermSMA)
Spread StdDev_tf = STDEV(Spread_tf, longTermSMA)
Z-Score_tf = (Spread_tf - Spread Mean_tf) / Spread StdDev_tf
Local performance
🔶 Composite Entry Conditions
The strategy triggers long and short entries based on composite Z-Score conditions across all three timeframes:
- Long Condition: All three Z-Scores must be greater than the long entry threshold.
Long Condition = (Z-Score_tf1 > zScoreLongEntryThreshold) and (Z-Score_tf2 > zScoreLongEntryThreshold) and (Z-Score_tf3 > zScoreLongEntryThreshold)
- Short Condition: All three Z-Scores must be less than the short entry threshold.
Short Condition = (Z-Score_tf1 < zScoreShortEntryThreshold) and (Z-Score_tf2 < zScoreShortEntryThreshold) and (Z-Score_tf3 < zScoreShortEntryThreshold)
█ Trade Direction
The strategy allows the user to specify the trading direction:
- Long: Only long trades are executed.
- Short: Only short trades are executed.
- Both: Both long and short trades are executed based on the Z-Score conditions.
█ Usage
The strategy can be applied to BTC or Crypto trading on major exchanges like Binance and OKX. By leveraging discrepancies between futures and spot prices, traders can exploit market inefficiencies. This strategy is suitable for traders who prefer a statistical approach and want to diversify their timeframes to validate signals.
█ Default Settings
- Input TF 1 (60 minutes): Sets the first timeframe for Z-Score calculation.
- Input TF 2 (120 minutes): Sets the second timeframe for Z-Score calculation.
- Input TF 3 (180 minutes): Sets the third timeframe for Z-Score calculation.
- Long Entry Z-Score Threshold (3): Defines the threshold above which a long trade is triggered.
- Short Entry Z-Score Threshold (-3): Defines the threshold below which a short trade is triggered.
- Long-Term SMA Period (100): The period used to calculate the simple moving average for the spread.
- Use Hold Days (true): Enables holding trades for a specified number of days.
- Hold Days (5): Number of days to hold the trade before exiting.
- TPSL Condition (None): Defines the conditions for taking profit and stop loss.
- Take Profit (%) (30.0): The percentage at which the trade will take profit.
- Stop Loss (%) (20.0): The percentage at which the trade will stop loss.
By fine-tuning these settings, traders can optimize the strategy to suit their risk tolerance and trading style, enhancing overall performance.

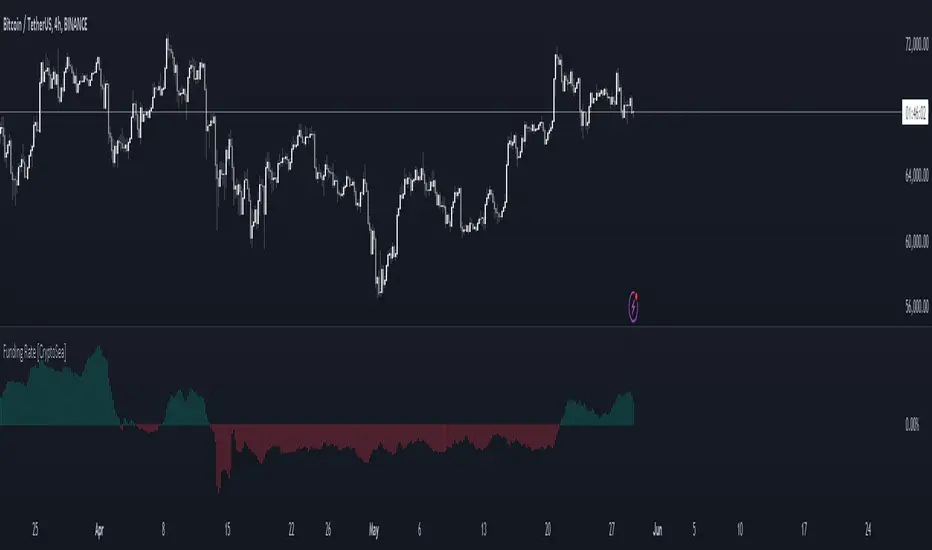
Funding Rate [CryptoSea]The Funding Rate Indicator by is a comprehensive tool designed to analyze funding rates across multiple cryptocurrency exchanges. This indicator is essential for traders who want to monitor funding rates and their impact on market trends.
Key Features
Exchange Coverage: Includes data from major exchanges such as Binance, Bitmex, Bybit, HTX, Kraken, OKX, Bitstamp, and Coinbase.
Perpetual Futures and Spot Markets: Fetches and analyzes pricing data from both perpetual futures and spot markets to provide a holistic view.
Smoothing and Customization: Allows users to smooth funding rates using a moving average, with customizable MA lengths for tailored analysis.
Dynamic Candle Coloring: Option to color candles based on trading conditions, enhancing visual analysis.
In the example below, the indicator shows how the funding rate shifts with market conditions, providing clear visual cues for bullish and bearish trends.
How it Works
Data Integration: Uses a secure security fetching function to retrieve pricing data while preventing look-ahead bias, ensuring accurate and reliable information.
TWAP Calculation: Computes Time-Weighted Average Prices (TWAP) for both perpetual futures and spot prices, forming the basis for funding rate calculations.
Funding Rate Calculation: Determines the raw funding rate by comparing TWAPs of perpetual futures and spot prices, then applies smoothing to highlight significant trends.
Color Coding: Highlights the funding rate with distinct colors (bullish and bearish), making it easier to interpret market conditions at a glance.
In the example below, the indicator effectively differentiates between bullish and bearish funding rates, aiding traders in making informed decisions based on current market dynamics.
Application
Market Analysis: Enables traders to analyze the impact of funding rates on market trends, facilitating more strategic decision-making.
Trend Identification: Assists in identifying potential market reversals by monitoring shifts in funding rates.
Customizable Settings: Provides extensive input settings for exchange selection, MA length, and candle coloring, allowing for personalized analysis.
The Funding Rate Indicator by is a powerful addition to any trader's toolkit, offering detailed insights into funding rates across multiple exchanges to navigate the cryptocurrency market effectively.
RSI Screener / Heatmap - By LeviathanThis script allows you to quickly scan the market by displaying the RSI values of up to 280 tickers at once and visualizing them in an easy-to-understand format using labels with heatmap coloring.
📊 Source
The script can display the RSI from a custom timeframe (MTF) and custom length for the following data:
- Price
- OBV (On Balance Volume)
- Open Interest (for crypto tickers)
📋 Ticker Selection
This script uses a different approach for selecting tickers. Instead of inputting them one by one via input.symbol(), you can now copy-paste or edit a list of tickers in the text area window. This approach allows users to easily exchange ticker lists between each other and, for example, create multiple lists of tickers by sector, market cap, etc., and easily input them into the script. Full credit to @allanster for his functions for extracting tickers from the text. Users can switch between 7 groups of 40 tickers each, totaling 280 tickers.
🖥️ Display Types
- Screener with Labels: Each ticker has its own color-coded label located at its RSI value.
- Group Average RSI: A standard RSI plot that displays the average RSI of all tickers in the group.
- RSI Heatmap (coming soon): Color-coded rows displaying current and historical values of tickers.
- RSI Divergence Heatmap (coming soon): Color-coded rows displaying current and historical regular/hidden bullish/bearish divergences for tickers.
🎨 Appearance
Appearance is fully customizable via user inputs, allowing you to change heatmap/gradient colors, zone coloring, and more.

Entry FraggerEntry Fragger is a simple buy signal indicator.
It is most suitable for cryptocurrency, especially for altcoins on the 5 minute to daily timeframe and is based on simple volume calculations, in combination with EMA's.
Main Signal Logic explained:
A buy signal is generated by counting candles with an above average sell volume of 130% to 170%, taking into account the candles position below and above the 50 and 200 EMA.
If criteria meet, the first green candle above the 50 EMA's suggests upcoming higher prices.
The indicator has 2 input variables.
"Signal Confirmations (0 - 7):" Changes signal accuracy by a defining an ammount of high sell volume candles necessary below the 50 EMA.
"Volume Calculation Base (9 - 200):" Sets the exponential volume multiplier, this affects candle coloring and the volume calculation inside the candle.
"Style Settings": Turn ON/OFF Signals, Cloud, Bar Coloring, EMA's, etc...
There are no generally suitable default numbers for those 2 inputs, those have to be tested out, depending on cryptocurrency and timeframe.
The calculation is very basic, the underlying idea being, market maker initiating range breakouts through rapid increase of volume above or below the EMA's .
Example settings:
SOLUSDT: Signal Confirmations: 2, Volume Calculation Base 13.
SOLUSDT: Signal Confirmations: 0, Volume Calculation Base 20.
As you can see it affects signals quite a lot, but staying accurate.
Finetune the inputs to your preference.
Risk to Reward, Stoploss, Take Profit, position sizing, etc... is up to the user.
Recommended entry is to wait for following candle closes, entering half of the candle size and setting Stoploss outside the structure, like this:
Or right below the candles open, for safety.

Bitcoin Momentum StrategyThis is a very simple long-only strategy I've used since December 2022 to manage my Bitcoin position.
I'm sharing it as an open-source script for other traders to learn from the code and adapt it to their liking if they find the system concept interesting.
General Overview
Always do your own research and backtesting - this script is not intended to be traded blindly (no script should be) and I've done limited testing on other markets beyond Ethereum and BTC, it's just a template to tweak and play with and make into one's own.
The results shown in the strategy tester are from Bitcoin's inception so as to get a large sample size of trades, and potential returns have diminished significantly as BTC has grown to become a mega cap asset, but the script includes a date filter for backtesting and it has still performed solidly in recent years (speaking from personal experience using it myself - DYOR with the date filter).
The main advantage of this system in my opinion is in limiting the max drawdown significantly versus buy & hodl. Theoretically much better returns can be made by just holding, but that's also a good way to lose 70%+ of your capital in the inevitable bear markets (also speaking from experience).
In saying all of that, the future is fundamentally unknowable and past results in no way guarantee future performance.
System Concept:
Capture as much Bitcoin upside volatility as possible while side-stepping downside volatility as quickly as possible.
The system uses a simple but clever momentum-style trailing stop technique I learned from one of my trading mentors who uses this approach on momentum/trend-following stock market systems.
Basically, the system "ratchets" up the stop-loss to be much tighter during high bearish volatility to protect open profits from downside moves, but loosens the stop loss during sustained bullish momentum to let the position ride.
It is invested most of the time, unless BTC is trading below its 20-week EMA in which case it stays in cash/USDT to avoid holding through bear markets. It only trades one position (no pyramiding) and does not trade short, but can easily be tweaked to do whatever you like if you know what you're doing in Pine.
Default parameters:
HTF: Weekly Chart
EMA: 20-Period
ATR: 5-period
Bar Lookback: 7
Entry Rule #1:
Bitcoin's current price must be trading above its higher-timeframe EMA (Weekly 20 EMA).
Entry Rule #2:
Bitcoin must not be in 'caution' condition (no large bearish volatility swings recently).
Enter at next bar's open if conditions are met and we are not already involved in a trade.
"Caution" Condition:
Defined as true if BTC's recent 7-bar swing high minus current bar's low is > 1.5x ATR, or Daily close < Daily 20-EMA.
Trailing Stop:
Stop is trailed 1 ATR from recent swing high, or 20% of ATR if in caution condition (ie. 0.2 ATR).
Exit on next bar open upon a close below stop loss.
I typically use a limit order to open & exit trades as close to the open price as possible to reduce slippage, but the strategy script uses market orders.
I've never had any issues getting filled on limit orders close to the market price with BTC on the Daily timeframe, but if the exchange has relatively low slippage I've found market orders work fine too without much impact on the results particularly since BTC has consistently remained above $20k and highly liquid.
Cost of Trading:
The script uses no leverage and a default total round-trip commission of 0.3% which is what I pay on my exchange based on their tier structure, but this can vary widely from exchange to exchange and higher commission fees will have a significantly negative impact on realized gains so make sure to always input the correct theoretical commission cost when backtesting any script.
Static slippage is difficult to estimate in the strategy tester given the wide range of prices & liquidity BTC has experienced over the years and it largely depends on position size, I set it to 150 points per buy or sell as BTC is currently very liquid on the exchange I trade and I use limit orders where possible to enter/exit positions as close as possible to the market's open price as it significantly limits my slippage.
But again, this can vary a lot from exchange to exchange (for better or worse) and if BTC volatility is high at the time of execution this can have a negative impact on slippage and therefore real performance, so make sure to adjust it according to your exchange's tendencies.
Tax considerations should also be made based on short-term trade frequency if crypto profits are treated as a CGT event in your region.
Summary:
A simple, but effective and fairly robust system that achieves the goals I set for it.
From my preliminary testing it appears it may also work on altcoins but it might need a bit of tweaking/loosening with the trailing stop distance as the default parameters are designed to work with Bitcoin which obviously behaves very differently to smaller cap assets.
Good luck out there!

Bitcoin Leverage Sentiment - Strategy [presentTrading]█ Introduction and How it is Different
The "Bitcoin Leverage Sentiment - Strategy " represents a novel approach in the realm of cryptocurrency trading by focusing on sentiment analysis through leveraged positions in Bitcoin. Unlike traditional strategies that primarily rely on price action or technical indicators, this strategy leverages the power of Z-Score analysis to gauge market sentiment by examining the ratio of leveraged long to short positions. By assessing how far the current sentiment deviates from the historical norm, it provides a unique lens to spot potential reversals or continuation in market trends, making it an innovative tool for traders who wish to incorporate market psychology into their trading arsenal.
BTC 4h L/S Performance
local
█ Strategy, How It Works: Detailed Explanation
🔶 Data Collection and Ratio Calculation
Firstly, the strategy acquires data on leveraged long (**`priceLongs`**) and short positions (**`priceShorts`**) for Bitcoin. The primary metric of interest is the ratio of long positions relative to the total of both long and short positions:
BTC Ratio=priceLongs / (priceLongs+priceShorts)
This ratio reflects the prevailing market sentiment, where values closer to 1 indicate a bullish sentiment (dominance of long positions), and values closer to 0 suggest bearish sentiment (prevalence of short positions).
🔶 Z-Score Calculation
The Z-Score is then calculated to standardize the BTC Ratio, allowing for comparison across different time periods. The Z-Score formula is:
Z = (X - μ) / σ
Where:
- X is the current BTC Ratio.
- μ is the mean of the BTC Ratio over a specified period (**`zScoreCalculationPeriod`**).
- σ is the standard deviation of the BTC Ratio over the same period.
The Z-Score helps quantify how far the current sentiment deviates from the historical norm, with high positive values indicating extreme bullish sentiment and high negative values signaling extreme bearish sentiment.
🔶 Signal Generation: Trading signals are derived from the Z-Score as follows:
Long Entry Signal: Occurs when the BTC Ratio Z-Score crosses above the thresholdLongEntry, suggesting bullish sentiment.
- Condition for Long Entry = BTC Ratio Z-Score > thresholdLongEntry
Long Exit/Short Entry Signal: Triggered when the BTC Ratio Z-Score drops below thresholdLongExit for exiting longs or below thresholdShortEntry for entering shorts, indicating a shift to bearish sentiment.
- Condition for Long Exit/Short Entry = BTC Ratio Z-Score < thresholdLongExit or BTC Ratio Z-Score < thresholdShortEntry
Short Exit Signal: Happens when the BTC Ratio Z-Score exceeds the thresholdShortExit, hinting at reducing bearish sentiment and a potential switch to bullish conditions.
- Condition for Short Exit = BTC Ratio Z-Score > thresholdShortExit
🔶Implementation and Visualization: The strategy applies these conditions for trade management, aligning with the selected trade direction. It visualizes the BTC Ratio Z-Score with horizontal lines at entry and exit thresholds, illustrating the current sentiment against historical norms.
█ Trade Direction
The strategy offers flexibility in trade direction, allowing users to choose between long, short, or both, depending on their market outlook and risk tolerance. This adaptability ensures that traders can align the strategy with their individual trading style and market conditions.
█ Usage
To employ this strategy effectively:
1. Customization: Begin by setting the trade direction and adjusting the Z-Score calculation period and entry/exit thresholds to match your trading preferences.
2. Observation: Monitor the Z-Score and its moving average for potential trading signals. Look for crossover events relative to the predefined thresholds to identify entry and exit points.
3. Confirmation: Consider using additional analysis or indicators for signal confirmation, ensuring a comprehensive approach to decision-making.
█ Default Settings
- Trade Direction: Determines if the strategy engages in long, short, or both types of trades, impacting its adaptability to market conditions.
- Timeframe Input: Influences signal frequency and sensitivity, affecting the strategy's responsiveness to market dynamics.
- Z-Score Calculation Period: Affects the strategy’s sensitivity to market changes, with longer periods smoothing data and shorter periods increasing responsiveness.
- Entry and Exit Thresholds: Set the Z-Score levels for initiating or exiting trades, balancing between capturing opportunities and minimizing false signals.
- Impact of Default Settings: Provides a balanced approach to leverage sentiment trading, with adjustments needed to optimize performance across various market conditions.

Blockunity Address Synthesis (BAS)Track the address status of the various cryptoassets and their evolution.
The Idea
The goal is to provide a simple tool for visualizing the evolution of different types of crypto addresses.
How to Use
This tool is to be used as fundamental information. It is not intended for investment or trading purposes.
Elements
Active Addresses
Active Addresses represent the subset of total addresses that made one or more on-chain transaction on a given day.
New Addresses
New Addresses refer to addresses that receive their first deposit in the selected crypto-asset.
Zero Balance Addresses
Zero Balance Addresses are addresses that transferred out (potentially sold) all of their holdings for the selected crypto-asset.
Total Addresses
Total Addresses refer to the overall count of unique addresses that have been created on a blockchain network.
Settings
In the settings, you can :
Adjust line smoothing (in terms of number of days).
Change the lookback period used to calculate the different variations.
Display or not the different address types (for better visualization, Total Addresses should be shown alone).
Show or hide labels and configure their offset.
Lastly, you can modify all table parameters.

Market Activity Risk"Market Activity Risk" (MAR) - Is a dynamic tool designed to structurize the competitive landscape of blockchain transaction blocks, offering traders a strategic edge in anticipating market movements.
By capturing where market participants are actively buying and selling, the MAR indicator provides insights into areas of high competition, allowing traders to make informed decisions and potentially front-run transactions.
At the heart of this tool are blockchain transaction fees , they can represent daily shifts in transaction fee pressures.
By measuring momentum in fees, we can analyze the urgency and competition among traders to have their transactions processed first. This indicator is particularly good at revealing potential support or resistance zones, areas where traders are likely to defend their positions or increase their stakes, thus serving as critical junctures for strategic decision-making.
Key Features:
Adaptable Standard Deviation Settings: Users have the flexibility to adjust the length of the standard deviation and its multipliers, managing the risk bands to their individual risk tolerance.
Color-Coded Risk Levels: The MAR indicator employs an intuitive color scheme, making it easy to interpret the data at a glance.
Multi-Currency Compatibility: While designed with Bitcoin in mind, the MAR indicator is versatile, functioning effectively across various cryptocurrencies including Ethereum, XRP, and several other major altcoins. This broad compatibility ensures that traders across different market segments can leverage the insights provided by this tool.
Customizable Moving Average: The 730-day moving average setting is thoughtfully chosen to reflect the nuances of a typical cryptocurrency cycle, capturing long-term trends and fluctuations. However, recognizing the diverse needs and perspectives of traders, the indicator allows for the moving average period to be modified.
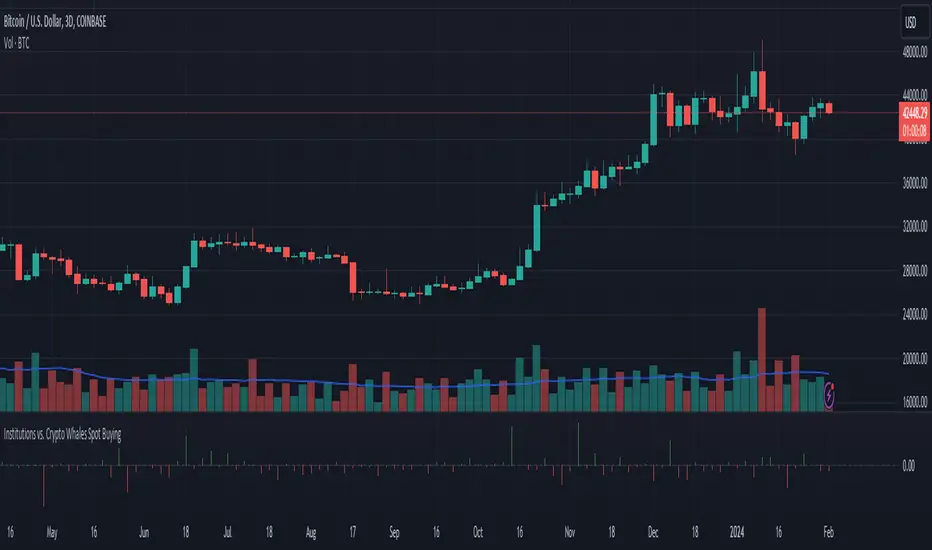
Institutions vs. Crypto Whales Spot BuyingBased on analysis from @tedtalksmacro, I have put together a similar tool that helps to visualise whether institutions (Coinbase and Deribit) or native crypto whales (Binance and Bitfinex) are leading the BTC spot buying.
This is plotted as the normalised relative difference (-1 and 1) between the average of Coinbase and Deribit spot price versus Binance and Bitfinex. If positive (i.e. green bar), institutions are trading at a premium; if negative (i.e. red bar), crypto whales are trading at a premium.
For example, if crypto whales are trading at a premium and price is increasing, then they are leading the buying relative to institutions. However, if whales are trading at a premium and price is decreasing, then it is likely institutions are selling off at a more rapid rate relative to the crypto whales buying pressure. This applies to the alternate scenario where institutions are trading at a premium to crypto whales.
In recent times, native crypto whales (largely Binance) drove the push from 40 to 48k, but then also marked the local top with a major sell off at this price. Institutions then took over buying at the most recent lows, driven largely by GBTC outflows slowing down and Blackrock daily inflows exceeding Grayscale outflows for the first time late last week.
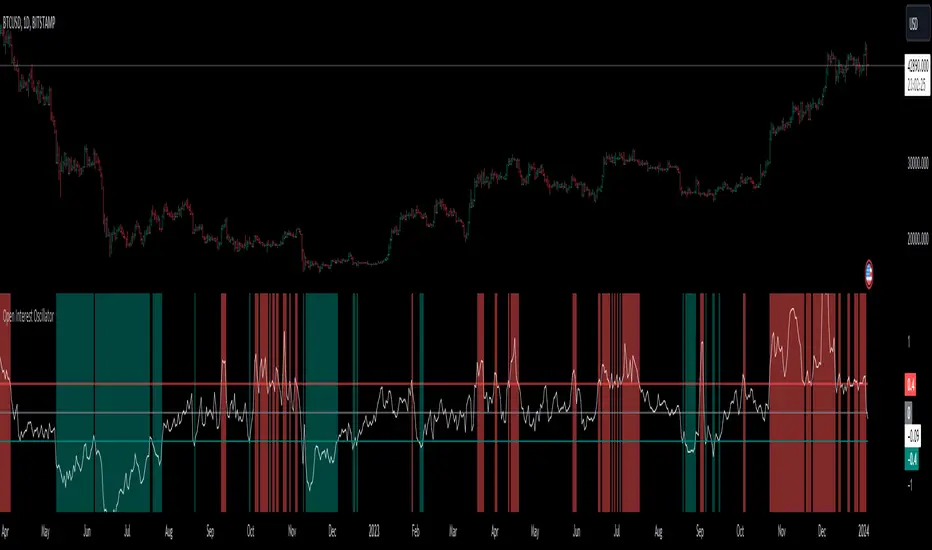
Open Interest OscillatorIn the middle of a bustling cryptocurrency market, with Bitcoin navigating a critical phase and the community hype over potential ETF approvals, current funding rates, and market leverage, the timing is optimal to harness the capabilities of sophisticated trading tools.
Meet the Open Interest Oscillator – special indicator tailored for the volatile arena of cryptocurrency trading. This powerful instrument is adept at consolidating open interest data from a multitude of exchanges, delivering an in-depth snapshot of market sentiment across all timeframes, be it a 1-minute sprint or a weekly timeframe.
This versatile indicator is compatible with nearly all cryptocurrency pairs, offering an expansive lens through which traders can gauge the market's pulse.
Key Features:
-- Multi-exchange Data Aggregation: This feature taps into the heart of the crypto market by aggregating open interest data from premier exchanges such as BINANCE, BITMEX, BITFINEX, and KRAKEN. It goes a step further by integrating data from various pairs and stablecoins, thus providing traders with a rich, multi-dimensional view of market activities.
-- Open Interest Bars: Witness the flow of market dynamics through bars that depict the volume of positions being opened or closed, offering a clear visual cue of trading behavior. In this mode, If bars are going into negative zone, then traders are closing their positions. If they go into positive territory - leveraged positions are being opened.
-- Bollinger Band Integration: Incorporate a layer of statistical analysis with standard deviation calculations, which frame the open interest changes, giving traders a quantified edge to evaluate the market's volatility and momentum.
-- Oscillator with Customizable Thresholds: Personalize your trading signals by setting thresholds that resonate with your unique trading tactics. This customization brings the power of tailored analytics to your strategic arsenal.
-- Max OI Ceiling Setting: In the fast-paced crypto environment where data can surge to overwhelming levels, the Max OI Ceiling ensures you maintain a clear view by capping the open interest data, thus preserving the readability and interpretability of information, even when market activity reaches feverish heights.
Altcoin ManagerThe Altcoin Manager is a comprehensive script for identifying the current altcoin narrative by tracking and analyzing of a wide array of altcoins across various blockchain layers and categories, such as DeFi, GameFi, AI, and Meme coins. Ideal for traders looking to get a broad yet detailed view of the altcoin market, covering various sectors and chains.
The Key Features:
Versatile Asset Tracking:
Tracks 40 different cryptocurrencies (as of publishing) across different categories, allowing for a diversified and detailed analysis of the altcoin market.
Customizable Assets and Category Analysis:
Select 20 of your own coins across 4 different categories such as DeFi, GameFi, AI, and Meme coins as well as specifying their individual chains.
Dynamic Layer and Chain Analysis:
Includes options to plot and analyze specific blockchain layers and chains such as Ethereum Chain, Solana Chain, BNB Smart Chain, Arbitrum Chain, and Polygon Chain. The script associates various assets with specific blockchains, providing a clearer picture of how different segments of the altcoin market are performing.
Cumulative and Per-Candle Change:
Switch between viewing the total cumulative change since a set start date or the per-candle change, offering flexibility in analyzing price movements over different timeframes.
Denomination Adjustment:
Includes a functionality to denominate asset prices in other currencies or crypto such as BTC, allowing for a more tailored financial analysis according to your preference.
Moving Averages for Categories and Chains:
Calculates and plots moving averages for each category and chain, aiding in the identification of trends over the selected moving average length.
How do I use it?
This script is not used with any particular chart. Instead, assign it it's own tab and layout.
For a clearer analysis, use multiple different panels to track Categories and Chains separately, both Cumulative for a longer term analysis and Per-Candle to find ongoing breakouts and changes in trend.
You can either use the pre-selected altcoins to represent the market, or you can select your own.
The Layer 1 and Layer 2 are not customizable but consists of 15 popular Layer 1 incl Bitcoin, Ethereum, Solana etc. Layer 2 consists of 5 popular Layer 2.
