Rate Of Change Trend Strategy (ROC)This is very simple trend following or momentum strategy. If the price change over the past number of bars is positive, we buy. If the price change over the past number of bars is negative, we sell. This is surprisingly robust, simple, and effective especially on trendy markets such as cryptos.
Works for many markets such as:
INDEX:BTCUSD
INDEX:ETHUSD
SP:SPX
NASDAQ:NDX
NASDAQ:TSLA
Cari dalam skrip untuk "crypto"

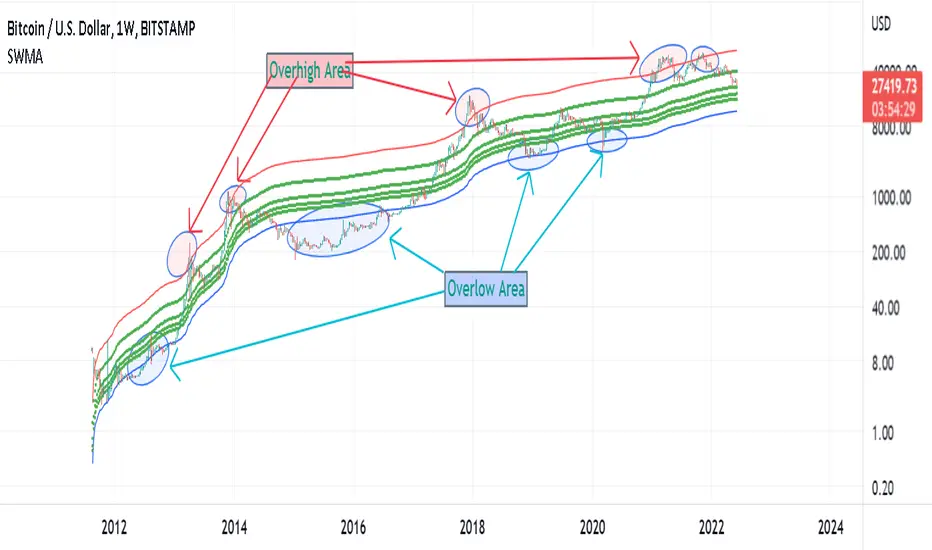
Supply Weighted Moving Average: OnchinUse this Onchain Channel in Weekly Timeframe - on BTCUSD BUTSTAMP Chart:
This Moving average channel is weighted based on BTC's new Supply:
I believe the slope of the Bitcoin trend line is correlated to the new supply and the issue of Halving.
The chart below shows this:
In fact, after each Halving, the supply is halved. Halving the supply increases the demand-for-supply ratio and increases the price. But the uptrend slope also halves after each halving.
Therefore, the slope of the bitcoin trend is correlated with the new supply rate. This is the logic of this new metric.
Accordingly, the moving average is weighted based on the new supply. This new channel can identify where bitcoin is too cheap or too expensive in the historical chart. It has also marked support/resistance Supply Weighted Moving Average.
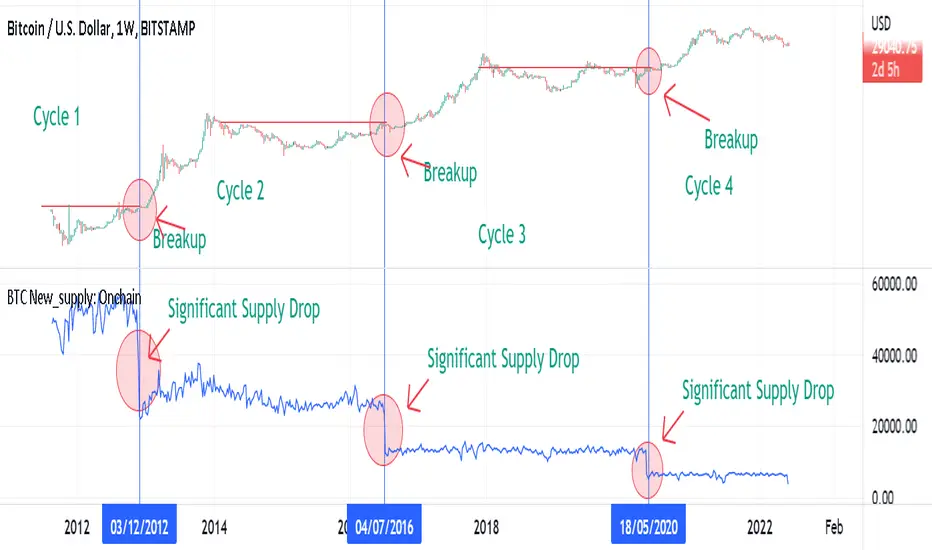
BTC New Supply: OnchainThis Onchain Metric shows the sum of newly issued coins.
This metric is very useful for finding new bull run cycles in the market. The new bull run is accompanied by a significant drop in the new supply.
BTC Supply weighted channel: OnchainUse this oscillator in the weekly time frame and then draw the above linear channel
The premise of this idea is that the trend slope of the bitcoin price correlates with the bitcoin supply chart, which shows the total amount of bitcoin ever created/issued.
Therefore, Bitcoin price is weighted based on Bitcoin supply.
As a result, the above channel has been created, which is a linear channel, and it seems that it can be an oscillator to determine the bitcoin trend, as well as the tops and bottoms of the market.
Bitcoin seems to respect the bottom and top lines of this channel as well as its midline

BTC Leading SOPR: OnchainUse This indicator in Weekly Timeframe:
This Onchain Metric is based on SOPR Moving Average.
This metric is very efficient for finding the tops and bottoms of the market as well as the ascending or descending biases in the market.
You can use it alongside RSI to filter out incorrect rsi signals
overhigh areas signal a top, overlow areas signal a low, zero line cross-up indicates an uptrend bias and its cross-down indicates a downtrend bias in the market

ETH MA ChannelThe 200-week moving average for bitcoin is considered to be the most popular bitcoin support and determines the bitcoin price bottom. But examining this index in the case of bitcoin does not have the same result for Ethereum. The above moving average channel is designed according to the price action of ETH to determine its top and bottom based on the 200w moving average. This channel has a good performance on the historical chart.

Bitcoin Bottom Detector: W TimeframeUse this indicator in the weekly time frame:
One of the most widely used indicators for identifying the Bitcoin market bottom is the 200-week moving average. This indicator works based on the ratio of price to the value of the 200-week moving average. When the indicator enters the lower blue part (overflow area), it indicates the bitcoin is in the bottom of the market.

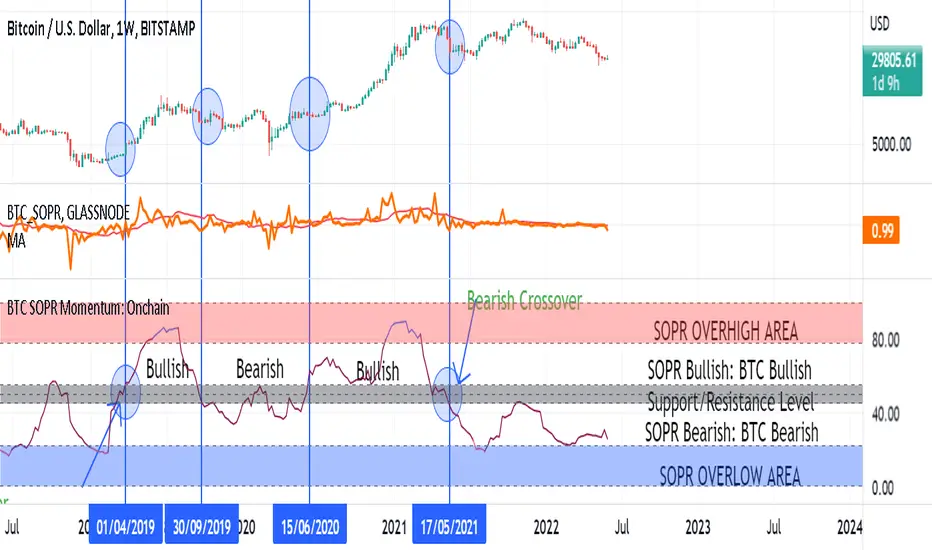
BTC SOPR Momentum: OnchainThis Onchin metric is based on SOPR data
Use this metric on daily and weekly timeframes:
SOPR:
The Spent Output Profit Ratio (SOPR) is computed by dividing the realized value (in USD) divided by the value at creation (USD) of a spent output. Or simply: price sold / price paid. Renato Shirakashi created this metric. When SOPR > 1, it means that the owners of the spent outputs are in profit at the time of the transaction; otherwise, they are at a loss. You can find "SOPR" in tradingview indicators
BTC SOPR Momentum: Onchain
This metric is based on SOPR Momentum. I made some changes to it so that its momentum can be checked.
Interpretation:
If the indicator is above the gray level of resistance/support, bitcoin has an uptrend and Bullish bias
If the indicator is below the resistance/ support level, bitcoin has a downtrend and Bearish Bias
Crossup the gray level is a long signal
Cross-down the gray level is a shorts signal
Entering and exit of the indicator to the overhigh area means creating a top
Entering and leaving the indicator to the overflow area means creating a bottom
Monthly Returns: Daily timeframeUse This indicator on the daily timeframe
The 30-day rolling returns can be used to gauge market strength and assess over/underheated price action.
Values between 0% and -30% are typical negative returns during consolidation periods of relatively low volatility.
Values below -50% often occur at cyclical bottoms, and may represent value buying areas.
Values over 50% represent de-risking zones and are often met with profit-taking.
Values over 70% are historically high and represent a high potential for a macro reversal.
This indicator is also used to detect local top and local battom
Coined By
Permabull Niño

Bitcoin Price Temperature: Weekly TimeframeUse this oscillator at weekly timeframes:
The Bitcoin Price Temperature (BPT) is an oscillator that models the number of standard deviations the price has moved away from the 4-yr moving average. This seeks to establish a mean reversion model based on the cyclical nature of Bitcoin halving and investment cycles. The BPT bands then establish price levels that coincide with specific standard deviation multiples to identify fair and extreme valuations.
Coined By:
DilutionProof
Interpretation:
Values above 6 indicate extremely high price areas: (TOP OF THE MARKET)
Areas below 0.2 indicate extremely low price areas: (BOTTOM OF THE MARKET)

MACD Volume S2 By Gammaprod>> How to use this indicator :
1. Set your teadingview theme to dark theme.
2. My indicator is valid for forex, stock and but more valid for crypto.
3. Use three timeframe for more validation (choose between those, that fit to your trading style) :
- Timeframe 1m, 5m, and 15m for Scalping
- Timeframe 30m, 1h and 4h for Intraday
- Timeframe 4h, 1D and 1W for Swing Trading
4 . Always use THREE INDICATORS FROM GAMMAPROD, those three indicators is back to back each other, by the way, I only made those three indicators only (for now) :
- Trendlines Boll Ichi Crypto by Gammaprod
- Stoch RSI Divs Zone Crypto by Gammaprod
- MACD Volume Crypto by Gammaprod
>> How to setting :
1. Trendlines Boll Ichi Crypto by Gammaprod
A. Support and Resistence
- Well if you familiar with this indicator you can add it, but recommended for Timeframe 30m or more
B. Trendlines Primary or Trendlines Secondary
- Timeframe 1m you DON'T NEED Trendlines Primary or Trendlines Secondary
- Timeframe 5m you DON'T NEED Trendlines Secondary, but you CAN ADD Trendlines Primary if you fell it helpful (for me, it is helpful to find where the candles start or the end trend or a consolidation or where the candles will surpass a resistance or a support).
- Timeframe 15m you DON'T NEED Trendlines Secondary, DEFENITELY add Trendlines Primary it will help to find where the candles stop or a consolidation or where the candles will surpass a resistance or a support).
- Timeframe 30m or more, DEFENITELY NEED BOTH Trendlines Primary and Secondary Trendlines, it will help to find where the candle stop or consolidation or where the candle will surpass a resistance or support).
C. Bolinger, Ichimoku Cloud and Lagging Span
- Please DON'T CHANGE IT at all, it's really helpful to know when and where to make an entry decesion or a trend or a consolidation, if you don't understand how to read it, you better to learn it first (on "how to read" section and "How to OPEN position" the section below)
2. Stoch RSI Divs Zone Crypto by Gammaprod (DON'T CHANGE IT)
3. MACD Volume Crypto by Gammaprod (DON'T CHANGE IT)
>> How to read :
1. Sell or Buy Priority :
A. Buy Priority
- Color background on macd and stoch rsi is pink or purple sell is the priority, (if you're not sure to buy, just wait until the best moment to sell)
B. Buy Priority
- Color background on macd and stoch rsi Teal or light green buy is the priority, (if you're not sure to sell, just wait until the best moment to buy)
C. Indecision / Golden Moment
- Color background on stoch rsi yellow is indecision / golden moment of reversal pattern (wait until it formed background only on Stoch RSI), please becareful at this moment.
2. Trend / Consolidation :
A. BULLISH trend
- When Stoch RSI and MACD have teal or light green background that's means BULLISH trend, better to confirm by the candle is above green cloud and lagging span (red line) is also above the candle.
B. BEARISH trend
- When Stoch RSI and MACD have the Pink or purple background that's means BEARISH trend, better to confirm by the candle is above purple cloud and lagging span (red line) is also below the candle.
C. CONSOLIDATION
- When Stoch RSI have the mix background that's means CONSOLIDATION, better to confirm by the candle is in or near to green / purple cloud and lagging span (red line) is also on the candle.
3. Special Mark
A. Ideal Bullish :
- Near line 20 and green / teal background = When Stoch RSI have the char R / H on lime color label, that's means divergence or hidden divergence for buy position, if you not see this label that's means just a standard confirmation for buy
B. Not an Ideal Bullish :
- Near line 80 and green / teal background = if this happens make sure you know what happen, it could be a false signal or bullish continual pattern
C. Ideal Bearish :
- Near line 80 and pink / purple background = When Stoch RSI have the char R / H on lime color label, that's means divergence or hidden divergence for buy position, if you not see this label that's means just a standard confirmation for sell position.
D. Not an Ideal Bearish:
- Near line 20 and pink / purple background = if this happens make sure you know what happen, it could be a false signal or bearish continual pattern
E. The Beginning of Reversal (from BEARISH to BULLISH) :
- When Stoch RSI line shaping GREEN position is near 20.
- MACD lines still PINK, position lines is UNDER the HISTOGRAM, but the HISTOGRAM start to SHAPE FALL PINK (light pink) and the BACKGROUND still PINK / PURPLE.
- Position CANDLES NEAR BLUE line, NEAR PURPLE CLOUD, and lagging span (red line) STILL ON the area candle. (it used to be confirmed with the golden moment).
F. The Beginning of Reversal (from BULLISH to BEARISH) :
- When Stoch RSI line shaping PINK position is near 80.
- MACD lines still GREEN, position lines is ABOVE the HISTOGRAM, but the HISTOGRAM start to SHAPE FALL GREEN (light green) and the BACKGROUND still TEAL / GREEN.
- Position CANDLES NEAR WHITE line, NEAR TEAL CLOUD, and lagging span (red line) STILL ON the area candle. (it used to be confirmed with the golden moment).
G. False Signals, or It could be a Golden Moment (better to see it on TF 15 or bigger):
- Near line 20 or 80 and yellow background = When Stoch RSI have the char R / H on color label, that's means divergence or hidden divergence for buy / sell position, if you not see this label that's means just a standard confirmation for buy / sell depends on where the Stoch RSI line if near 20 that's means buy, near 80 means sell
>> How to OPEN position:
A. Bullish
1. Trendlines Boll Ichi Crypto by Gammaprod
- The candles above the green cloud.
- Lagging span (red line) above the candles.
- then open buy near yellow line (the first option) / blue line (the second option) (always confirm the position with two other indicators below).
2. Stoch RSI Divs Zone Crypto by Gammaprod
- Teal or Green background.
- The lines is shaping green.
- Better if on the bottom (at a range 20).
3. MACD Volume Crypto by Gammaprod
- Teal or Green background.
- The lines is shaped or shaping green.
- Better if at the green histogram.
B. Bearish
1. Trendlines Boll Ichi Crypto by Gammaprod
- The candles below the purple cloud.
- Lagging span (red line) below the candles.
- then open buy near yellow line (the first option) / white line (the second option) (always confirm the position with two other indicators below).
2. Stoch RSI Divs Zone Crypto by Gammaprod
- Pink or purple background.
- The lines are shaping pink.
- Better if the line on the top (at a range 80).
3. MACD Volume Crypto by Gammaprod
- Pink or purple background.
- The lines are shaped or shaping green.
- Better if at the pink histogram.
C. Consolidation
1. Trendlines Boll Ichi Crypto by Gammaprod
- The candles on the cloud (green or purple).
- Lagging span (red line) on the candles.
- then open buy near the white or blue line (always confirm the position with two other indicators below).
2. Stoch RSI Divs Zone Crypto by Gammaprod
- Mix background specially on a timeframe 15m or more.
- The line move fast up and down.
- Better if on the bottom or the top of the lines (at a range 20 or 80).
3. MACD Volume Crypto by Gammaprod
- Changing the background.
- The line is near the middle line.
- Have small Histogram.
>> The secret ingridient is comparing the timeframe :
The example scalping (Timeframe 1m, 5m and 15m)
- TF 1m is for making an open position.
- TF 5m is for making a judgement of the trend market.
- TF 15m is to confirm that judgement from TF 5m, be careful if it not similar then it used to be a consolidation or the beginning of the reversal.
There's a lot a way to open the position than above information that i gave it to you, but consider there are a limit char on this column, I hope it will help your trading and make a more profit on it.

Stoch RSI, Div, Zone S3 by Gammaprod>> How to use this indicator :
1. Set your teadingview theme to dark theme.
2. My indicator is valid for forex, stock and but more valid for crypto.
3. Use three timeframe for more validation (choose between those, that fit to your trading style) :
- Timeframe 1m, 5m, and 15m for Scalping
- Timeframe 30m, 1h and 4h for Intraday
- Timeframe 4h, 1D and 1W for Swing Trading
4 . Always use THREE INDICATORS FROM GAMMAPROD, those three indicators is back to back each other, by the way, I only made those three indicators only (for now) :
- Trendlines Boll Ichi Crypto by Gammaprod
- Stoch RSI Divs Zone Crypto by Gammaprod
- MACD Volume Crypto by Gammaprod
>> How to setting :
1. Trendlines Boll Ichi Crypto by Gammaprod
A. Support and Resistence
- Well if you familiar with this indicator you can add it, but recommended for Timeframe 30m or more
B. Trendlines Primary or Trendlines Secondary
- Timeframe 1m you DON'T NEED Trendlines Primary or Trendlines Secondary
- Timeframe 5m you DON'T NEED Trendlines Secondary, but you CAN ADD Trendlines Primary if you fell it helpful (for me, it is helpful to find where the candles start or the end trend or a consolidation or where the candles will surpass a resistance or a support).
- Timeframe 15m you DON'T NEED Trendlines Secondary, DEFENITELY add Trendlines Primary it will help to find where the candles stop or a consolidation or where the candles will surpass a resistance or a support).
- Timeframe 30m or more, DEFENITELY NEED BOTH Trendlines Primary and Secondary Trendlines, it will help to find where the candle stop or consolidation or where the candle will surpass a resistance or support).
C. Bolinger, Ichimoku Cloud and Lagging Span
- Please DON'T CHANGE IT at all, it's really helpful to know when and where to make an entry decesion or a trend or a consolidation, if you don't understand how to read it, you better to learn it first (on "how to read" section and "How to OPEN position" the section below)
2. Stoch RSI Divs Zone Crypto by Gammaprod (DON'T CHANGE IT)
3. MACD Volume Crypto by Gammaprod (DON'T CHANGE IT)
>> How to read :
1. Sell or Buy Priority :
A. Buy Priority
- Color background on macd and stoch rsi is pink or purple sell is the priority, (if you're not sure to buy, just wait until the best moment to sell)
B. Buy Priority
- Color background on macd and stoch rsi Teal or light green buy is the priority, (if you're not sure to sell, just wait until the best moment to buy)
C. Indecision / Golden Moment
- Color background on stoch rsi yellow is indecision / golden moment of reversal pattern (wait until it formed background only on Stoch RSI), please becareful at this moment.
2. Trend / Consolidation :
A. BULLISH trend
- When Stoch RSI and MACD have teal or light green background that's means BULLISH trend, better to confirm by the candle is above green cloud and lagging span (red line) is also above the candle.
B. BEARISH trend
- When Stoch RSI and MACD have the Pink or purple background that's means BEARISH trend, better to confirm by the candle is above purple cloud and lagging span (red line) is also below the candle.
C. CONSOLIDATION
- When Stoch RSI have the mix background that's means CONSOLIDATION, better to confirm by the candle is in or near to green / purple cloud and lagging span (red line) is also on the candle.
3. Special Mark
A. Ideal Bullish :
- Near line 20 and green / teal background = When Stoch RSI have the char R / H on lime color label, that's means divergence or hidden divergence for buy position, if you not see this label that's means just a standard confirmation for buy
B. Not an Ideal Bullish :
- Near line 80 and green / teal background = if this happens make sure you know what happen, it could be a false signal or bullish continual pattern
C. Ideal Bearish :
- Near line 80 and pink / purple background = When Stoch RSI have the char R / H on lime color label, that's means divergence or hidden divergence for buy position, if you not see this label that's means just a standard confirmation for sell position.
D. Not an Ideal Bearish:
- Near line 20 and pink / purple background = if this happens make sure you know what happen, it could be a false signal or bearish continual pattern
E. The Beginning of Reversal (from BEARISH to BULLISH) :
- When Stoch RSI line shaping GREEN position is near 20.
- MACD lines still PINK, position lines is UNDER the HISTOGRAM, but the HISTOGRAM start to SHAPE FALL PINK (light pink) and the BACKGROUND still PINK / PURPLE.
- Position CANDLES NEAR BLUE line, NEAR PURPLE CLOUD, and lagging span (red line) STILL ON the area candle. (it used to be confirmed with the golden moment).
F. The Beginning of Reversal (from BULLISH to BEARISH) :
- When Stoch RSI line shaping PINK position is near 80.
- MACD lines still GREEN, position lines is ABOVE the HISTOGRAM, but the HISTOGRAM start to SHAPE FALL GREEN (light green) and the BACKGROUND still TEAL / GREEN.
- Position CANDLES NEAR WHITE line, NEAR TEAL CLOUD, and lagging span (red line) STILL ON the area candle. (it used to be confirmed with the golden moment).
G. False Signals, or It could be a Golden Moment (better to see it on TF 15 or bigger):
- Near line 20 or 80 and yellow background = When Stoch RSI have the char R / H on color label, that's means divergence or hidden divergence for buy / sell position, if you not see this label that's means just a standard confirmation for buy / sell depends on where the Stoch RSI line if near 20 that's means buy, near 80 means sell
>> How to OPEN position:
A. Bullish
1. Trendlines Boll Ichi Crypto by Gammaprod
- The candles above the green cloud.
- Lagging span (red line) above the candles.
- then open buy near yellow line (the first option) / blue line (the second option) (always confirm the position with two other indicators below).
2. Stoch RSI Divs Zone Crypto by Gammaprod
- Teal or Green background.
- The lines is shaping green.
- Better if on the bottom (at a range 20).
3. MACD Volume Crypto by Gammaprod
- Teal or Green background.
- The lines is shaped or shaping green.
- Better if at the green histogram.
B. Bearish
1. Trendlines Boll Ichi Crypto by Gammaprod
- The candles below the purple cloud.
- Lagging span (red line) below the candles.
- then open buy near yellow line (the first option) / white line (the second option) (always confirm the position with two other indicators below).
2. Stoch RSI Divs Zone Crypto by Gammaprod
- Pink or purple background.
- The lines are shaping pink.
- Better if the line on the top (at a range 80).
3. MACD Volume Crypto by Gammaprod
- Pink or purple background.
- The lines are shaped or shaping green.
- Better if at the pink histogram.
C. Consolidation
1. Trendlines Boll Ichi Crypto by Gammaprod
- The candles on the cloud (green or purple).
- Lagging span (red line) on the candles.
- then open buy near the white or blue line (always confirm the position with two other indicators below).
2. Stoch RSI Divs Zone Crypto by Gammaprod
- Mix background specially on a timeframe 15m or more.
- The line move fast up and down.
- Better if on the bottom or the top of the lines (at a range 20 or 80).
3. MACD Volume Crypto by Gammaprod
- Changing the background.
- The line is near the middle line.
- Have small Histogram.
>> The secret ingridient is comparing the timeframe :
The example scalping (Timeframe 1m, 5m and 15m)
- TF 1m is for making an open position.
- TF 5m is for making a judgement of the trend market.
- TF 15m is to confirm that judgement from TF 5m, be careful if it not similar then it used to be a consolidation or the beginning of the reversal.
There's a lot a way to open the position than above information that i gave it to you, but consider there are a limit char on this column, I hope it will help your trading and make a more profit on it.

V/T Ratio: Onchain BTC MetricThis is a New Onchain metric that is designed for bitcoin by myself Mjshahsavar (Ghoddusifar), and it is published for the first time in this trading view in this post.
I think this metric has a very high capability to determine the ATH and bottom of the market. This metric can solve a problem that channels are unable to solve. this could be the equivalent of what is known in the stock market as P/E
Calculations:
V/T RATIO = MA (7) of Log ((THE TOTAL VOLUME OF BITCOIN TRANSFERRED ONCHAIN IN USD)/(THE TOTAL AMOUNT OF TRANSACTIONS))
INTERPRETATION:
What is the long-term price channel of Bitcoin? Have you ever thought that maybe drawing a price channel is not right and maybe we should look for something else?
Channel drawing for the price is a subjective and interpretive subject. Look at the charts below, they are all correct in terms of drawing, but no one can say which one will happen. There is no certainty because drawing them is objective.
But who can say which one will definitely work?
We need something more objective. I think V/T Ratio does that.
Just draw the channel. There is only one channel for it. And it has worked historically well to this day.
Compare the drawn channel with the price chart. It works right. When the metric reaches the top line of the channel, it indicates the new ATH and the end of the cycle.
When it reaches the bottom line of the channel, it indicates that the price has reached the bottom.
A Market Cycle:
According to this metric, the bitcoin cycle has 5 stages:
1- Bottom Price: which V/T Ratio touches the bottom line of the channel: In this case, we expect the price to reach the bottom.
2- Semi-high price: that the metric reaches the middle line of the channel: In this case, Bitcoin creates a local top in the MID-Term and Long-Term timeframes
3- Semi-low price: which has a metric return to the lower part of the channel (but the price can still increase)
4- ATH: that Bitcoin reaches its highest historical price
5- It starts after the ATH until the metric reaches the bottom part of the channel again.

NVT Ratio: OnchainNVT Ratio
Defined as the ratio of market capitalization divided by transacted volume (in USD).
Network Value to Transactions Ratio (NVT Ratio) is defined as the ratio of market capitalization divided by transacted volume in the specified window.
History
NVT first made an appearance as a tweet on Woo Bull account in Feb 2017. In that tweet he promised an explanatory article which came much later in Oct 2017, first debuting on Forbes.
In Feb 2018, Dimitry Kalichkin published his work to improve NVT for use as a more responsive indicator, hence Kalichkin NVT Signal. In the same month, Woo Bull applied some trader techniques to NVT Signal and published an article summarising how to use it within a trading environment.
Interpretation:
NVT Ratio (Network Value to Transactions Ratio) is similar to the PE Ratio used in equity markets.
this indicator measures whether the blockchain network is overvalued or not.
When Bitcoin`s NVT is high, it indicates that its network valuation is outstripping the value being transmitted on its payment network, this can happen when the network is in high growth and investors are valuing it as a high return investment, or alternatively when the price is in an unsustainable bubble.
High: Overvalued Network worth - Bearish
Marketcap is too much valued compared to the low ability to transact coins in terms of volume
Low : Undervalued Network worth - Bullish
Marketcap is undervalued compared to the high ability to transact coins in terms of volume

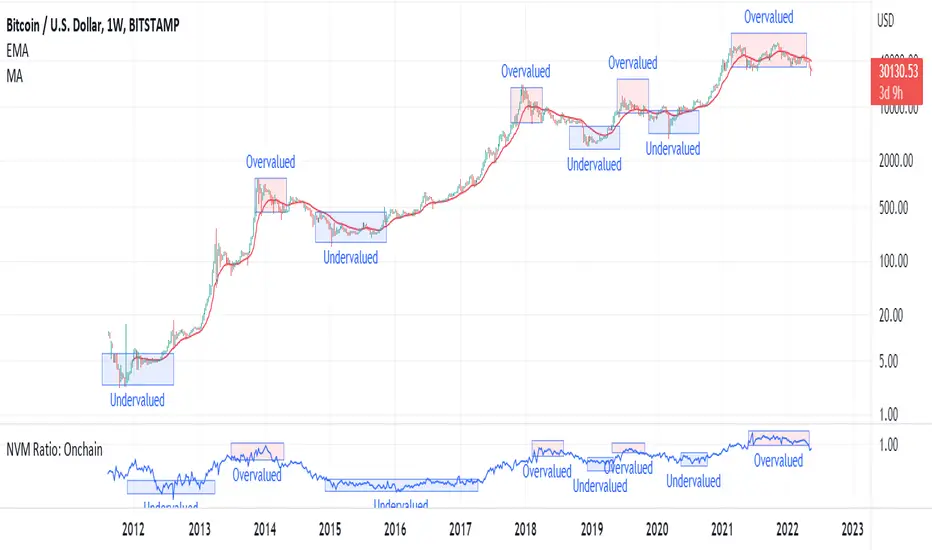
NVM Ratio: OnchainNetwork Value to Metcalfe Ratio (NVM Ratio) is defined as the ratio of the log of market capitalization divided by the log of the square of daily active addresses.
This oscillator evaluates bitcoin price according to the Metcalfe Ratio to show whether the current value of Bitcoin is higher or lower than the real price
in this oscillator, High values indicate the overvalued price, and low values indicate undervalued price.
Oversold RSI with tight SL Strategy (by Coinrule)This is one of the best strategies that can be used to get familiar with technical indicators and start to include them in your trading bot rules.
ENTRY
1. This trading system uses the RSI ( Relative Strength Index ) to anticipate good points to enter positions. RSI is a technical indicator frequently used in trading. It works by measuring the speed and change of price movements to determine whether a coin is oversold (indicating a good entry point) or overbought (indicating a point of exit/entry for a short position). The RSI oscillates between 0 and 100 and is traditionally considered overbought when over 70 and oversold when below 30.
2. To pick the right moment to buy, the strategy enters a trade when the RSI falls below 30 indicating the coin is oversold and primed for a trend reversal.
EXIT
The strategy then exits the position when the price appreciates 7% from the point of entry. The position also maintains a tight stop-loss and closes the position if the price depreciates 1% from the entry price. The idea behind this is to cut your losing trades fast and let your winners ride.
The best time frame for this strategy based on our backtesting data is the daily. Shorter time frames can also work well on certain coins, however in our experience, the daily works best. Feel free to experiment with this script and test it on a variety of your coins! With our backtesting data a trading fee of 0.1% is taken into account. The fee is aligned to the base fee applied on Binance, which is the largest cryptocurrency exchange by volume. In the example shown, this strategy made a handsome net profit of 39.31% on Chainlink with 61.54% of trades being profitable.

BTC Active1Y holders: OnchainUse this Indicator in The Weekly timeframe
This indicator is based on "Percent of Supply Last Active 1+ Years Ago".
This is so important indicator that shows " The percent of circulating supply that has not moved in at least 1 year."
It can show the situation of the holders who have been holding their coins for more than a year. When this indicator starts to decline, it means that the price has risen so much that the holders are selling their coins. When this indicator starts to increase, it means that the number of coins held has been increasing for more than a year. This is because the price is too low for investors.
This indicator can be used to indicate accumulation and distribution areas. When the indicator enters the overlow area (red) it means that the distribution is happening
When the indicator enters the overhigh range (blue), it means that accumulation is taking place by the holders

Scalping The Bull IndicatorName: Scalping The Bull Indicator
Category: Scalping, Trend Following, Mean Reversion.
Timeframe: 1M, 5M, 30M, 1D depending on the specific technique.
Technical Analysis: The indicator supports the operations of the trader named "Scalping The Bull" which uses price action and exponential moving averages.
Suggested usage: Altcoin showing strong trends for scalping and intra-day trades. Trigger points are used as entry and exit points and to be used to understand when a signal has more power.
It is possible to identify the following conformations:
Shimano: look at the price records of a consecutive series of closings between the EMA 60 and the EMA 223 when a certain threshold is reached. Use the trigger points as price structures to identify entry and exit zones (e.g. breakout of the yesterday high as for entry point) .
Bomb: look at the price registers a percentage variation in a single candle, greater than a threshold such as 2%, in particular on shorter timeframes and around the trigger points.
Viagra: look at there is a consecutive series of closes below the EMA 10.
Downward fake: look when, after a cross under (Death Cross), the price returns above the EMA 223 using the yesterday high as a trigger point.
Emergence: look at the EMA 60 is about to cross over the EMA 223.
Anti-crossing: look at, after an important price rise and a subsequent retracement, the EMA 60 is about to cross under the EMA 223 but a bullish impulse brings the price back above the EMAs.
For Sales: look at two types of situations: 1) when the price falls by more than 10% from the opening price and around the yesterday’s low or 2) when the price falls and then reaches, in the last 5 days, a bigger percentage and then breaks a trigger point.
Colour change: look at the opening price of the session - indicated as a trigger point.
Third touch of EMA 60: look for 3 touches below the EMA 60, and enter when there is a close above the EMA 60.
Third touch of EMA 223: look for 3 touches when there are 3 touches below the EMA 223, and enter when there is a close above the EMA 60.
Bud: look at price when it crosses upwards the average 10 and subsequently at least 2 "rest" candles are between the maximum and minimum of the breaking candle.
Fake on EMA 10: look for the open of a candle higher than the EMA 10, the minimum of the candle lower and the closing price returns above the EMA 10..
For Stop Loss and Profit Targets consider a proper R/R depending on Risk Management, using price structures such as the low of the entering candle and a quick Position Management moving quickly the Stop-Loss at Break-Even.
Configuration:
Market
EMA: The indicator automatically configure itself on market it knows (Binance, Piazza Affari and NASDAQ) otherwise it can be configured manually fo Crypto market (5/10/60/223) or Stock Market (5/10/50/200).
Additional Average: You can display an additional average, e.g. 20-period average.
Chart elements:
Session Separators: indicates the beginning of the current session (in blue)
Background: signals with the background in green an uptrend situation ( 60 > 223) and in red background a downtrend situation (60 < 223).
Trigger points:
Today's highs and lows: draw on the chart the opening price of the daily candle and the highs and lows of the day (high in purple, low in red and open in green)
Yesterday's highs and lows: draw on the chart the opening price of the daily candle, the highs and lows of the previous day (high in yellow, low in red).
Credits
Massimo : for refactoring and suggestions.

Scalping The BullNome: Scalping The Bull (Indicatore)
Categoria: Scalping, Trend Following, Mean Reversion.
Timeframe: 1M, 5M, 30M, 1D, secondo la conformazione specifica.
(follow description in english)
Analisi tecnica: l’indicatore supporta le operatività descritte nei video di YouTube del canale “Scalping The Bull”. Di norma si basa su price action e medie mobili esponenziali.
Le varie tecniche che possono essere usate insieme all’indicatore sono sintetizzate nei settaggi dell’indicatore e si può fare riferimento ai video specifici per la spiegazione completa.
Utilizzo consigliato: Altcoin che presentano forti trend per scalping e operazioni intra-day.
Configurazione: È possibile configurare lo strumento in maniera semplice e completa.
Medie:
Medie per mercato: e’ possibile utilizzare le medie mobili esponenziali (EMA) esclusivamente per il mercato Crypto (5/10/60/223).
Media addizionale: e’ possibile visualizzare una media aggiuntiva, e.g. a 20 periodi.
Elementi del grafico:
Sfondo: segnala con lo sfondo del grafico in verde una situazione di uptrend ( EMA 60 > EMA 223) e in rosso sfondo rosso una situazione di downtrend (EMA 60 < EMA 223).
Separatori di sessioni: indica l’inizio della sessione corrente.
Punti Trigger:
Massimi e minimi di oggi: disegna sul grafico il prezzo di apertura della candela daily e i massimi e i minimi di giornata.
Massimi minimi di ieri: disegna sul grafico il prezzo di apertura della candela daily, i massimi e i minimi del giorno prima.
(English description)
Name: Scalping The Bull (Indicator)
Category: Scalping, Trend Following, Mean Reversion.
Timeframe: 1M, 5M, 30M, 1D depending on the specific signal.
Technical Analysis: The indicator supports the operations described in the YouTube videos of the channel "Scalping The Bull". Usually it is based on price action and exponential moving averages.
The various techniques that can be used in conjunction with the indicator are summarized in the indicator settings and you can refer to the specific videos for the full explanation.
Suggested usage: Altcoin showing strong trends for scalping and intra-day trades.
Configuration:
Exponential Moving Averages
Per market: you can display averages exclusively for the Crypto market (5/10/60/223).
Additional Average: You can display an additional average, e.g. 20-period average.
Chart elements:
Session Separators: indicates the beginning of the current session.
Background: signals with the background in green an uptrend situation ( 60 > 223) and in red background a downtrend situation (60 < 223).
Trigger points:
Today's highs and lows: draw on the chart the opening price of the daily candle and the highs and lows of the day.
Yesterday's highs and lows: draw on the chart the opening price of the daily candle, the highs and lows of the previous day.

Open InterestSimple indicator that shows the open interest of whatever crypto contract you're looking at in candlestick form.
If it doesn't show anything then Tradingview doesn't have the open interest data for that contract.
At the time of publishing there's data for Binance, Bitmex and Kraken.
You can change the colors in the settings.

BTC HASHRATE DROP: OnchainWhy is the drop of hashrate important?
Drop of hashrate usually occurs because some miners in the mining network stop for working. There are several possible reasons for this. Such as new anti-mining regulations in some countries or a sharp drop in the price of bitcoin, which makes mining no longer affordable for some miners. So they turn off their devices
This reduces the supply of bitcoin in the market and according to the law of supply and demand can eventually lead to an increase in the price of bitcoin.
This oscillator is designed to detect hashrate drop. for this, we use the data of glassnode . Maroon color indicates decrease in hashrate and Red color indicates excessive hash rate drop. As can be seen on the chart, usually after this drop, we see an increase in the price of bitcoin

BTC NVM Ratio - Onchain AnalysisIt is an onchain oscillator and is designed to operate at weekly timeframes and is only for Bitcoin.
Network Value to Metcalfe Ratio (NVM Ratio) is defined as the ratio of the log of market capitalization divided by the log of the square of daily active addresses in the specified window.
This oscillator evaluates bitcoin price according to the Metcalfe Ratio to shows whether the current value of Bitcoin is higher or lower than the real price
I made this comparison using a moving average of 100. The areas that are red in the weekly timeframe indicate that bitcoin is Overvalued. and The areas that are blue in the weekly timeframe indicate that bitcoin is undervalued.

CryptoMettle - Crypto Market Support BandAs the name suggests, the Crypto Market Support Band has historically acted as a support band in bull runs. It refers to the band between the 20W Simple Moving Average (SMA) and 21W Exponential Moving Average (EMA).
