Crypto Tipster v2---------------------
Crypto Tipster v2
Hello again! We're back with a drastically improved Crypto Tipster v2 Indicator using over a dozen all new algorithms based around Technical Analysis, Price Action, Momentum Swings and Reversal Detection.
We've taken our time with version 2 of Crypto Tipster, putting all our best practices to work and ensuring it performs superbly across numerous crypto markets and timeframes - we have focused our efforts towards the larger timeframes, 12H, 1D, 2D for example as we believe these to be the most consistent and predictable, and therefore the most profitable.
Trading on longer timeframes also reduces the overal cost of trading fee's as you'll be placing fewer trades over any given time period, whilst catching bigger swings and therefore earning a higher percentage per winning trade. Due to these bigger price swings you can de-leverage your trades too, making them inherintly safer and more controlled.
The final benefit to placing trades on longer timeframes is that you will not be tied down to your PC or laptop for hours on end waiting for a perfect entry or exit point, which increases the odds of placing bad/panic trades or even placing trades due to boredom! If you trade with Crypto Tipster v2 on a 1D timeframe, you will only ever have work to do once per day, at bar close; this is when trades are placed or exited, or stop losses/take profits are updated to new levels - easy!
Crypto Tipster v2 can help consistently catch tops and bottoms of trending markets whilst avoiding placing trades through choppy or ranging areas, this helps to not only maximise profits (what we're all after!) but also to minimise losses (equally important). We've tirelessly tested Crypto Tipster using literally thousands of variables across dozens of built-in algorithms over hundreds of trading pairs - lots of data to process!
The outcome is rather stunning and well worth checking out - we're rather proud of what we've achieved here, and we're pretty sure you're going to love it too!
---------------------
What's Included
- Chart Settings
The first section you'll come across, Chart Settings.
Here you'll find a few options regarding how your chosen market chart will look within TradingView and how Crypto Tipster will interact with this chart.
One of the most important Tick boxes is first on the list - "Show Backtest Results". This will change Crypto Tipster from displaying simple but easy-to-follow "Buy/Sell" labels into Strategy mode in which you can set up more complicated Stop Loss / Take profit settings as well as setting up Alerts for auto trading and other more complex functions (see How It Works for more info!
We've also included a "Trend Strength Bar Color" tick box which changes the color of the chart bars based on how strong Crypto Tipster is perceiving the current trend and in which direction.
- Trend Settings
"Trading Frequency" represents how often Crypto Tipster will be looking for a new trend / change in trend direction, and therefore how often it will be placing trades. By default this is set to "Normal" but can be changed to "Rapid" using the drop down menu.
"Entry Trend Strength" also determines how frequently trades are placed by selecting the strength of trend required before a trade is placed. The scale ranges from "1-5", with 1 being a low trend strength required, 5 being a very strong trend strength required.
Within the Trend Settings section you'll also find an "Avg Trend Strength over Bars" option. This allows you to average (mean) the current trend strength over a pre-determined amount (1-5) of previous chart bars - thus providing a potentially more consistent signal.
- Trade Settings
Trade Settings help Crypto Tipster determine what type of trades you're looking to place.
The overall "Trade Direction" will decide to either target only Long trades, only Short trades, or Both (default).
"Consecutive Trades in Same Direction" allows for pyramiding - whereby you can specify to allow for multiple trades of the same direction. Set to "1" as default allows for no extra pyramiding, max setting of "10".
- Trade Protection
Currently consisting of two functions, our Trade Protection section can help to achieve both the removal of false signals (whipsaws), and the extension of good trades without confusion during minor retracements.
"Chop Removal" can help to remove some whipsaw trades during ranging market conditions, therefore improving overal profitability by only targeting stronger trends. You have an option to choose from either "Weak" or "Strong" Chop Removal.
"Protection Filter" uses current trading criteria as defined by you, and uses it to check against a higher time frame than you're currently viewing. This can help to eliminate some bad trades at the expense of a potential lag on good trades.
- Stop Loss / Take Profit
Stop Losses should be a crucial aspect of everyone's trading system. They help prevent any trade from going too far in the wrong direction and limit losses.
Our "Stop Loss (%)" is quick and easy to set up, simply set the percentage offset from the entry price of trades and a fixed Stop Loss will be in place on all trades.
"Take Profit (%)" works in the same way as the Stop Loss mentioned above - simply set the percentage you'd like to exit a profitable trade at.
The "Trailing Stop (%)" is a little more complicated in that it will follow the trend of the trade a certain percentage away from the current market price - this is great for keeping yourself in a trade for as long as the trade is moving in the right direction.
- Extra Tools & Indicators
This is the section of Crypto Tipster that enables you to add some chart visuals to assist you with your preferred trading style.
"Potential Pivot Points" are not the same as actual pivot points - Potential pivot points will paint on the chart at bar close, giving you an immediate alert to potential tops/bottoms of market trends. You can choose to display only the strongest potential points, or include some of the weaker signals too.
"Actual Pivot Points" are inherintly more accurate than Potential pivot points, but do not paint on the chart until after a pre-determined amount of time has passed. These are great for placing stop losses/take profits or watching the market for breakouts or reversals.
"Support/Resistance Levels" plots up to 6 support and resistance horizontal lines based on recent price tops/bottoms. Use these to determine areas where price could rebound or break-through.
"Bollinger Band Breakout" - Bollinger bands are a tried and tested technical analysis tool, similar to pivot points and support/resistance lines, thee are another great tool to determine where price may retrace, consolidate or breakout.
- Ichimoku Cloud
Somewhat confusing and intimidating when you first come across this technical analysis indicator, the "Ichimoku Cloud" is one of our favorites. Assisting with the detection of Dynamic Support and Resistance levels, Momentum and Trend Direction all in one super indicator.
Although certain aspects of the Ichimoku Cloud are already present within Crypto Tipster v2 algorithms in order to offer you the best possible signals, we've also included a user-definable section of it's own so you can manually set up and use the cloud for your own trading needs, all cloud signals (and there are many) are available to set up as Alerts for your own needs or an Auto-Trading Bot.
- Custom Alerts for Any Signal
We've endeavoured to ensure that all signals, not just the Buy/Sell signals, are ready and available to create Alerts with; giving you the most opportunity to create a fully custom trading engine that suits your exact trading requirements.
This means you can set Alerts for any and all signals you can see on the chart when using Crypto Tipster v2, this includes Buy/Sell Signals, Trend Strength Signals, Choppy Market Signals, Stop Loss/Take Profit Signals, Pivot Points, S/R levels crossed above & below, Bollinger Band Breakout and several Ichimoku Cloud Signals.. the list goes on!
---------------------
We've tried to make Crypto Tipster as comprehensive and easy to understand as possible, we are however always in search of progression; we do really love to hear your feedback :)
For more information and a free 8-day trial please visit the link in our signature
Happy Trading Guys
Cari dalam skrip untuk "crypto"

Crypto Market Breadth [QuantVue]15 top crypto tickers of your choosing. Just input your 15 favorite crypto markets in the settings.
Showing breadth of market as a percentage change to gauge buyers/sellers strength.
You can check this on the last day of the week and compare each daily bar to see if buyers are increasing/decreasing or sellers increasing/decreasing bars.
A reading above +2 is bullish , below -2 is bearish momentum, between +2 and -2 neutral.
Works best on daily charts .
Hope you enjoy!
*this will also work with stock tickers!

Crypto-DX Crypto Directional Index [chhslai]Crypto-DX can be used to help measure the overall strength and direction of the crypto market trend.
Furthermore, it can be used as a screener to find out cryptocurrencies which are accumulating momentum and tends to potentially pump or dump.
How this indicator works :
If the Crypto-DX cross above the zero-level, it could be an indication that there is a trend reversal into upward. You should close your short position or place a long order right away.
If the Crypto-DX cross below the zero-level, it could be an indication that there is a trend reversal into downward. You should close your long position or place a short order right away.
If the Crypto-DX is consolidated around the zero-level, it could be an indication that the trend may be ended and followed by a sideway market. You are suggested not to place any order and wait for the market moves.
Divergence based trading strategy is fully applicable, just like the MACD.
Screener features :
Plot "Crypto Index" and "5 Custom Crypto"
Plot "Crypto Index" and "Top 30 Crypto"

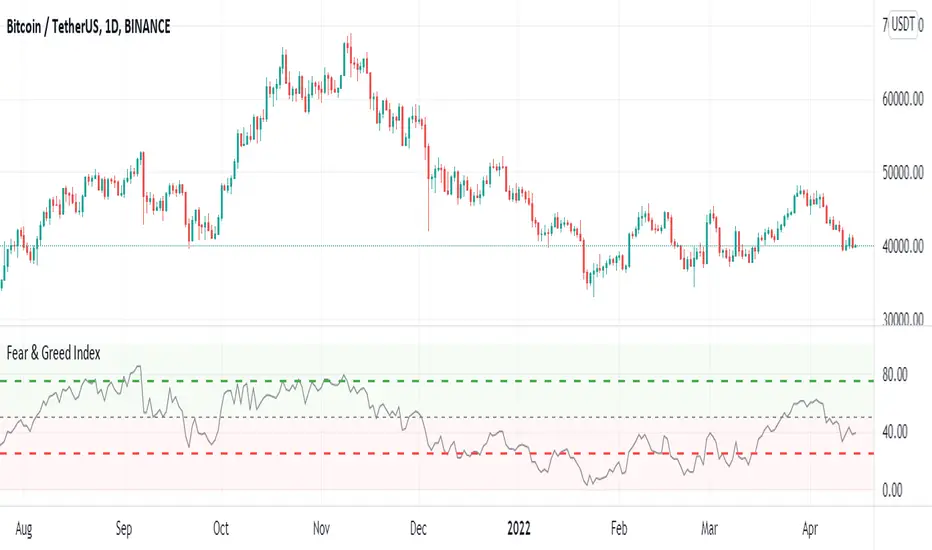
Crypto Fear & Greed IndexCrypto Fear & Greed Index
Crypto Fear & Greed Index is a metric to gauge sentiment levels in the crypto market.
The index starts from 0 to 100, with 0 meaning “Extreme Fear” (a potential bottom signal as investors are overly worried), and 100 meaning “Extreme Greed” (a potential top signal as investors are overly bullish).
Why Measure Fear and Greed?
In most markets, participants tend to be emotional with their behavior. Market participants often get overly greedy and FOMO when prices are on a euphoric rise, whilst they also tend to be overly fearful when prices are down and irrationally selling their positions at a loss.
Using the Crypto Fear and Greed Index
The Crypto Fear and Greed Index is commonly used to time entry into the market. As such, the Index is seen as less of an investment research tool and more of a market-timing tool. As stated by Warren Buffet, “Be fearful when others are greedy, and greedy when others are fearful.”
Calculation of the Crypto Fear and Greed Index
The Crypto Fear and Greed Index is based on three different factors – each factor is gauged from 0 to 100 and equally weighted to generate the index value.
The three factors are:
1. Stable coin flows
If there is a market sell-off and investors are expecting the value of their crypto investment to decline, they may rotate into stable coins as a safe haven.
As such, we look at the general trend of stable coins volume and activity to measure if the market is greedy or fearful.
2. Market Momentum
The performance of the top 18 coins relative to its 30-day average. A greater relative performance indicates greed and vice versa.
3. Top 18 Coins Price Strength
The number of coins of the top 18 coins hitting 90-days highs relative to those hitting 90-days lows. A greater number of coins hitting 90-days highs versus 90-days lows indicates greed and vice versa.
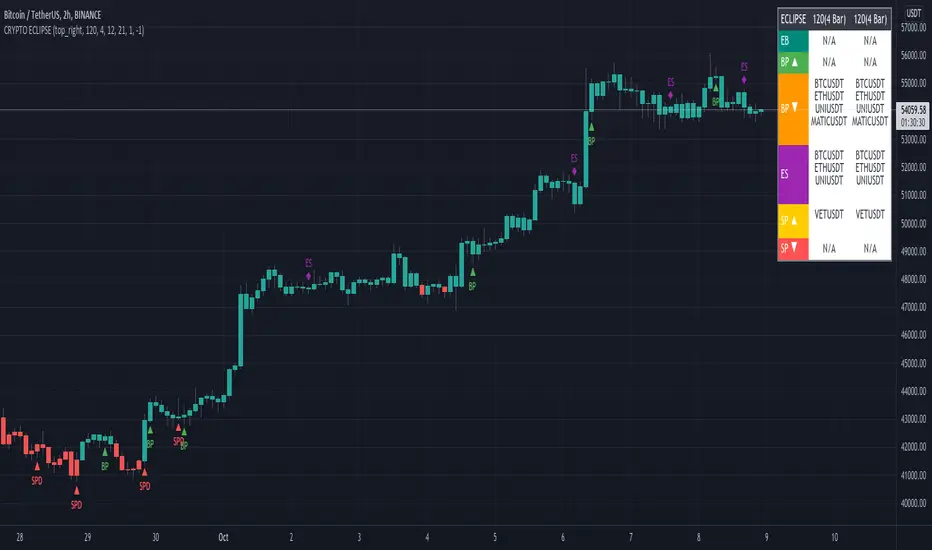
CRYPTO ECLIPSEWelcome to CRYPTO ECLIPSE!
If you see the market as a game between buyers and sellers, CRYPTO ECLIPSE is the EASY MODE.
Don't believe in any word I wrote, but please don't doubt about it until you TEST IT. Just go ahead and take your own conclusions, maybe this script changes your life, like it changed mine.
What would be like if you could see the markets through the eyes of a trader with many years of experience? (and If you are already this trader, you could add this as a live second opnion)
Imagine if you could consistently predcit buyers and sellers actions, attempts and rejections. That's what Price action technical analysis tries, but price action often feels like very subjective and to succeed and learn it, you will probably need at least 4 years of trading, winning and loosing to find consistancy, that's the process. CRYPTO ECLIPSE will show how you will see the market after this years spent, You''ll be skipping this years.
CRYPTO ECLIPSE is a setup that translates the market to you and give you the view of the market as it is, and not only how it was in the past. Differently from almost all other indicators i've seen in my life, CRYPTO ECLIPSE is a setup focused in PREDICT, not REACT. In my opnion that's why indicators not work well, they are too focused in the past, giving late decisions.
Truth be told, it's sounds good, but how do I use it?
I will explain you the main features, what you need to do is: Take some time to learn it, mess with the configs. Until you see the chart as you believe is the best predict scenario for the past, and then just sit and see how it will keep predicting the next moviments. Well, it works for me :)
Why am I renting this setup?
I am not. This is made for you to test for free, and for those who this setup makes all sense, we will build a small comunity around it. Just watch as we go, or Join us.
Before I forget, the setup is also a screener to track the 6 conditions above in the last 1-5 periods.
Main Features description:
BAR COLOR 2 = Strong Buyers domain(Candle's color)
BAR COLOR 3 = Strong Sellers domain(Candle's color)
BAR COLOR 0 e 1 = Fine Tuning(Advanced) There are 3 main ways to use it:
-Standard, following the same 2 and 3 bar colors.
-Changing both 0 and 1 bar colors. You can use Orange or pink or white colors for both 0 and 1, or other any color, try to use one that does not match with green or red for distinction. Consider the 0 and 1 bars as trend changing in course, or the breath of the market before a trend continuation (pullback).
Another option, that's indicated for Professionals only: change bar zero to dark green and 1 to a lighter red. This way you will see the gain and loose game in real time, take some time and you will see dark red going to lighter red will indicate a seller's weakness and the oposite for the buyers. If you are already a PRO, go ahead and play with these 2 options.
BP= STRONG BUYERS DOMAN
BPD= STRONG BUYERS DOMAN DECREASING
SP= STRONG SELLERS DOMAN
SPD= STRONG SELLERS DOMAN DECREASING
EB= POSSIBLE EARLY BUYERS DOMAIN SIGNAL
ES= POSSIBLE EARLY SELLERS DOMAIN SIGNAL
Note that BPD AND SPD are the same as EB and ES, I made this as a double entries so we can combine two different periods. If you look close you'll learn that the periods are related to the range of past periods you want to consider.
IF you pick a low period, it will show more signals, and it willl be more sensitive to the market changes. All the signals are real things that happened there, you will see that there was always a pullback or a consolidation, since this is very sensitive it's better to traders who want what's happening all the time
If you pick a high period, it will show less signals and with significant and strong movement, there are no guesses in this signals, if it did not proceed with a strong moviment, the opposite forces rejected their attempt.
Fit to your market point of view: Mess with the period numbers until you see the signals(arrows) where you understand is the best place to take a trade in the past, and watch it repeat the alert for you in the future, same as bar colors.
Note: If you want to enter only with big movements signals, use Stronger signals and high periods. if you want to try to get the movement begin, go with the early signals, using short periods.
Play with the configs until the chart give you the confidence you want to have to trade your money.
I don't recomend to use it with many indicators, if you add more than one indicator with this, you are probably insecure, and this will be useless to you.
But go ahead and add a trend indicator, if you are a trend trader or a oscillator, if you are a oscillator guy... Whatever you need until you feel confident.
Alway remember, this is only a tool. it's your decision, this is not a buy/sell indicator (maybe in the future), this is a tool to read the market. Always trade SPOT never FUTURES, always keep your stop loss as close as you can.
Enjoy the ECLIPSE
Crypto Relative PerformanceThis script plots the difference between the percentage change of the current symbol and the total crypto market change percentage.
If green, the symbol performs better than total crypto; if red, the symbol performs worse than total crypto.

Crypto swing correlation RSI and SMAThis is a crypto swing strategy, designed for long term periods and correlated pairs with crypto market total(or other coins used as correlation, however I recommend total of crypto or btc)
Its components are:
RSI with a very length
Correlation candles
SMA 9
Rules for entry:
For long : RSI is above 51 level and going higher and close of the candle is above the SMA
For short :RSI is below 49 and going lower and close of the candle is below the SMA
Rules for exit:
We exit when we encountered an opposite condition than the entry one, or based on take profit/stop loss levels.
If you have any questions let me know !

Crypto Scalper Divergence Macd Psar Ema 200This is a very efficient crypto scalper adapted to very short timeframes, however it can be optimized for other timeframes and assests as well.
Its components are
MACD
P SAR
EMA 200
Risk management
Rules for entry:
For short : we have an uptrend on PSAR , histogram is positive (divergence MACD) and close of a candle is below EMA 200
For long : we dont have an uptrend on PSAR, histogram is negative(divergence MACD) and close of a candle is above EMA 200
Rules for exit:
We exit when we either find a reverse condition than the entry one, or based on stop loss/take profit that are calculated on % movements of the price.
If you have any questions, let me know !

Crypto RSI with RVI StrategyThis is a long only strategy adapted for crypto market.
Its idea is to take the most juice out of a long trend and cut the losses as soon as possible.
For this , its components are RSI with a very big length - 100 or 200 preferably and RVI.
Rules for entry
If RVI is in the buy zone and we have a crossover from RSI with the overbought level.
Rules for exit
With change condition : If RVI is in the sell zone and we have a cross under from RSI with the oversold level.
With stop loss : we have a SL based on movement in % of the price, recommendable between 5-10%.
If you have any questions let me know !

Crypto Scanner [MensaTrader]Market Scanner
By default set up to scan 7 Crypto Currencies on 3 different Time frames
Default assets are from Binance listing, but can be changed in settings.
First timeframe is set to Daily, (all timeframes can be changed in the settings), The RSI value for the Daily resolution is printed. The current conditions need it to be between the value of 40 and 50, If this condition is met then the box will light are green, if they are not they will stay red.
Second timeframe is set to 4 Hour, RSI for this timeframe and assset will also be printed here, the conditions for it are different though. Currently set up so if the RSI value is lower than 40 the box will light up green. This 40 value can be changed in the settings aswell.
Third timeframe is set to 1 Hour, This timeframe is looking for divergences. If a Divergence is found, the box will light up green and say "Bullish Divergence", This will stay green until either of the 2 invalidation conditions are met.
One condition is (For Bullish Divergence) to be cleared, If the recent Low where the divergence was formed gets taken out. Then the divergence sign will dissappear
Second condition is if the RSI Value climbs above 55, Then once again the Divergence sign will dissappear.
Use this to help scan multiple assets at once and find RSI values which suit your trading set ups.
I have tried to make as many options adjustable as possible including the Size of the Scanner, all in the settings.

Cryptocurrency Super-Cycle IndicatorThe Cryptocurrency Super-Cycle Indicator employs a custom volume-weighted algorithm to confirm the overall, long-term trend. This works well on the 4H timeframe, but can be used on any timeframe. The indicator also plots a modified Network Value to Transactions (NVT) Ratio to identify overbought and oversold areas where price could soon reverse.

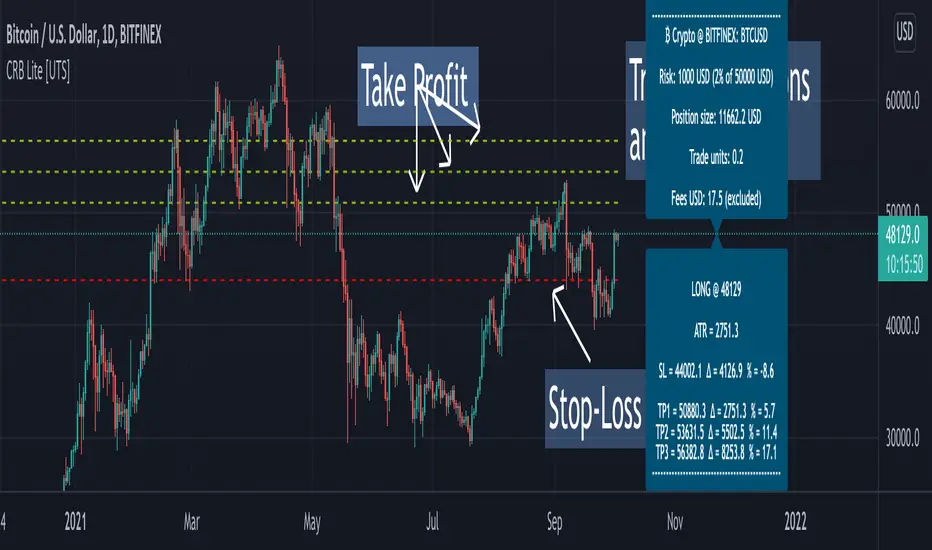
Crypto Risk Buddy - Lite: Position Size, SL & TP System [UTS]
Crypto Risk Buddy - Lite
Position Size, Stop Loss & Take Profit System
The ultimate system to calculate trading risk on crypto assets.
The 'Lite' version is limited to BTC as base currency.
₿ Cyptocurrencies
Position Sizing
De-risk possible drawdown by calculating a proper position size.
Define your risk percent based on your net value
Freely define your account currency
Trade any asset by the customizable Base / Quote currency factor
Calculate trading fees
Show all information on a customizable data screen
Stop Loss
Minimize trade risk by calculating your stop-loss.
Percent, Value and Delta display from current price
ATR based (Average True Range, modifiable)
Custom SL value possible
Adjustable
Two visual representations on chart
Automatically and real-time calculated on screen
Take Profit
Multiple take-profit levels to ensure not giving back to the market.
Up to 3 take profit levels to define
ATR based (Average True Range, modifiable)
Custom TP values possible
Easily customizable
Two visual representations on chart
Automatically and real-time calculated on screen
Currencies
Choose an account currency and calculate your risk for every trading pair.
USD
EUR
GBP
AUD
CAD
CHF
HKD
JPY
NOK
NZD
RUB
SEK
SGD
TRY
ZAR
BTC (crypto)
ETH (crypto)
USDT (crypto)
BUSD (crypto)
USDC (crypto)
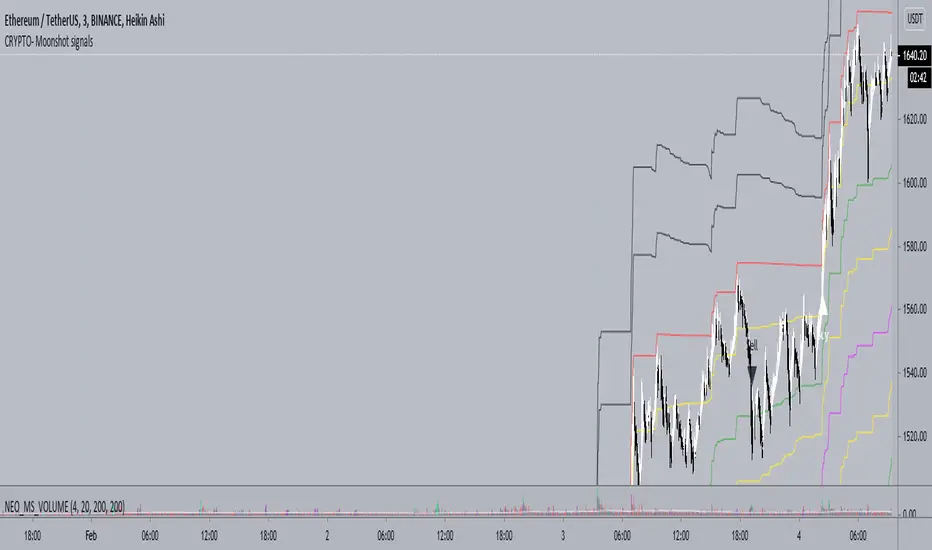
Neo_BTC - CRYPTO - Moonshot signalsCRYPTO - Moonshot signals indicator is designed to work well in trending markets and scalping using the levels in sideways market
FAQs
1. What is the optimal TF (Time Frame) for the indicator?
A. 3 min HA (Heikin Ashi) Candles
2. Will it work on other TFs?
A. Yes, 1min works well as well but less profitable. 1min TF is recommended during High volatility .
3. What does the levels do?
A. There are two levels Buy (B) and (S) Sell which is separated by mid level M.
Above mid level is bullish and below bearish .
As you get the Long or short signal, partially reduce your position at each levels to reduce risk and maximise profits.
4. How to scalp trade on the levels?
A. Depending on the trend you can short or long between the levels
5. How often the signals fire?
A. Only few in a week. But the levels are optimized for swing trades and works well. You are welcome to setup a grid bot to trade between the levels
6. I can only see Sell Labels - no Buy labels?
A. Sell labels are Black and Buy labels are White in colour. So if your TV background is white or black, the labels may not appear. You can change color in the indicator settings.
7. Will it work for Alts?
A. Yes, Alts and other tickers.
Crypto Total Market Cap, Exclude Tether, (USD)Total cryptocurrency market capitalization without tether, with alerts for chosen value thresholds.
The rationale is that tether is a printed supply stablecoin with a fixed value; there is no need to include its value in a combined market cap. It's debatable if that's true, but that doesn't explain what this indicator is.
The second part of this indicator is highlighting when the aforementioned adjusted market cap is above or below certain values. They are round numbers; a psychological factor. A psyop, if you will.
Options to configure are the lower and upper bound and colors. The alerts must be manually turned on, as usual.

Crypto Long only Strategy 3h+ timeframeToday I bring another crypto strategy that works greatly with pairs like BTCEUR, ETHEUR, for 3h+ time frames.
Its a risky strategy because we have a hard stop loss of 25% of our capital which can be modified.
The idea behind its simple, we have a candle which is made from open+high+low+close / 4 , and we make the decision based on this one.
We only go long with this strategy .
For entry: if we have 5 ascending candles we enter, and we exit when we have 4 descending candles.
For this example, I used 100% of the initial capital(1000 EUR/USD), with a commission of 0.1% per each deal.
At the same time, the max capital that can be lost in a trade is going to be the equity risk, in this example 25% .
Overall we can see that's more or less around the same level as buy and hold strategy

Crypto MultiTrend multi timeframesHello, today I bring you another crypto strategy which can work with multiple timeframes and most of crypto currencies
Its made entirelly of multiple EMA , of different lengths : like super fast, fast, normal, slow and very slow
We also combine a little bit of price action together with the trend direction both for entry and for exits, to have a more precise control.
The rules for long close is above all EMA's, they are in ascending order and the at same time close is bigger than the previous high, and previous high > second previous high, close > 3rd previous high , close > 4th previous high, close > 5th previous high, 5th high > 6th high.
For short we have the same, but instead of high, we use lows, and instead of > we use < .
As exit we have 2 conditions for long and 2 for short
To exit long we have : super fast ema < fast ema and fast ema < normal and normal < slow ema. For short, they would be the opposite, using > sign.
The second exit for long is when our current low crosses below 4 of ours EMA during the same candle. For short, is when the high crosses above 4 of ours EMA during the same candle.
CAUTIOUS : Currently it uses not risk management system, so in this current condition is extremely risky . Be careful
If you have any questions lets me know
Crypto BOT lower timeframesThis is a crypto bot designed for lower time frames.
Its made of 2 EMA, one fast and one slower . They are combined together with Stochastic, MACD and price action patterns.
For entries we have multiple conditions :
First we check if one of our last 4 closed candles crossed above or below the faster EMA. After that for long, we check that last close is above the fast EMA, that the fast ema is above the slower EMA, at the same time that the histogram from MACD is positive and that we have crossover with the oversold line on stochastic. For the short , the opposite of long.
For exit we have TP/SL mechanic based on price % movement, in this example if the price moved 10% from the initial position it will exit.

CRYPTO Trend Direction Multiple EMA'sToday I bring an indicator specialized in crypto markets.
Its made of multiples EMA : very fast, fast, normal, slow, very slow
The logic behind its simple :
For long : we check that the EMA are in ascending order like EMA 5 > EMA 10 > EMA 20 .... and at the same time that last close of candle is above all of them.
For short : we check that the EMA are in descending order like EMA 5 < EMA 10 < EMA 20 .... and at the same time last close of candle is below all of them.
It can be used with all time frames.
Enjoy it !

Crypto EMA+MA+MACS by hobbeLeThis is an indicator that includes several EMAs and MAs (Used in Cryptotrading).
In addition, the Golden and Death Cross are also displayed.
Used MAs
MA 7 - Orange Line
MA 21 - Yellow Line
MA 25 - Grey Line
MA 99 - Blue Line
MA 200 - Green Line
Used EMAs
EMA 200 - Grey Dotted Line
EMA 222 - Pink Dotted Line
Golden Cross
Crossover MA25 + MA200
Death Cross
Crossunder MA25 + MA200
What is a Moving Average (MA) ?
A moving average (MA) is a widely used indicator in technical analysis that helps smooth out price action by filtering out the “noise” from random short-term price fluctuations.
Moving average is a trend-following, or lagging, indicator because it is based on past prices. The most common applications of moving averages are:
to identify the trend direction
to determine support and resistance levels
The two basic and commonly used moving averages are the simple moving average ( SMA ), which is the arithmetic average of a security over a defined number of time periods, and the exponential moving average ( EMA ), which gives greater weight to more recent prices.
What is a Golden Cross?
The golden cross is a candlestick pattern that is a bullish signal in which a relatively short-term moving average crosses above a long-term moving average. The golden cross is a bullish breakout pattern formed from a crossover involving a security's short-term moving average (such as the 15-day moving average) breaking above its long-term moving average (such as the 50-day moving average) or resistance level. As long-term indicators carry more weight, the golden cross indicates a bull market on the horizon and is reinforced by high trading volumes.
What Is a Death Cross?
The death cross is a technical chart pattern indicating the potential for a major selloff. The death cross appears on a chart when a stock’s short-term moving average crosses below its long-term moving average.
Source; Investopedia

Crypto ZigZag RSI strategy 15minThis strategy is designed for crypto markets like ETHUSD/T, BTCUSD/T and so on.
It works amazingly with 15 min time frames.
Its idea consists in :
We have the RSI indicator, and with it we check for the crossover with overbought and oversold levels. At the same time we have the zigzag which is made from the higher highs and the lower lows between a specific price movement in %.
For entries, they are going to be based on the crossover of rsi with overbought or oversold levels , combined together with cross over 0 line from the the zigzag.
At the same time the strategy has the posibility to go only long, only short or both.
Let me know if you have any questions.

Crypto Trend Following StudyThis is the study script indicator of Crypto Trend Following Strategy which can be used to automate your trading by alerts. With study script indicator, strategy can be easily automated.
To get access to the study script indicator please contact me directly by personal message.
To back test the strategy, see Crypto Trend Following Strategy indicator.
Script is using several moving averages to keep you on the right side of the trend. Signals are also filtered based on other indicators to prevent buying already overbought or selling already oversold coins and avoid ranging markets.
MAIN GOAL
Main goal of the strategy is long-term stable profit. No strategy has 100% accuracy therefore there always will be some false signals. But patience pays, with Trend Following Strategy, you will get couple of small loses while waiting to get big wins when coin is trending strongly. As you never know the right time you must sustain and be in all trades to make sure that you will not miss the big move.
BACKTEST
This script is for free to play with so you can back test and see for yourself how the strategy performs on any of your favourite coins.
Strategy is optimized and back tested for USDT and BTC pairs on 6h timeframe but it can be used on any pair and any timeframe.
RISK & REWARD
Strategy does not use safety orders as DCAs usually leads to bag holding sooner or later. It does not use take profit either as strategy will tell you when to buy and when to sell based on the actual market condition.
You should always use stop loss to protect your account from drawdown or even being liquidated.
You can change stop loss or take profit as you like or even back test the strategy with your preferred settings to find what suits you best.
STUDY SETTINGS
Important: Make sure that you use the same settings for both Strategy and Study indicators.
If you need any help with settings do not hesitate to ask. I would also appreciate any feedback and ideas how to improve the script.
==== Indicators settings ====
RSI Long < and StochRSI Long <
• used to filter out buy signals of already overbought coins - ( stoch ) RSI must be under set value to fire a BUY signal
RSI Short > and StochRSI Short >
• used to filter out sell signals of already oversold coins - ( stoch ) RSI must be over set value to fire a SELL signal
ADX >
• used to filter out buy or sell signals in ranging markets - ADX must be over set value to fire a BUY or SELL signal
MA Fast and Slow Length
• Two moving averages to indicate an actual short-term trend
Baseline Length & Type
• Baseline is a moving average which confirms the longer-term trend. You can set length and type of the moving average
Show every signal
• turn on to see signal on each candle whether strategy recommends opening long or short trade (green triangle – buy, red triangle – sell, no triangle – wait)

Crypto Trend Following StrategyThis is the strategy script indicator of Crypto Trend Following Strategy which can be used for back testing. With study script indicator, strategy can be easily automated.
To set alerts, see Crypto Trend Following Study indicator.
Script is using several moving averages to keep you on the right side of the trend. Signals are also filtered based on other indicators to prevent buying already overbought or selling already oversold coins and avoid ranging markets.
MAIN GOAL
Main goal of the strategy is long-term stable profit. No strategy has 100% accuracy therefore there always will be some false signals. But patience pays, with Trend Following Strategy, you will get couple of small loses while waiting to get big wins when coin is trending strongly. As you never know the right time you must sustain and be in all trades to make sure that you will not miss the big move.
BACKTEST
This script is for free to play with so you can back test and see for yourself how the strategy performs on any of your favourite coins.
Strategy is optimized and back tested for USDT and BTC pairs on 6h timeframe but it can be used on any pair and any timeframe.
RISK & REWARD
Strategy does not use safety orders as DCAs usually leads to bag holding sooner or later. It does not use take profit either as strategy will tell you when to buy and when to sell based on the actual market condition.
You should always use stop loss to protect your account from drawdown or even being liquidated.
You can change stop loss or take profit as you like or even back test the strategy with your preferred settings to find what suits you best.
STRATEGY SETTINGS
You can use the strategy script for fine tuning and find best settings for yourself.
If you need any help with settings do not hesitate to ask. I would also appreciate any feedback and ideas how to improve the script.
==== Indicators settings ====
RSI Long < and StochRSI Long <
• used to filter out buy signals of already overbought coins - ( stoch ) RSI must be under set value to fire a BUY signal
RSI Short > and StochRSI Short >
• used to filter out sell signals of already oversold coins - ( stoch ) RSI must be over set value to fire a SELL signal
ADX >
• used to filter out buy or sell signals in ranging markets - ADX must be over set value to fire a BUY or SELL signal
MA Fast and Slow Length
• Two moving averages to indicate an actual short-term trend
Baseline Length & Type
• Baseline is a moving average which confirms the longer-term trend. You can set length and type of the moving average
==== Test period settings ====
• You can set the back tested window
==== Strategy settings =====
• Target Take profit and Stop loss in %
• Only LONG trades – tick if you do not want to calculate SHORT trades in the back test
• Plot key levels on chart – if you use stop loss and/or take profit, you can turn on levels of price to reach (yellow – bought price, red – stop loss – green - take profit)
Back test calculates with commission and fixed order size. You can change these settings on Properties Tab

Crypto Margin Trading ConsensusThis is an indicator of the consensus of traders in the crypto market. It examines the number of short and long positions on several currencies (BTC, ETH, XRP, LTC, XMR, EOS and others) on each bar.
Sometimes traders are in consensus and they are right (enter long and the currencies rise, or enter the short and the currencies decrease) other times, although they are in consensus, it can happen that the market behaves exactly the opposite. Some signals are good, some are not (as with any other indicator, unfortunately).
Because it uses data about multiple currencies, it is a market breadth indicator - it does not refer to One currency, but to several important currencies in the crypto market, simultaneously (calculates based on information about several currencies). That's why it loads SLOWLY - it can take up to 60 seconds to appear.
If a multi-currency trader bar goes LONG (meaning they agree that it should be long), it displays a green upward-facing arrow, otherwise, if there is a consensus that it should be short, it displays a downward arrow.
I hope it will be of some use to you
