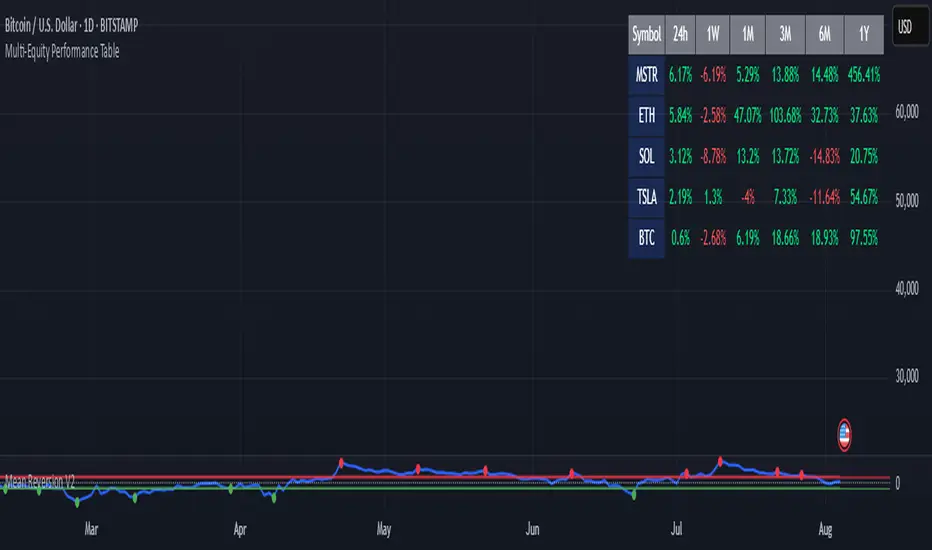
Multi-Equity Performance TableThis script allows you to track 5 equities (stocks/cryptos/etc) across multiple timeframes from 24H > 1W > 1M > 3M > 6M > 1Y. You can select the equities to track and also the timeframe to sort the chart. You can modify this script to track more equities but then you need to use less timeframes since Tradingview has a limit on the resources that the indicator can use. I created this using Claude.ai.
Cari dalam skrip untuk "crypto"
Game Theory Trading StrategyGame Theory Trading Strategy: Explanation and Working Logic
This Pine Script (version 5) code implements a trading strategy named "Game Theory Trading Strategy" in TradingView. Unlike the previous indicator, this is a full-fledged strategy with automated entry/exit rules, risk management, and backtesting capabilities. It uses Game Theory principles to analyze market behavior, focusing on herd behavior, institutional flows, liquidity traps, and Nash equilibrium to generate buy (long) and sell (short) signals. Below, I'll explain the strategy's purpose, working logic, key components, and usage tips in detail.
1. General Description
Purpose: The strategy identifies high-probability trading opportunities by combining Game Theory concepts (herd behavior, contrarian signals, Nash equilibrium) with technical analysis (RSI, volume, momentum). It aims to exploit market inefficiencies caused by retail herd behavior, institutional flows, and liquidity traps. The strategy is designed for automated trading with defined risk management (stop-loss/take-profit) and position sizing based on market conditions.
Key Features:
Herd Behavior Detection: Identifies retail panic buying/selling using RSI and volume spikes.
Liquidity Traps: Detects stop-loss hunting zones where price breaks recent highs/lows but reverses.
Institutional Flow Analysis: Tracks high-volume institutional activity via Accumulation/Distribution and volume spikes.
Nash Equilibrium: Uses statistical price bands to assess whether the market is in equilibrium or deviated (overbought/oversold).
Risk Management: Configurable stop-loss (SL) and take-profit (TP) percentages, dynamic position sizing based on Game Theory (minimax principle).
Visualization: Displays Nash bands, signals, background colors, and two tables (Game Theory status and backtest results).
Backtesting: Tracks performance metrics like win rate, profit factor, max drawdown, and Sharpe ratio.
Strategy Settings:
Initial capital: $10,000.
Pyramiding: Up to 3 positions.
Position size: 10% of equity (default_qty_value=10).
Configurable inputs for RSI, volume, liquidity, institutional flow, Nash equilibrium, and risk management.
Warning: This is a strategy, not just an indicator. It executes trades automatically in TradingView's Strategy Tester. Always backtest thoroughly and use proper risk management before live trading.
2. Working Logic (Step by Step)
The strategy processes each bar (candle) to generate signals, manage positions, and update performance metrics. Here's how it works:
a. Input Parameters
The inputs are grouped for clarity:
Herd Behavior (🐑):
RSI Period (14): For overbought/oversold detection.
Volume MA Period (20): To calculate average volume for spike detection.
Herd Threshold (2.0): Volume multiplier for detecting herd activity.
Liquidity Analysis (💧):
Liquidity Lookback (50): Bars to check for recent highs/lows.
Liquidity Sensitivity (1.5): Volume multiplier for trap detection.
Institutional Flow (🏦):
Institutional Volume Multiplier (2.5): For detecting large volume spikes.
Institutional MA Period (21): For Accumulation/Distribution smoothing.
Nash Equilibrium (⚖️):
Nash Period (100): For calculating price mean and standard deviation.
Nash Deviation (0.02): Multiplier for equilibrium bands.
Risk Management (🛡️):
Use Stop-Loss (true): Enables SL at 2% below/above entry price.
Use Take-Profit (true): Enables TP at 5% above/below entry price.
b. Herd Behavior Detection
RSI (14): Checks for extreme conditions:
Overbought: RSI > 70 (potential herd buying).
Oversold: RSI < 30 (potential herd selling).
Volume Spike: Volume > SMA(20) x 2.0 (herd_threshold).
Momentum: Price change over 10 bars (close - close ) compared to its SMA(20).
Herd Signals:
Herd Buying: RSI > 70 + volume spike + positive momentum = Retail buying frenzy (red background).
Herd Selling: RSI < 30 + volume spike + negative momentum = Retail selling panic (green background).
c. Liquidity Trap Detection
Recent Highs/Lows: Calculated over 50 bars (liquidity_lookback).
Psychological Levels: Nearest round numbers (e.g., $100, $110) as potential stop-loss zones.
Trap Conditions:
Up Trap: Price breaks recent high, closes below it, with a volume spike (volume > SMA x 1.5).
Down Trap: Price breaks recent low, closes above it, with a volume spike.
Visualization: Traps are marked with small red/green crosses above/below bars.
d. Institutional Flow Analysis
Volume Check: Volume > SMA(20) x 2.5 (inst_volume_mult) = Institutional activity.
Accumulation/Distribution (AD):
Formula: ((close - low) - (high - close)) / (high - low) * volume, cumulated over time.
Smoothed with SMA(21) (inst_ma_length).
Accumulation: AD > MA + high volume = Institutions buying.
Distribution: AD < MA + high volume = Institutions selling.
Smart Money Index: (close - open) / (high - low) * volume, smoothed with SMA(20). Positive = Smart money buying.
e. Nash Equilibrium
Calculation:
Price mean: SMA(100) (nash_period).
Standard deviation: stdev(100).
Upper Nash: Mean + StdDev x 0.02 (nash_deviation).
Lower Nash: Mean - StdDev x 0.02.
Conditions:
Near Equilibrium: Price between upper and lower Nash bands (stable market).
Above Nash: Price > upper band (overbought, sell potential).
Below Nash: Price < lower band (oversold, buy potential).
Visualization: Orange line (mean), red/green lines (upper/lower bands).
f. Game Theory Signals
The strategy generates three types of signals, combined into long/short triggers:
Contrarian Signals:
Buy: Herd selling + (accumulation or down trap) = Go against retail panic.
Sell: Herd buying + (distribution or up trap).
Momentum Signals:
Buy: Below Nash + positive smart money + no herd buying.
Sell: Above Nash + negative smart money + no herd selling.
Nash Reversion Signals:
Buy: Below Nash + rising close (close > close ) + volume > MA.
Sell: Above Nash + falling close + volume > MA.
Final Signals:
Long Signal: Contrarian buy OR momentum buy OR Nash reversion buy.
Short Signal: Contrarian sell OR momentum sell OR Nash reversion sell.
g. Position Management
Position Sizing (Minimax Principle):
Default: 1.0 (10% of equity).
In Nash equilibrium: Reduced to 0.5 (conservative).
During institutional volume: Increased to 1.5 (aggressive).
Entries:
Long: If long_signal is true and no existing long position (strategy.position_size <= 0).
Short: If short_signal is true and no existing short position (strategy.position_size >= 0).
Exits:
Stop-Loss: If use_sl=true, set at 2% below/above entry price.
Take-Profit: If use_tp=true, set at 5% above/below entry price.
Pyramiding: Up to 3 concurrent positions allowed.
h. Visualization
Nash Bands: Orange (mean), red (upper), green (lower).
Background Colors:
Herd buying: Red (90% transparency).
Herd selling: Green.
Institutional volume: Blue.
Signals:
Contrarian buy/sell: Green/red triangles below/above bars.
Liquidity traps: Red/green crosses above/below bars.
Tables:
Game Theory Table (Top-Right):
Herd Behavior: Buying frenzy, selling panic, or normal.
Institutional Flow: Accumulation, distribution, or neutral.
Nash Equilibrium: In equilibrium, above, or below.
Liquidity Status: Trap detected or safe.
Position Suggestion: Long (green), Short (red), or Wait (gray).
Backtest Table (Bottom-Right):
Total Trades: Number of closed trades.
Win Rate: Percentage of winning trades.
Net Profit/Loss: In USD, colored green/red.
Profit Factor: Gross profit / gross loss.
Max Drawdown: Peak-to-trough equity drop (%).
Win/Loss Trades: Number of winning/losing trades.
Risk/Reward Ratio: Simplified Sharpe ratio (returns / drawdown).
Avg Win/Loss Ratio: Average win per trade / average loss per trade.
Last Update: Current time.
i. Backtesting Metrics
Tracks:
Total trades, winning/losing trades.
Win rate (%).
Net profit ($).
Profit factor (gross profit / gross loss).
Max drawdown (%).
Simplified Sharpe ratio (returns / drawdown).
Average win/loss ratio.
Updates metrics on each closed trade.
Displays a label on the last bar with backtest period, total trades, win rate, and net profit.
j. Alerts
No explicit alertconditions defined, but you can add them for long_signal and short_signal (e.g., alertcondition(long_signal, "GT Long Entry", "Long Signal Detected!")).
Use TradingView's alert system with Strategy Tester outputs.
3. Usage Tips
Timeframe: Best for H1-D1 timeframes. Shorter frames (M1-M15) may produce noisy signals.
Settings:
Risk Management: Adjust sl_percent (e.g., 1% for volatile markets) and tp_percent (e.g., 3% for scalping).
Herd Threshold: Increase to 2.5 for stricter herd detection in choppy markets.
Liquidity Lookback: Reduce to 20 for faster markets (e.g., crypto).
Nash Period: Increase to 200 for longer-term analysis.
Backtesting:
Use TradingView's Strategy Tester to evaluate performance.
Check win rate (>50%), profit factor (>1.5), and max drawdown (<20%) for viability.
Test on different assets/timeframes to ensure robustness.
Live Trading:
Start with a demo account.
Combine with other indicators (e.g., EMAs, support/resistance) for confirmation.
Monitor liquidity traps and institutional flow for context.
Risk Management:
Always use SL/TP to limit losses.
Adjust position_size for risk tolerance (e.g., 5% of equity for conservative trading).
Avoid over-leveraging (pyramiding=3 can amplify risk).
Troubleshooting:
If no trades are executed, check signal conditions (e.g., lower herd_threshold or liquidity_sensitivity).
Ensure sufficient historical data for Nash and liquidity calculations.
If tables overlap, adjust position.top_right/bottom_right coordinates.
4. Key Differences from the Previous Indicator
Indicator vs. Strategy: The previous code was an indicator (VP + Game Theory Integrated Strategy) focused on visualization and alerts. This is a strategy with automated entries/exits and backtesting.
Volume Profile: Absent in this strategy, making it lighter but less focused on high-volume zones.
Wick Analysis: Not included here, unlike the previous indicator's heavy reliance on wick patterns.
Backtesting: This strategy includes detailed performance metrics and a backtest table, absent in the indicator.
Simpler Signals: Focuses on Game Theory signals (contrarian, momentum, Nash reversion) without the "Power/Ultra Power" hierarchy.
Risk Management: Explicit SL/TP and dynamic position sizing, not present in the indicator.
5. Conclusion
The "Game Theory Trading Strategy" is a sophisticated system leveraging herd behavior, institutional flows, liquidity traps, and Nash equilibrium to trade market inefficiencies. It’s designed for traders who understand Game Theory principles and want automated execution with robust risk management. However, it requires thorough backtesting and parameter optimization for specific markets (e.g., forex, crypto, stocks). The backtest table and visual aids make it easy to monitor performance, but always combine with other analysis tools and proper capital management.
If you need help with backtesting, adding alerts, or optimizing parameters, let me know!

Mig Trade Model - Kill Zones
Key features:
Liquidity Hunt Detection: Spots aggressive moves that "hunt" stops beyond recent swing highs/lows.
Consolidation Filter: Requires 1-3 small-range candles after a hunt before confirming with a strong candle.
Bias Application: Uses daily open/close to auto-detect bias or allows manual override.
Kill Zone Restriction: Limits signals to London (default: 7-10 AM UTC) and NY (default: 12-3 PM UTC) sessions for better relevance in active markets.
This strategy is inspired by smart money concepts (SMC) and ICT (Inner Circle Trader) methodologies, aiming to capture venom-like "stings" in price action where liquidity is grabbed before reversals.
How It Works
ATR Calculation: Uses a user-defined ATR length (default: 14) to measure volatility, which scales candle body and range thresholds.
Bias Determination:
Auto: Compares daily close to open (bullish if close > open).
Manual: User selects "Bullish" or "Bearish."
Strong Candles:
Bullish: Green candle with body > 2x ATR (configurable).
Bearish: Red candle with body > 2x ATR.
Small Range Candles:
Candles where high-low < 0.5x ATR (configurable).
Liquidity Hunt:
Bullish Hunt: Strong bearish candle making a new low below the past swing low (default: 10 bars).
Bearish Hunt: Strong bullish candle making a new high above the past swing high.
Signal Generation:
After a hunt, counts 1-3 small-range candles.
Confirms with a strong candle in the opposite direction (e.g., strong bullish after bearish hunt).
Resets if >3 small candles or an opposing strong candle appears.
Kill Zone Filter:
Checks if the current bar's time (in UTC) falls within London or NY Kill Zones.
Only allows final "Buy" (bullish entry) or "Sell" (bearish entry) if bias matches and in Kill Zone.
Plots:
Yellow circle (below): Bullish liquidity hunt.
Orange circle (above): Bearish liquidity hunt.
Blue diamond (below): Raw bullish signal.
Purple diamond (above): Raw bearish signal.
Green triangle up ("Buy"): Filtered bullish entry.
Red triangle down ("Sell"): Filtered bearish entry.
Inputs
Bias: "Auto" (default), "Bullish", or "Bearish" – Controls signal direction based on daily trend.
ATR Length: 14 (default) – Period for ATR calculation.
Swing Length for Liquidity Hunt: 10 (default) – Bars to look back for swing highs/lows.
Strong Candle Body Multiplier (x ATR): 2.0 (default) – Threshold for strong candle bodies.
Small Range Multiplier (x ATR): 0.5 (default) – Threshold for small-range candles.
London Kill Zone Start/End Hour (UTC): 7/10 (default) – Customize London session hours.
NY Kill Zone Start/End Hour (UTC): 12/15 (default) – Customize New York session hours.
Usage Tips
Timeframe: Best on lower timeframes (e.g., 5-15 min) for intraday trading, especially forex pairs like EURUSD or GBPUSD.
Timezone Adjustment: Inputs are in UTC. If your chart is in a different timezone (e.g., EST = UTC-5), adjust hours accordingly (e.g., London: 2-5 AM EST → 7-10 UTC).
Risk Management: Use with stop-loss (e.g., beyond the hunt low/high) and take-profit based on ATR multiples. Not financial advice—backtest thoroughly.
Customization: Tweak multipliers for different assets; higher for volatile cryptos, lower for stocks.
Limitations: Relies on historical data; may generate false signals in ranging markets. Combine with other indicators like volume or support/resistance.
This indicator is for educational purposes. Always use discretion and proper risk management in live trading. If you find it useful, feel free to share feedback or suggestions!

NightWatch 24/5 [theUltimator5]NightWatch 24/5 is a comprehensive indicator designed to seamlessly display both regular and overnight trading (BOATS exchange) into a single chart. Current TV limitations don't allow both overnight trading and regular exchanges to appear on the same chart due to timeframe visibility settings. We can either select between RTH (Regular Trading Hours) or ETH (Extended Trading Hours). There is no option to show 24 hour charts when looking at a stock. This indicator attempts to solve this issue.
Please read the entire description thoroughly because this indicator takes a little bit of setup to work properly!
---IMPORTANT-- -
This indicator MUST be used over a liquid cryptocurrency chart, like Bitcoin. It requires access to something that trades 24/7 and has volume data for all periods. Bitcoin on Coinbase is the best option. Please select Bitcoin as your main ticker before adding this indicator to the chart.
-------------------
This indicator combines the price of both the regular trading hours and the overnight trading to create a single price line and volume candles. You can select view settings to either overlay the price on the chart, or have it below the chart. Volume can be toggled on or off as well.
Default settings:
Ticker = GME
Overlay Candles on Main Chart = true
Display Data = Both Price and Volume
Show Status Table = true
Here is an explanation for each of these settings:
Ticker - Type in the ticker you want to track overnight and intraday data for
Overlay Candles on Main chart - This will push the price candles onto the main chart area instead of below it. Volume candles will remain in their own separate pane below. This is useful if you want to track both price and volume without adding the indicator twice.
Display Data - This determines what data to show. Volume, price, or both volume and price.
Show Status Table - This toggles on or off the table that shows the ticker name, current session, and the price (change) of the ticker since the most recent daily close.
If you overlay the price onto the chart, the price of the stock you are looking at will likely be a VERY different price than the crypto it is overlaying against. There are a couple workarounds. You can either zoom into the chart around the price of the stock you are looking at (time consuming), or you can go into your object tree and drag the indicator up into the main chart area. This will overlay the price onto the crypto while maintaining it's own unique y-axis.
After you move the indicator up, you can add the indicator back a second time, then change the settings to only show the volume candles. You can then toggle off the table on one of the two so you don't see duplicate tables. This is the setting I am showing in my chart above. The indicator is added twice with the price being pulled up into the same window as Bitcoin, then a second instance below showing just volume.
--LIMITATIONS--
Since the indicator requires the use of a 24 hour market ticker like Bitcoin, it DOES NOT display extended hours data. The price and volume data STOPS at 16:00 EST then resumes back up at 20:00 EST when BOATS opens. At 04:00, the price and volume then stops until 09:30, when the regular trading hours begin. This causes a flat line in the price during those periods. Unfortunately, there is no current workaround to this issue.
If Bitcoin becomes illiquid (or whatever crypto you choose), it will only populate data for the ticker you want if there is data available for that crypto at the same time period. A gap in Bitcoin volume will show a gap in trade activity for your ticker.

Currency Weekend - shading weekend trading// ─────────────────────────────────────────────────────────────────────────────
// © 2025, Steve / Steven Anthony – "Currency Weekend"
// This script highlights the low-liquidity weekend window that often affects
// both fiat currency markets and cryptocurrencies like Bitcoin.
//
// ╭─────────────────────────────── DESCRIPTION ───────────────────────────────╮
// | This indicator shades a customizable time window on your chart, |
// | originally set to highlight the **forex weekend lull** from |
// | **Friday 21:00 UTC to Sunday 21:00 UTC**, when traditional fiat |
// | currency markets close. |
// | |
// | Traders who observe Bitcoin, Ethereum, or other crypto assets may |
// | notice reduced liquidity or increased erratic moves during this time, |
// | due to overlapping behaviors from professional forex traders who |
// | trade both markets. |
// ╰──────────────────────────────────────────────────────────────────────────╯
//
// 🔧 Flexible Configuration:
// - Define your own start and end **day + time** for shading
// - Useful for shading other custom quiet periods or session transitions
//
// 💡 Use Cases:
// - Avoid trading during low-liquidity periods
// - Spot potential weekend traps or price gaps
// - Align crypto behavior with fiat market hours
//
// 📍 Default Settings:
// - Start: Friday 21:00 UTC
// - End: Sunday 21:00 UTC
//
// Timezone is normalized to the chart’s timezone for seamless integration.
//
// ─────────────────────────────────────────────────────────────────────────────

Adaptive Market Profile – Auto Detect & Dynamic Activity ZonesAdaptive Market Profile is an advanced indicator that automatically detects and displays the most relevant trend channel and market profile for any asset and timeframe. Unlike standard regression channel tools, this script uses a fully adaptive approach to identify the optimal period, providing you with the channel that best fits the current market dynamics. The calculation is based on maximizing the statistical significance of the trend using Pearson’s R coefficient, ensuring that the most relevant trend is always selected.
Within the selected channel, the indicator generates a dynamic market profile, breaking the price range into configurable zones and displaying the most active areas based on volume or the number of touches. This allows you to instantly identify high-activity price levels and potential support/resistance zones. The “most active lines” are plotted in real-time and always stay parallel to the channel, dynamically adapting to market structure.
Key features:
- Automatic detection of the optimal regression period: The script scans a wide range of lengths and selects the channel that statistically represents the strongest trend.
- Dynamic market profile: Visualizes the distribution of volume or price touches inside the trend channel, with customizable section count.
- Most active zones: Highlights the most traded or touched price levels as dynamic, parallel lines for precise support/resistance reading.
- Manual override: Optionally, users can select their own channel period for full control.
- Supports both linear and logarithmic charts: Simple toggle to match your chart scaling.
Use cases:
- Trend following and channel trading strategies.
- Quick identification of dynamic support/resistance and liquidity zones.
- Objective selection of the most statistically significant trend channel, without manual guesswork.
- Suitable for all assets and timeframes (crypto, stocks, forex, futures).
Originality:
This script goes beyond basic regression channels by integrating dynamic profile analysis and fully adaptive period detection, offering a comprehensive tool for modern technical analysts. The combination of trend detection, market profile, and activity zone mapping is unique and not available in TradingView built-ins.
Instructions:
Add Adaptive Market Profile to your chart. By default, the script automatically detects the optimal channel period and displays the corresponding regression channel with dynamic profile and activity zones. If you prefer manual control, disable “Auto trend channel period” and set your preferred period. Adjust profile settings as needed for your asset and timeframe.
For questions, suggestions, or further customization, contact Julien Eche (@Julien_Eche) directly on TradingView.

CGPT Golden Cross / Death Cross AlertThis custom indicator identifies Golden Cross (Gx) and Death Cross (Dx) events using either EMA or SMA moving averages. A Golden Cross occurs when a short-term MA (e.g., 50) crosses above a long-term MA (e.g., 200), signaling potential bullish momentum. A Death Cross signals potential bearish momentum, with the short-term MA crossing below the long-term MA.
It includes:
📈 Customizable MA types (EMA or SMA)
⚙️ Adjustable fast & slow MA lengths
🟢🔴 Chart labels for Gx (green) and Dx (red)
🎯 Background highlights for visual trend shifts
🔔 Built-in alert conditions for real-time notifications
Ideal for crypto, stocks, or forex swing and trend trading
MA Crossover Detector
The Moving Average Crossover Detector is a custom indicator that visually shows buy and sell signals clearly on the chart. based on the crossing of two moving averages — a popular and beginner-friendly tool in technical analysis.
It plots two moving averages — One fast (short period) and one slow (long period) — and highlights crossover points:
✅ Buy Signal (Golden Cross) – When the fast MA crosses above the slow MA.
❌ Sell Signal (Death Cross) – When the fast MA crosses below the slow MA.
✅ Features
Visual: Clearly shows crossovers on the chart.
Customizable: Choose periods, types, styles, etc.
Alert-ready: You can set alerts for crossovers.
The Moving Average (MA) Crossover Strategy is one of the simplest and most widely used strategies in technical analysis for trading stocks, forex, crypto, and other markets. It relies on the interaction between two moving averages to generate buy and sell signals.
Core Components
Short-Term Moving Average (Fast MA) : Reacts quickly to price changes (e.g., 9-period or 20-period).
Long-Term Moving Average (Slow MA) : Reacts more slowly to price changes (e.g., 21-period or 200-period).
How the Strategy Works
Bullish Crossover (Golden Cross):
Occurs when the fast MA crosses above the slow MA. Interpreted as a buy signal, indicating a potential uptrend.
Bearish Crossover (Death Cross):
Occurs when the fast MA crosses below the slow MA. Interpreted as a sell signal, indicating a potential downtrend.
Common Variants
Short-term trading
9 EMA
21 EMA
Swing trading
20 SMA
50 SMA
Long-term investing
50 SMA
200 SMA
Pros
Easy to understand and implement
Works well in trending markets
Can be automated for backtesting and execution
Cons
Lagging indicator: MAs are based on past prices, so signals come after the move has started.
Choppy markets = whipsaws: Generates false signals in sideways/range-bound conditions.
May underperform in volatile or mean-reverting environments
Tips for Improvement
Use confirmation tools : e.g., RSI, MACD, volume analysis, price action
Add filters : Trend filter (ADX), volatility filter (ATR), or time filter (session-based)
Combine with price structure : Support/resistance, breakouts, pullbacks

Dynamic S/R System - Pivot + ChannelDynamic S/R System - Pivot + Channel
A comprehensive Support & Resistance indicator combining dual methodologies for institutional-grade price level analysis
📊 CORE FEATURES
Dual Detection System
• Pivot-Based Levels - Historical turning points with intelligent touch counting
• Dynamic Channel S/R - Trend-aware linear regression boundaries
• Smart Level Management - Auto-merges similar levels, removes weak/outdated ones
Volume Integration
• Multi-timeframe volume analysis using EMA oscillator and spike detection
• Volume confirmation for all breakout signals to filter false moves
• Real-time volume status (Normal/High/Spike) in live information panel
Intelligent Touch Counting
• Automatic level validation through touch frequency analysis
• Strength classification with visual differentiation (colors/thickness)
• Level labels showing exact touch count (S3, R5, etc.)
━━━━━━━━━━━━━━━━━━━━━━━━━━━━━━━━━━━━━━━━━━━━━━━━━━━━━━━━━━━━━━━━━━━━━━━━━━━━━━━
🎨 VISUAL ELEMENTS
Line System
Solid Lines: Pivot-based S/R levels
Dashed Lines: Dynamic channel boundaries
Color Coding:
• 🔵 Blue/🔴 Red: Standard support/resistance
• 🟠 Orange: Strong levels (multiple touches)
• 🟣 Purple: Channel S/R levels
Signal Labels
• "B" - Pivot S/R breakout with volume confirmation
• "CB" - Channel boundary breakout
• "Bull/Bear Wick" - False breakout detection (wick rejections)
Information Panel
Real-time analysis displays:
• Total resistance/support levels detected
• Closest S/R levels to current price
• Volume status and position relative to levels
• Current market position assessment
━━━━━━━━━━━━━━━━━━━━━━━━━━━━━━━━━━━━━━━━━━━━━━━━━━━━━━━━━━━━━━━━━━━━━━━━━━━━━━━
✅ KEY ADVANTAGES
Multi-Method Validation
Combines historical pivot analysis with dynamic trend channels for comprehensive market view
False Breakout Protection
• Volume confirmation requirements
• Wick analysis to identify failed attempts
• Multiple validation criteria before signal generation
Adaptive Level Management
• Automatically updates as new pivots form
• Removes outdated/weak levels
• Maintains clean, relevant level display
Institutional-Grade Analysis
• Touch counting reveals institutional respect levels
• Volume integration shows smart money activity
• Strength classification identifies high-probability zones
━━━━━━━━━━━━━━━━━━━━━━━━━━━━━━━━━━━━━━━━━━━━━━━━━━━━━━━━━━━━━━━━━━━━━━━━━━━━━━━
⏰ OPTIMAL USE CASES
Best Timeframes
• Daily - Primary recommendation for swing trading
• 4-Hour - Intraday analysis and entries
• Weekly - Long-term position planning
Ideal Markets
• Crypto pairs (especially ETH/BTC, BTC/USD)
• Forex majors with good volume data
• Large-cap stocks with institutional participation
Trading Applications
• Entry/exit planning around key S/R levels
• Breakout confirmation with volume validation
• Risk management using nearest S/R for stops
• Trend analysis through channel dynamics
━━━━━━━━━━━━━━━━━━━━━━━━━━━━━━━━━━━━━━━━━━━━━━━━━━━━━━━━━━━━━━━━━━━━━━━━━━━━━━━
⚙️ CONFIGURATION GUIDELINES
Conservative Setup (Higher Confidence)
Min Pivot Strength: 3-4
Volume Threshold: 25-30%
Max Levels: 6-8
Aggressive Setup (More Signals)
Min Pivot Strength: 2
Volume Threshold: 15-20%
Max Levels: 10-12
🔔 ALERT SYSTEM
Breakout Alerts
• Resistance/Support breaks with volume confirmation
• Channel boundary violations
• Approaching strong S/R levels
Advanced Notifications
• Strong level approaches (within 0.5% of price)
• False breakout detection
• Volume spike confirmations
📈 TRADING STRATEGY GUIDE
Entry Strategy
1. Wait for price to approach identified S/R level
2. Confirm with volume analysis (spike/high volume preferred)
3. Watch for wick formations indicating rejection
4. Enter on confirmed breakout with volume or bounce with rejection
Risk Management
• Use nearest S/R level for stop placement
• Scale position size based on level strength (touch count)
• Monitor volume confirmation for exit signals
Market Context
• Combine with higher timeframe trend analysis
• Consider overall market sentiment and volatility
• Use channel direction for bias confirmation
Transform complex S/R analysis into actionable trading intelligence with institutional-level insights for professional trading decisions.

World-Class Crypto Strategy version 9 - BTC/ETH/SOL/XRP + MLScript intended to mirror BlackRock strategies and be used with fully integrated trading bot

SwingTrade ADX Strategy v6This is a swing trading strategy that combines VWAP (Volume Weighted Average Price), ADX (Average Directional Index) for trend strength, and volume ratios to generate long/short entry and exit signals. It's designed for daily charts but can be adapted.
#### Key Features:
- **Entries**: Based on VWAP crossovers, rising/falling delta (price deviation from VWAP), ADX trend confirmation, and volume ratios.
- **Exits**: Dynamic exits when VWAP delta reverses after a peak.
- **Filters**: Optional toggles for VWAP signals, ADX, and volume. Backtest date range for custom periods.
- **Visuals**: VWAP line, signal shapes/labels, and an info panel showing key metrics (VWAP Delta %, ADX, Volume Ratio).
- **Alerts**: Built-in alerts for buy/sell entries and exits.
#### How to Use:
1. Apply to your chart (e.g., stocks, forex, crypto).
2. Adjust parameters in the settings (e.g., ADX threshold, volume period).
3. Enable/disable indicators as needed.
4. Backtest using the date filters and review equity curve.
**Disclaimer**: This is for educational purposes only. Past performance is not indicative of future results. Not financial advice—trade at your own risk. Backtest thoroughly and use with proper risk management.
Feedback welcome! If you find it useful, give it a like.

Zeefreaks Predator Mask CryptoMade by Zeefreaks, for his dear students so when they see a chart, they can easily identify if it is a buy or sell within a minute.

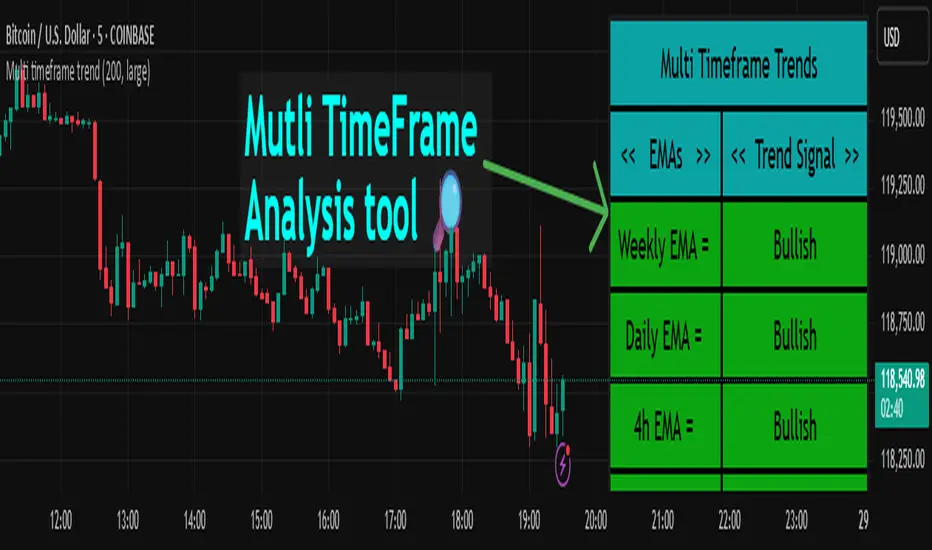
Multi timeframe trendDESCRIPTION
This indicator, Multi Timeframe Trend, is a powerful tool designed to give traders a comprehensive overview of market trends across multiple timeframes using a single, customizable Exponential Moving Average (EMA). It visually displays whether the price is trading above or below the EMA on each timeframe, helping traders quickly determine the dominant trend at a glance.
The real-time dashboard is plotted directly on your chart and color-coded to show bullish (green) or bearish (red) conditions per timeframe, from 15 minutes to 1 week. It is especially helpful for identifying trend alignment across multiple timeframes—an essential component of many professional trading strategies.
USER INPUTS
* Enter the EMA length – Adjust the EMA period used in the trend calculation (default: 200)
* Table Size – Choose how large the on-chart table appears: "tiny", "small", "normal", or "large"
INDICATOR LOGIC
* The indicator calculates the EMA for each of the following timeframes: 1W, 1D, 4H, 1H, 30M, and 15M
* It checks whether the current close is above or below each EMA and labels it as:
* Bullish if close > EMA
* Bearish if close < EMA
* Each timeframe’s trend is displayed in a dynamic table in the top-right corner of the chart
* The background color of each cell changes according to trend condition for quick visual interpretation
* Real-time responsiveness: handles both historical and live bars to maintain accurate, flicker-free updates
WHY IT IS UNIQUE
* Combines multiple timeframe trend analysis into a single glance
* Clean and color-coded dashboard overlay for real-time trading decisions
* Avoids repainting using barstate logic for accurate trend updates
* Fully customizable table size and EMA length
* Works on any chart, including stocks, crypto, forex, indices
HOW USERS CAN BENEFIT FROM IT
* Multi-timeframe confirmation: Easily confirm alignment across timeframes before entering a trade
* Avoid false signals by ensuring higher timeframe trends agree with lower timeframe setups
* Enhance strategy filters: Use as a trend filter in combination with your existing entry indicators
* Quick market analysis: No need to switch between charts or manually calculate EMAs
* Visual clarity: Trend conditions are easy to read and interpret in real-time
Open Interest Screener (Fixed Zones)📌 Purpose
This indicator scans Open Interest (OI) changes across selected exchanges and highlights significant spikes or drops directly on the chart using dynamic shaded zones.
It is designed to help traders detect unusual market positioning changes that may precede volatility events.
🧠 How It Works
1. Data Sources
Supports multiple exchanges: BitMEX USD, BitMEX USDT, Kraken USD (toggle on/off in settings).
Automatically adapts symbol prefix based on the chart’s base asset.
2. Spike / Drop Detection
OI % Change is calculated over a configurable lookback (Bars to look back).
Spike Up: OI increases by more than Threshold %.
Spike Down: OI decreases by more than Threshold %.
3. Dynamic Zones
When a spike occurs, a green zone (increase) or red zone (decrease) is drawn on the chart.
Zone height is dynamic, based on price high/low ± 5%, preventing chart distortion.
Minimum spacing (Zone Spacing) prevents clustering.
📈 How to Use
Green Zones: Large OI increase can signal fresh positioning (possible breakout setups).
Red Zones: Large OI decrease can signal liquidation events or position unwinds.
Combine with price action, funding rates, or volatility measures for higher confidence.
Recommended Timeframes: Works best on 15m, 1h, 4h.
Markets: Crypto derivatives (OI data available).
⚙️ Inputs
Bars to Look Back
OI % Change Threshold
Zone Width
Exchange toggles (BitMEX USD/USDT, Kraken USD)
⚠️ Disclaimer
This script is for educational purposes only and does not constitute financial advice.
Always test thoroughly before live trading.

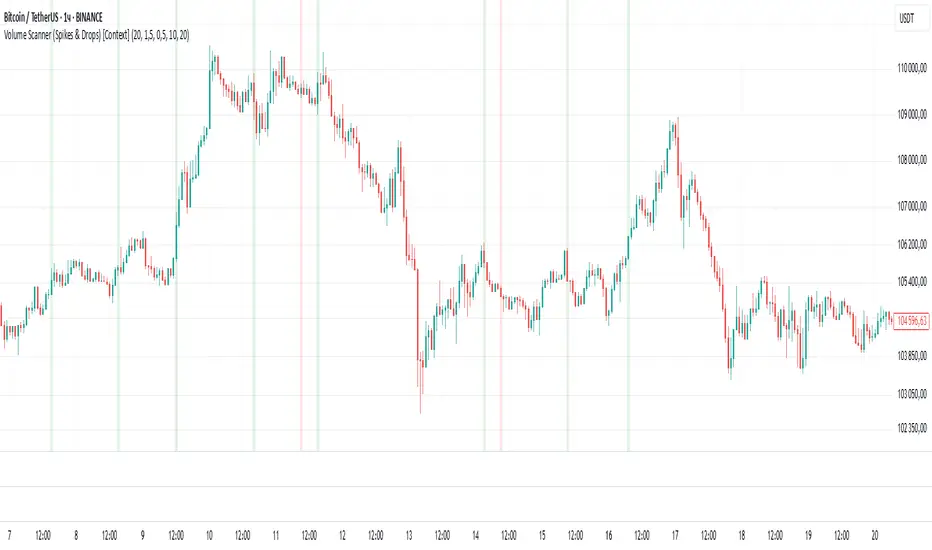
Volume Scanner (Spikes & Drops) [Context]📌 Purpose
This indicator detects significant volume spikes or drops and optionally filters them by price context (local highs/lows).
It helps identify potential breakout or exhaustion points with improved signal quality compared to raw volume alerts.
🧠 How It Works
1. Volume Spike / Drop Detection
SMA Volume over N bars is calculated as baseline.
Volume Spike: Volume > SMA × Spike Multiplier (default 1.5×).
Volume Drop: Volume < SMA × Drop Multiplier (default 0.5×).
2. Context Filter (optional)
When Use Context = ON:
Bullish Context: Volume spike at/near local price high (last Lookback bars).
Bearish Context: Volume drop at/near local price low (last Lookback bars).
3. Signal Gap
Minimum spacing between signals (Min Gap Bars) prevents excessive clustering.
4. Visuals
Background shading:
Green = Volume Spike in bullish context.
Red = Volume Drop in bearish context.
Alerts can be configured for both conditions.
📈 How to Use
Volume Spikes near highs can indicate breakouts or exhaustion tops.
Volume Drops near lows can signal liquidity dry-up or potential reversals.
Combine with price action or support/resistance for confirmation.
Recommended Timeframes: Works on all timeframes; more reliable on 15m, 1h, 4h.
Markets: Crypto, Forex, Stocks.
⚙️ Inputs
Volume SMA Length
Spike Multiplier / Drop Multiplier
Use Context (High/Low filter)
Min Gap Bars (avoid clustered signals)
⚠️ Disclaimer
This script is for educational purposes only. It does not constitute financial advice.
Always test thoroughly before live trading.
Smart Price Divergence (MACD Filter) + EMA📌 Purpose
This indicator detects Price Divergences with MACD filtered by a 200 EMA trend condition.
It helps identify high-probability reversal zones aligned with market trend context.
🧠 How It Works
1. MACD Divergence Logic
Bearish Divergence:
Price makes a higher high.
MACD makes a lower high.
Price is above EMA (indicating possible exhaustion in bullish trend).
Bullish Divergence:
Price makes a lower low.
MACD makes a higher low.
Price is below EMA (indicating possible exhaustion in bearish trend).
2. EMA Trend Filter
EMA(200) is used as a directional filter:
Bearish divergences considered above EMA (extended bullish conditions).
Bullish divergences considered below EMA (extended bearish conditions).
3. Visual & Alerts
EMA(200) plotted on chart in orange.
Red triangles for Bearish Divergence.
Green triangles for Bullish Divergence.
Alerts fire for both divergence types.
📈 How to Use
Look for divergence signals as potential reversal alerts.
Combine with support/resistance or price action for confirmation.
EMA ensures signals occur in extended zones, increasing reliability.
Recommended Timeframes: 1h, 4h, D.
Markets: Forex, Crypto, Stocks.
⚙️ Inputs
MACD Fast / Slow / Signal Length
EMA Length (default 200)
⚠️ Disclaimer
This script is for educational purposes only. It does not constitute financial advice.
Always test thoroughly before live trading.

Smart Deviation Trend Bands PRO + MTF Filter📌 Purpose
This indicator combines multi-level Deviation Bands (±1, ±2, ±3 standard deviations from SMA) with a Higher Timeframe (HTF) Trend Filter.
It helps traders identify potential bounce and breakout setups aligned with the dominant market trend.
🧠 How It Works
1. Deviation Bands
SMA(Length) is calculated as the centerline.
Standard deviations (±1, ±2, ±3) define multiple dynamic support and resistance zones.
Outer bands (±3) often mark overextended zones; inner bands (±1, ±2) show active trading areas.
2. HTF Trend Filter
A higher timeframe SMA (HTF SMA) acts as a trend confirmation tool.
Default filter timeframe: 1 Day.
Trend Up: Price > HTF SMA
Trend Down: Price < HTF SMA
3. Entry Signals
Long Signal: Price crosses above lower deviation band (+1) when HTF trend is UP.
Short Signal: Price crosses below upper deviation band (−1) when HTF trend is DOWN.
4. Visuals & Alerts
Bands plotted in red (upper) and green (lower).
Centerline = SMA in blue.
HTF SMA in orange.
Circles on chart mark entry points; alerts trigger automatically.
📈 How to Use
In trending markets: Trade with the HTF direction, using band touches for entries.
In mean-reversion setups: Outer bands can be used to spot potential overbought/oversold zones.
Combine with volume or price action for confirmation.
Recommended Timeframes: 1h, 4h, D.
Markets: Forex, Crypto, Stocks.
⚙️ Inputs
SMA Length
StdDev Multiplier 1 / 2 / 3
HTF Timeframe (default: D1)
⚠️ Disclaimer
This script is for educational purposes only. It does not constitute financial advice.
Always test thoroughly before live trading.

Smart Volatility Squeeze + Trend Filter📌 Purpose
This indicator detects volatility squeeze conditions when Bollinger Bands contract inside Keltner Channels and signals potential breakout opportunities.
It also includes an optional EMA-based trend filter to align signals with the dominant market direction.
🧠 How It Works
1. Squeeze Condition
Bollinger Bands (BB): Length = 20, StdDev = 2.0 (default)
Keltner Channels (KC): EMA Length = 20, ATR Multiplier = 1.5 (default)
Squeeze ON: Occurs when BB Upper < KC Upper and BB Lower > KC Lower (low volatility zone).
2. Breakout Signals
Long Breakout: Price crosses above BB Upper after squeeze.
Short Breakout: Price crosses below BB Lower after squeeze.
3. Trend Filter (optional)
EMA(50) used to confirm breakout direction:
Long signals allowed only if price > EMA(50)
Short signals allowed only if price < EMA(50)
Toggle Use Trend Filter to enable/disable.
4. Visual & Alerts
Green circle at chart bottom indicates Squeeze ON.
Green/Red triangles mark breakouts.
Background gradually brightens during squeeze buildup.
Alerts available for long and short breakouts.
📈 How to Use
Look for Squeeze ON → then wait for breakout arrows.
Trade in breakout direction, preferably with trend filter ON.
Works best on higher timeframes (1h, 4h, D) and trending markets.
Markets: Crypto, Forex, Stocks — effective in volatile assets.
⚙️ Inputs
BB Length / StdDev
KC EMA Length / ATR Multiplier
Use Trend Filter
Trend EMA Length
⚠️ Disclaimer
This script is for educational purposes only. It does not constitute financial advice.
Always test thoroughly before live trading.

Smart RSI Divergence PRO | Auto Lines + Alerts📌 Purpose
This indicator automatically detects Regular and Hidden RSI Divergences between price action and the RSI oscillator.
It plots divergence lines directly on the chart, labels signals, and includes alerts for automated monitoring.
🧠 How It Works
1. RSI Calculation
RSI is calculated using the selected Source (default: Close) and RSI Length (default: 14).
2. Divergence Detection via Fractals
Swing points on both price and RSI are detected using fractal logic (5-bar patterns).
Regular Divergence:
Bearish: Price forms a higher high, RSI forms a lower high.
Bullish: Price forms a lower low, RSI forms a higher low.
Hidden Divergence:
Bearish: Price forms a lower high, RSI forms a higher high.
Bullish: Price forms a higher low, RSI forms a lower low.
3. Auto Drawing Lines
Lines are drawn automatically between divergence points:
Red = Regular Bearish
Green = Regular Bullish
Orange = Hidden Bearish
Blue = Hidden Bullish
Line width and transparency are adjustable.
4. Labels and Alerts
Labels mark divergence points with up/down arrows.
Alerts trigger for each divergence type.
📈 How to Use
Use Regular Divergences to anticipate trend reversals.
Use Hidden Divergences to confirm trend continuation.
Combine with support/resistance, trendlines, or volume for higher probability setups.
Recommended Timeframes: Works on all timeframes; more reliable on 1h, 4h, and Daily.
Markets: Forex, Crypto, Stocks.
⚙️ Inputs
Source (Close, HL2, etc.)
RSI Length
Toggle Regular / Hidden Divergence visibility
Toggle Lines / Labels
Line Width & Line Transparency
⚠️ Disclaimer
This script is for educational purposes only. It does not constitute financial advice.
Always test thoroughly before using in live trading.

Buy Sell Magic Rework📌 Purpose
This script is a reworked version of the Parabolic SAR strategy, with an optional ZigZag filter to confirm reversal points.
It helps traders identify potential trend reversals with reduced noise compared to the standard SAR.
🧠 How It Works
1. Parabolic SAR Flip Signals
Buy Signal: Triggered when SAR flips from above price to below price.
Sell Signal: Triggered when SAR flips from below price to above price.
(Default SAR parameters: Start = 0.02, Increment = 0.02, Max = 0.2)
2. ZigZag Filter (Optional)
When Use ZigZag Filter = true:
The script confirms reversals only at significant pivots (swing highs/lows) detected by the ZigZag algorithm over the selected ZigZag Period (default = 14 bars).
Buy Signal: Appears only when a new pivot low is detected.
Sell Signal: Appears only when a new pivot high is detected.
3. Trade-Off
Without ZigZag: More signals, more noise.
With ZigZag: Fewer signals, but stronger confirmation and reduced false entries.
📈 How to Use
Signals appear as green arrows for buy and red arrows for sell.
Works well for:
Trend reversal detection.
Swing trading confirmation.
Filtering entries for other systems.
Recommended Timeframes: 15m, 1h, 4h.
Markets: Forex, Crypto, Stocks.
⚙️ Inputs
ZigZag Period (bars for pivot detection)
SAR Start / Increment / Max (SAR parameters)
Use ZigZag Filter (toggle for confirmation)
⚠️ Disclaimer
This script is for educational purposes only. It does not constitute financial advice.
Always test thoroughly before live trading.

Smart Impulse Exhaustion Finder (ATR + ADX Filter)📌 Purpose
This indicator detects potential exhaustion of strong bullish or bearish impulses at fresh swing highs/lows by combining multiple price action and volatility-based filters.
🧠 How It Works
A signal is triggered only when all core conditions are satisfied:
1. Swing High/Low Detection
Current high (or low) must be the highest (or lowest) over the last Extremum Lookback bars (default: 50).
This ensures the move is significant relative to recent price action.
2. Impulse Confirmation
Price must extend by at least 1 × ATR from the previous swing point.
This filters out minor fluctuations.
3. Exhaustion Conditions (at least 2 out of 3 must be met)
RSI Extreme: RSI > Overbought Level (default: 80) for bearish signals, RSI < Oversold Level (default: 20) for bullish signals.
Volume Spike: Volume > SMA(Volume, Volume SMA Length) × Volume Spike Multiplier.
Candle Wick Rejection: Upper wick ≥ Wick Threshold % for bearish setups, Lower wick ≥ Wick Threshold % for bullish setups.
4. Trend Filter
ADX > ADX Threshold ensures the market is trending and filters out sideways conditions.
5. Candle Body Filter
Candle body must be ≥ Body Size ATR Factor × ATR.
This avoids weak signals from small candles or doji formations.
📈 How to Use
Bearish Signal:
Appears at fresh swing highs with exhaustion conditions met. Useful for tightening stops, taking partial profits, or counter-trend shorts.
Bullish Signal:
Appears at fresh swing lows with exhaustion conditions met. Useful for trailing stops, profit-taking, or counter-trend longs.
Recommended Timeframes: Works best on 1h, 4h, and Daily charts.
Markets: Crypto, Forex, Stocks — wherever volatility and trends are present.
⚙️ Inputs
RSI Length / Overbought / Oversold
Volume SMA Length & Volume Spike Multiplier
Wick Threshold %
Extremum Lookback (bars for highs/lows)
ADX Length & Threshold
Body Size ATR Factor
⚠️ Disclaimer
This script is for educational purposes only and does not constitute financial advice.
Always test thoroughly and apply proper risk management before live trading.
💡 Tip: Combine this tool with your own market context and confluence factors for higher probability setups.

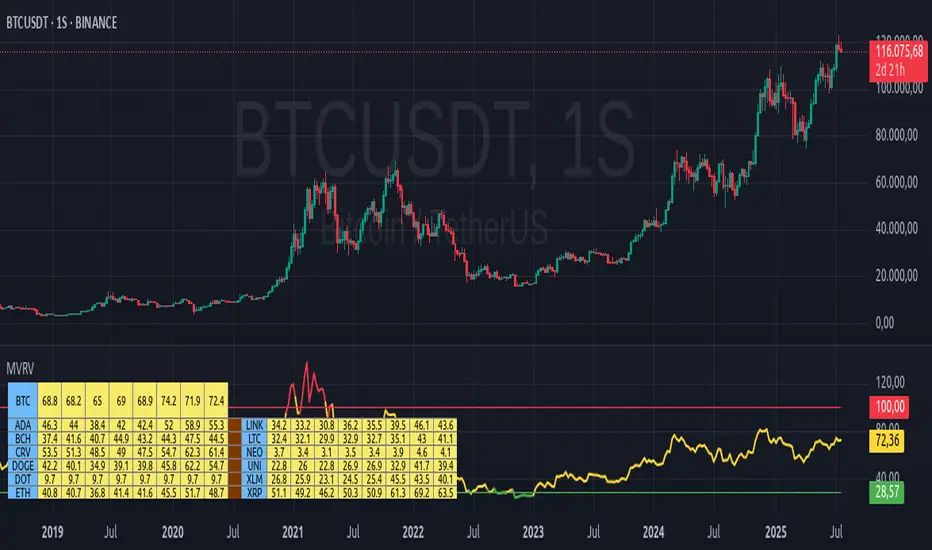
MVRV Altcoins📌 Technical Description of Indicator: MVRV Altcoins
This advanced script calculates the Market Value to Realized Value (MVRV) ratio across multiple cryptocurrencies simultaneously. It offers two analytical modes: Normal and Z-Score, optimized for visual comparison and real-time monitoring of up to 13 predefined assets. If a user applies the indicator to a symbol that is not among the 13 programmed assets, the default behavior displays the Bitcoin chart as a fallback reference.
🔍 What Is MVRV and Why Is It Important?
MVRV is an on-chain metric designed to assess whether a cryptocurrency is overvalued or undervalued by comparing its market capitalization to its realized capitalization.
- Market Cap: The total circulating supply multiplied by the current market price.
- Realized Cap: The sum value of all coins based on the price at the time they last moved on-chain, offering a time-weighted valuation.
Normal Calculation:
MVRV_Normal = Market Cap / Realized Cap
This version reflects investor profitability and identifies potential accumulation or distribution zones.
📊 Z-Score Calculation:
MVRV_ZScore = (Market Cap − Realized Cap) / Standard Deviation of Market Cap
This formula evaluates how extreme the current market conditions are compared to historical norms. It normalizes the difference using statistical dispersion, turning it into a volatility-aware metric that better reflects valuation extremes.
🔎 How Market Cap Is Computed
Unlike conventional indicators relying on consolidated feeds, this script uses modular components from CoinMetrics to construct the active capitalization more accurately, especially for altcoins. Here's the breakdown:
Active Capitalization = MARKETCAPFF + MARKETCAPACTSPLY
Realized Capitalization = MARKETCAPREAL
Component Definitions:
- MARKETCAPFF: Market Cap Free Float — total valuation based only on truly circulating coins.
- MARKETCAPACTSPLY: Capitalization from actively circulating supply — filters dormant or locked coins.
- MARKETCAPREAL: Realized Cap — historical valuation weighted by the last on-chain movement of each coin.
This method offers enhanced precision and compatibility across assets that may lack comprehensive data from centralized providers.
⚙️ User-Configurable Parameters
- MVRV Mode: Choose between Normal and Z-Score.
- Percentage Scale View: If enabled, visual output is scaled using predefined divisors (100 / 3.5 or 100 / 6).
- Thresholds for Analysis:
- Normal mode: Define overbought and oversold levels (default 1.0 and 3.5).
- Z-Score mode: Configure statistical boundaries (default 0.0 and 6.0).
- Table Controls:
- Adjustable position on screen (9 options).
- Font size customization: tiny, small, normal, large.
- Color scheme personalization:
- Header: text and background
- Body: text and background
- Central column separator color
📊 Multicrypto Table Architecture
The indicator renders a high-performance visual table displaying data from up to 13 assets simultaneously. Each asset is represented as a vertical column featuring eigth historical data points plus the most recent value.
- Assets are displayed in two blocks separated by a decorative column.
- Each value is rounded to one decimal place for clarity.
- Cells are styled dynamically based on user settings.
🎨 Decorative Column Separator
Since the entire table is built as a unified structure, a color-configurable empty column is inserted mid-table to act as a visual divider. This approach improves readability and aesthetic balance without duplicating code or splitting table logic.
🔁 Default Behavior on Unsupported Assets
If the active chart is not one of the 13 predefined assets, the indicator will automatically display Bitcoin’s data. This ensures the chart remains functional and informative even outside the target asset group.
🎯 Color Interpretation by Condition
The MVRV value for each asset is highlighted using a traffic light system:
- Green: Undervalued (below oversold threshold)
- Red: Overvalued (above overbought threshold)
- Yellow: Neutral zone
This coding simplifies decision-making and visual scanning across assets.
Final Notes
This indicator is modular and fully adaptable, with well-commented sections designed for efficient customization. Its multiactive architecture makes it a valuable tool for crypto analysts tracking diversified portfolios beyond Bitcoin and Ethereum.
It supports visual storytelling across assets, comparative historical evaluation, and identification of strategic zones — whether for accumulation, distribution, or monitoring on-chain sentiment.
🇰🇷 Kim'in Kim'out — Korean Premium TrackerKim’in Kim’out is a premium-tracking TradingView indicator that reveals Korean market sentiment by comparing real-time asset prices on Upbit (KRW) and Binance (USDT).
It detects when Korean traders are spot accumulating (Kim’in) or spot distributing (Kim’out) — enhanced by volume confirmation and trend context.
Perfect for crypto scalpers, swing traders, and arbitrage hunters.
⚙️ How It Works
Kimchi Premium: Measures how much more (or less) Koreans are paying on Upbit compared to Binance.
Volume Confirmation: Filters signals by comparing Upbit volume vs its moving average.
Signal Logic:
🔼 Kim’in: Premium exceeds the buy threshold + high volume
🔽 Kim’out: Premium drops below the sell threshold + high volume
Trend Context: Premium trend line gives insight into sustained interest/disinterest.
🎛️ Settings Overview
Input Description
Select Cryptocurrency Choose from supported coins (BTC, ETH, SOL, etc.)
Buy Threshold (%) How high the premium must be to trigger a Kim’in signal
Sell Threshold (%) How low the premium must be to trigger a Kim’out signal
Volume MA Period The number of candles for volume average
Volume Multiplier Volume spike ratio needed to confirm a signal
Show Info Table Toggle detailed premium stats in a side panel
Show Premium Zones Visual background zones (green/red/yellow)
Debug Mode Shows extra signals that trigger without volume confirmation
✅ How to Use It
Add the indicator to any chart (e.g. BTC/USDT)
Choose a coin from the dropdown (BTC, ETH, etc.)
Watch for:
Green Triangle Up (Kim’in) = Korean spot buy pressure confirmed
Red Triangle Down (Kim’out) = Korean selloff or disinterest
Use the Info Table (top-right) to see:
Premium %
Volume confirmation
Real-time KRW-USD exchange rate
Upbit vs Binance price comparison
Set Alerts:
Right-click on a signal → Add Alert on "Kim’in" or "Kim’out"
Or use the prebuilt alertconditions
🔔 Alert Messages
🇰🇷 Korean Premium BUY signal detected → Kim’in
🇰🇷 Korean Premium SELL signal detected → Kim’out
🧪 Best Practices
Use on 1H or 4H timeframe for best results
Confirm with broader market structure or confluence tools
Spot divergences between Binance and Upbit to predict regional flow shifts
🚫 Limitations
Works only with coins that have both Binance USDT & Upbit KRW pairs
Premium may be delayed by low liquidity or FX rate fluctuations (USDKRW)
Not suitable for lowcaps not listed on Upbit
Created by UKMC Crypto
