Stability Max OverloadStability Max Overload was created in another script I have been working on found below.
I have broken the code down to only display the Stability features.
What this is:
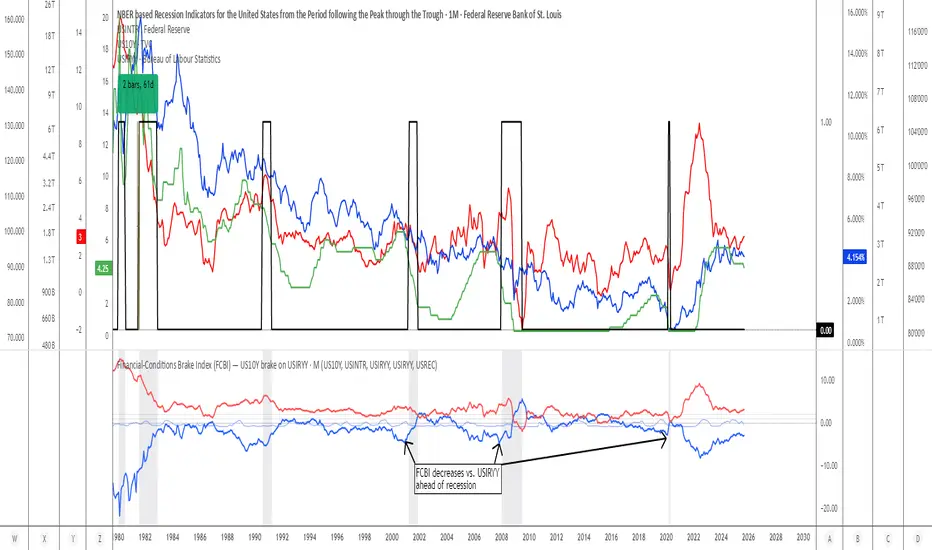
I was trying to find a way that could in some form display the Stability or Instability of the US Treasuries Bond Market. To try and help me do that, I came up with 3 values.
*Stability
*Stability Overload
*Stability Max Overload.
I started with STABILITY. This value is generated based off the number of side by side inversions in the Bond Market. I wanted this value to range between 0 and 1 while 1 equaling all Bonds inverted and 0 equaling no Bonds inverted and any number of inversions in between would equal a percentage value based off the actual number.
STABILITY OVERLOAD was created based off the average of each inversion.
STABILITY MAX OVERLOAD was then created based off the total of each inversion.
The most stable Yield Curve would have no inversions and therefore would generate a 0 for Stability, Stability Overload and Stability Max Overload. The more inversions the Yield Curve has the higher in value Stability itself would have as Stability is weighted more per inversion. With each inversion, data is taken based off the amount with which the Yields are inverted.
This display shows where we currently stand since Dec 2018. It's a telling story so say the least. I do plan on continuing the mentioned above script but again wanted to release a standalone of the data generated.
Hope you enjoy,
OpptionsOnly
Penunjuk Pine Script®