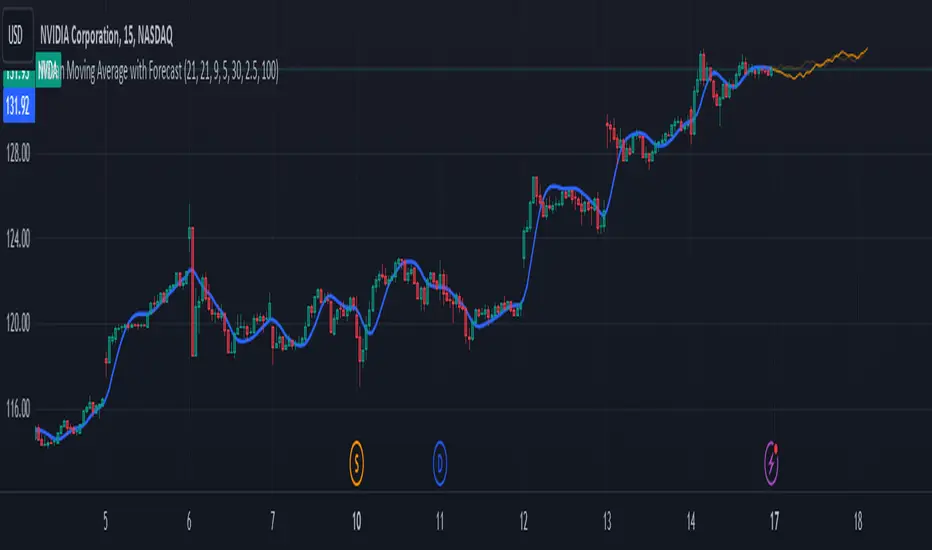
Trend Impulse Channels (Zeiierman)█ Overview
Trend Impulse Channels (Zeiierman) is a precision-engineered trend-following system that visualizes discrete trend progression using volatility-scaled step logic. It replaces traditional slope-based tracking with clearly defined “trend steps,” capturing directional momentum only when price action decisively confirms a shift through an ATR-based trigger.
This tool is ideal for traders who prefer structured, stair-step progression over fluid curves, and value the clarity of momentum-based bands that reveal breakout conviction, pullback retests, and consolidation zones. The channel width adapts automatically to market volatility, while the step logic filters out noise and false flips.
⚪ The Structural Assumption
This indicator is built on a core market structure observation:
After each strong trend impulse, the market typically enters a “cooling-off” phase as profit-taking occurs and counter-trend participants enter. This often results in a shallow pullback or stall, creating a slight negative slope in an uptrend (or a positive slope in a downtrend).
These “cooling-off” phases don’t reverse the trend — they signal temporary pressure before the next leg continues. By tracking trend steps discretely and filtering for this behavior, Trend Impulse Channels helps traders align with the rhythm of impulse → pause → impulse.
█ How It Works
⚪ Step-Based Trend Engine
At the heart of this tool is a dynamic step engine that progresses only when price crosses a predefined ATR-scaled trigger level:
Trigger Threshold (× ATR) – Defines how far price must break beyond the current trend state to register a new trend step.
Step Size (Volatility-Guided) – Each trend continuation moves the trend line in discrete units, scaling with ATR and trend persistence.
Trend Direction State – Maintains a +1/-1 internal bias to support directional filters and step tracking.
⚪ Volatility-Adaptive Channel
Each step is wrapped inside a dynamic envelope scaled to current volatility:
Upper and Lower Bands – Derived from ATR and band multipliers to expand/contract as volatility changes.
⚪ Retest Signal System
Optional signal markers show when price re-tests the upper or lower band:
Upper Retest → Pullback into resistance during a bearish trend.
Lower Retest → Pullback into support during a bullish trend.
⚪ Trend Step Signals
Circular markers can be shown to mark each time the trend steps forward, making it easy to identify structurally significant moments of continuation within a larger trend.
█ How to Use
⚪ Trend Alignment
Use the Trend Line and Step Markers to visually confirm the direction of momentum. If multiple trend steps occur in sequence without reversal, this typically signals strong conviction and trend persistence.
⚪ Retest-Based Entries
Wait for pullbacks into the channel and monitor for triangle retest signals. When used in confluence with trend direction, these offer high-quality continuation setups.
⚪ Breakouts
Look for breakouts beyond the upper or lower band after a longer period of pause. For higher likelihood of success, look for breakouts in the direction of the trend.
█ Settings
Trigger Threshold (× ATR) - Defines how far price must move to register a new trend step. Controls sensitivity to trend flips.
Max Step Size (× ATR) - Caps how far each trend step can extend. Prevents runaway step expansion in high volatility.
Band Multiplier (× ATR) - Expands the upper and lower channels. Controls how much breathing room the bands allow.
Trend Hold (bars) - Minimum number of bars the trend must remain active before allowing a flip. Helps reduce noise.
Filter by Trend - Restrict retest signals to those aligned with the current trend direction.
-----------------
Disclaimer
The content provided in my scripts, indicators, ideas, algorithms, and systems is for educational and informational purposes only. It does not constitute financial advice, investment recommendations, or a solicitation to buy or sell any financial instruments. I will not accept liability for any loss or damage, including without limitation any loss of profit, which may arise directly or indirectly from the use of or reliance on such information.
All investments involve risk, and the past performance of a security, industry, sector, market, financial product, trading strategy, backtest, or individual's trading does not guarantee future results or returns. Investors are fully responsible for any investment decisions they make. Such decisions should be based solely on an evaluation of their financial circumstances, investment objectives, risk tolerance, and liquidity needs.
Cari dalam skrip untuk "curve"
Best EMA FinderThis script, Best EMA Finder, is based on the same original logic as the Best SMA Finder I published previously. Although it was not the initial goal of the project, several users asked for an EMA version, so here it is.
The script scans a wide range of Exponential Moving Average (EMA) lengths, from 10 to 500, and identifies the one that historically delivered the most robust performance on the current chart. The choice to stop at 500 is deliberate: beyond that point, EMA curves tend to flatten and converge, adding processing time without meaningful differences in signals or outcomes.
Each EMA is evaluated using a custom robustness score:
Profit Factor × log(Number of Trades) × sqrt(Win Rate)
Only EMA lengths that exceed a user-defined minimum number of trades are considered valid. Among these, the one with the highest robustness score is selected and displayed on the chart.
A table summarizes the results:
- Best EMA length
- Total number of trades
- Profit Factor
- Win Rate
- Robustness Score
You can adjust:
- Strategy type: Long Only or Buy & Sell
- Minimum number of trades required
- Table visibility
This script is designed for analysis and optimization only. It does not execute trades or handle position sizing. Only one open trade per direction is considered at a time.
StochRSI Context EngineThe StochRSI Context Engine is a premium, logic-driven indicator built to provide comprehensive intraday momentum context using multi-timeframe Stochastic RSI analysis. Rather than issuing direct buy or sell signals, the tool is designed to give traders enhanced clarity on trend posture, overbought/oversold conditions, volatility states, and potential momentum reversals. It combines multiple layers of signal processing to deliver an intelligent overview of market conditions in real time.
What it does:
The indicator performs a multi-timeframe evaluation of the Stochastic RSI, sampling values from four customizable timeframes (default: 5m, 15m, 1h, 4h). These values are blended and processed through a series of analytical engines to provide the following:
1. StochRSI Multi-Timeframe Engine
* Computes a smoothed Stochastic RSI value on each selected timeframe.
* Applies user-defined smoothing (SMA, EMA, RMA, or WMA).
* Aggregates these into an average (sRSIavg) for further analysis.
2. Trend and Volatility Engine
* Uses EMA stacking logic (8, 21, 50) to determine directional alignment.
* Calculates linear regression slope for directional bias.
* Assesses volatility using ATR relative to price.
* Derives a trendScore based on EMA alignment, price position, and slope strength.
3. Bias and Slope Analysis
* Measures fast/slow EMA slope differentials to detect bias direction and strength.
* Computes slope deltas and volatility-weighted stacking to score bias conditions.
* Outputs a classification such as strong bullish, moderate bearish, or neutral.
4. Dynamic OB/OS Zone Detection
* Adapts overbought and oversold thresholds based on volatility and trend regime.
* Adjusts the zone boundaries if in a trending or high-volatility environment.
5. Microzone Proximity Detection
* Tracks whether the average StochRSI is approaching key OB/OS thresholds.
* Flags conditions like “Near Overbought,” “Near Oversold,” or “Mid Range.”
6. Velocity and Acceleration Detection
* Measures how quickly StochRSI values are changing.
* Uses delta calculations to gauge the momentum’s thrust or decay.
* Classifies shifts in RSI movement (e.g., flat, slow, fast, or thrusting).
7. Range Expansion / Compression Engine
* Evaluates whether StochRSI values across timeframes are diverging or compressing.
* Identifies regime changes in momentum coherence.
8. Momentum Scoring System
* Calculates a composite score based on bias, slope strength, volatility, and range.
* Labels momentum phases from dormant to full-throttle.
9. Confluence Detection
* Tallies how many of the 4 timeframes are currently overbought or oversold.
* High confluence increases the probability of valid reversal or continuation zones.
10. Support and Resistance Zone Memory
* Tracks and plots previous areas where StochRSI bounced or rejected near zones.
* Stores and updates these zones over time, acting as momentum-based S/R levels.
* Includes a proximity check to cluster zones that are close in value.
11. Divergence Detection Engine
* Detects classic bullish or bearish divergence between price and the aggregated StochRSI.
* Draws lines to show divergence structure and triggers real-time alerts.
12. Smart Background Highlighting
* Shades the background based on whether current StochRSI is in an overbought, oversold, or
neutral zone.
13. Real-Time Dashboard
* Displays trend, bias, confluence count, velocity, divergence state, momentum score, and
more.
* Dynamically updates and is optimized for top-right screen positioning with compact
formatting.
14. Smart Alerts
* Issues alerts for divergence detection and high-confluence reversal conditions.
15. Real-Time Labels on Curves
* Shows the selected timeframes alongside each plotted StochRSI line to clarify source data.
What it’s based on:
* Stochastic RSI as the core input signal, providing normalized momentum across timeframes.
* EMA stacking logic, adapted from institutional trend-following models.
* Volatility normalization using ATR to adapt thresholds in high vs. low volatility environments.
* Slope forecasting using linear regression to infer directional conviction.
* Bias analysis modeled on a composite of EMA distance, alignment, and directional thrust.
* Support/resistance zone memory derived from repeated interaction with dynamic OB/OS thresholds.
* Divergence logic based on localized price and oscillator peaks/troughs.
* Multi-factor confidence scoring, aggregating up to 6 inputs to rate market clarity.
This script is for educational and informational purposes only. It does not generate trade signals or provide financial advice. It is not intended to be used as a standalone system for trading or investment decisions. Use at your own discretion. Always confirm with your broader strategy and risk management practices.
Combo RSI + MACD + ADX MTF (Avec Alertes)✅ Recommended Title:
Multi-Signal Oscillator: ADX Trend + DI + RSI + MACD (MTF, Cross Alerts)
✅ Detailed Description
📝 Overview
This indicator combines advanced technical analysis tools to identify trend direction, capture reversals, and filter false signals.
It includes:
ADX (Multi-TimeFrame) for trend and trend strength detection.
DI+ / DI- for directional bias.
RSI + ZLSMA for oscillation analysis and divergence detection.
Zero-Lag Normalized MACD for momentum and entry timing.
⚙️ Visual Components
✅ Green/Red Background: Displays overall trend based on Multi-TimeFrame ADX.
✅ DI+ / DI- Lines: Green and red curves showing directional bias.
✅ Normalized RSI: Blue oscillator with orange ZLSMA smoothing.
✅ Zero-Lag MACD: Violet or fuchsia/orange oscillator depending on the version.
✅ Crossover Points: Colored circles marking buy and sell signals.
✅ ADX Strength Dots: Small black dots when ADX exceeds the strength threshold.
🚨 Included Alert System
✅ RSI / ZLSMA Crossovers (Buy / Sell).
✅ MACD / Signal Line Crossovers (Buy / Sell).
✅ DI+ / DI- Crossovers (Buy / Sell).
✅ Double Confirmation DI+ / RSI or DI+ / MACD.
✅ Double Confirmation DI- / RSI or DI- / MACD.
✅ Trend Change Alerts via Background Color.
✅ ADX Strength Alerts (Above Threshold).
🛠️ Suggested Configuration Examples
1. Short-Term Reversal Detection:
RSI Length: 7 to 14
ZLSMA Length: 7 to 14
MACD Fast/Slow: 5 / 13
ADX MTF Period: 5 to 15
ADX Threshold: 15 to 20
2. Long-Term Trend Following:
RSI Length: 21 to 30
ZLSMA Length: 21 to 30
MACD Fast/Slow: 12 / 26
ADX MTF Period: 30 to 50
ADX Threshold: 20 to 25
3. Scalping / Day Trading:
RSI Length: 5 to 9
ZLSMA Length: 5 to 9
MACD Fast/Slow: 3 / 7
ADX MTF Period: 5 to 10
ADX Threshold: 10 to 15
🎯 Why Use This Tool?
Filters false signals using ADX-based background coloring.
Provides multi-source alerting (RSI, MACD, ADX).
Helps identify true market strength zones.
Works on all markets: Forex, Crypto, Stocks, Indices.
MTF Stochastic RSIOverview: MTF Stochastic RSI
is a momentum-tracking tool that plots the Stochastic RSI oscillator for up to four user-
defined timeframes on a single panel. It provides a compact yet powerful view of how
momentum is aligning or diverging across different timeframes, making it suitable for both
scalpers and swing traders looking for multi-timeframe confirmation.
What it does:
Calculates Stochastic RSI values using the RSI of price as the base input and applies
smoothing for stability.
Aggregates and displays the values for four customizable TF (e.g., 5min, 15min, 1h, 4h).
Highlights potential support and resistance zones in the oscillator space using adaptive zone
logic.
Optionally draws dynamic support/resistance zone lines in the oscillator space based on
historical turning points.
How it works:
Each timeframe uses the same RSI and Stoch calculation settings but runs independently via
the request.security() function.
Stochastic RSI is calculated by first applying the RSI to price, then applying a stochastic
formula on the RSI values, and finally smoothing the %K output.
Adaptive overbought and oversold thresholds adjust based on ATR-based volatility and simple
trend filtering (e.g., price vs EMA).
When a crossover above the oversold zone or a crossunder below the overbought zone
occurs, the script checks for proximity to previously stored zones and either adjusts or
records a new one.
These zones are stored and re-plotted as dotted support/resistance levels within the
oscillator space.
What it’s based on:
The indicator builds upon traditional Stochastic RSI by applying it to multiple timeframes in
parallel.
Zone detection logic is inspired by the idea of oscillator-based support/resistance levels.
Volatility-adjusted thresholds are based on ATR (Average True Range) to make the
overbought/oversold zones responsive to market conditions.
How to use it:
Look for alignment across timeframes (e.g., all four curves pushing into the overbought
region suggests strong trend continuation).
Reversal risk increases when one or more higher timeframes are diverging or showing signs of
cooling while lower timeframes are still extended.
Use the zone lines as soft support/resistance references within the oscillator—retests of
these zones can indicate strong reversal opportunities or continuation confirmation.
This script is provided for educational and informational purposes only. It does not constitute financial advice, trading recommendations, or an offer to buy or sell any financial instrument. Always perform your own due diligence, use proper risk management, and consult a qualified financial professional before making any trading decisions. Past performance does not guarantee future results. Use this tool at your own discretion and risk.
Pmax + T3Pmax + T3 is a versatile hybrid trend-momentum indicator that overlays two complementary systems on your price chart:
1. Pmax (EMA & ATR “Risk” Zones)
Calculates two exponential moving averages (Fast EMA & Slow EMA) and plots them to gauge trend direction.
Highlights “risk zones” behind price as a colored background:
Green when Fast EMA > Slow EMA (up-trend)
Red when Fast EMA < Slow EMA (down-trend)
Yellow when EMAs are close (“flat” zone), helping you avoid choppy markets.
You can toggle risk-zone highlighting on/off, plus choose to ignore signals in the yellow (neutral) zone.
2. T3 (Triple-Smoothed EMA Momentum)
Applies three sequential EMA smoothing (the classic “T3” algorithm) to your chosen source (usually close).
Fills the area between successive T3 curves with up/down colors for a clear visual of momentum shifts.
Optional neon-glow styling (outer, mid, inner glows) in customizable widths and transparencies for a striking “cyber” look.
You can highlight T3 movements only when the line is rising (green) or falling (red), or disable movement coloring.
HEMA Trend Levels [AlgoAlpha]OVERVIEW
This script plots two Hull-EMA (HEMA) curves to define a color-coded dynamic trend zone and generate context-aware breakout levels, allowing traders to easily visualize prevailing momentum and identify high-probability breakout retests. The script blends smoothed price tracking with conditional box plotting, delivering both trend-following and mean-reversion signals within one system. It is designed to be simple to read visually while offering nuanced trend shifts and test confirmations.
█ CONCEPTS
The Hull-EMA (HEMA) is a hybrid moving average combining the responsiveness of short EMAs with the smoothness of longer ones. It applies layered smoothing: first by subtracting a full EMA from a half-length EMA (doubling the short EMA's weight), and then by smoothing the result again with the square root of the original length. This process reduces lag while maintaining clarity in direction changes. In this script, two HEMAs—fast and slow—are used to define the trend structure and trigger events when they cross. These crossovers generate "trend shift boxes"—temporary support or resistance zones drawn immediately after trend transitions—to detect price retests in the new direction. When price cleanly retests these levels, the script marks them as confirmations with triangle symbols, helping traders isolate better continuation setups. Color-coded bars further enhance visual interpretation: bullish bars when price is above both HEMAs, bearish when below, and neutral (gray) when indecisive.
█ FEATURES
Bullish and bearish bar coloring based on price and HEMA alignment.
Box plotting at each crossover (bullish or bearish) to create short-term decision zones.
Real-time test detection: price must cleanly test and bounce from box levels to be considered valid.
Multiple alert conditions: crossover alerts, test alerts, and trend continuation alerts.
█ USAGE
Use this indicator on any time frame and asset. Adjust HEMA lengths to match your trading style—shorter lengths for scalping or intraday, longer for swing trading. The shaded area between HEMAs helps visually define the current trend. Watch for crossovers: a bullish crossover plots a green support box just below price, and a bearish one plots a red resistance box just above. These zones act as short-term decision points. When price returns to test a box and confirms with strong rejection (e.g., closes above for bullish or below for bearish), a triangle symbol is plotted. These tests can signal strong trend continuation. For traders looking for clean entries, combining the crossover with a successful retest improves reliability. Alerts can be enabled for all key signals: trend shift, test confirmations, and continuation conditions, making it suitable for automated setups or discretionary traders tracking multiple charts.
[MAD] Self-Optimizing RSIOverview
This script evaluates multiple RSI lengths within a specified range, calculates performance metrics for each, and identifies the top 3 configurations based on a custom scoring system. It then plots the three best RSI curves and optionally displays a summary table and label.
How It Works
The script calculates a custom RSI for each length in the range.
It simulates entering a long position when RSI crosses below the Buy Value and exits when RSI crosses above the Sell Value.
Each trade's return is stored in the relevant StatsContainer.
Metrics Computation
After all bars have been processed,
* Net Profit,
* Sharpe Ratio, and
* Win Rate
are computed for each RSI length.
A weighted score is then derived using the input weights.
Top 3 Identification
The script finds the three RSI lengths with the highest scores.
The RSI lines for these top 3 lengths are plotted in different colors.
If enabled, a table listing the top 3 results (Rank, RSI length, Sharpe, NetPnL, Win Rate) is shown.
If enabled, a label with the highest-scoring RSI length and its score is placed on the final bar.
Usage Tips
Adjust Min RSI Length and Max RSI Length to explore a narrower or wider range of periods.
Be aware, to high settings will slow down the calculation.
Experiment with different RSI Buy Value and RSI Sell Value settings if you prefer more or fewer trade signals.
Confirm that Min Trades Required aligns with the desired confidence level for the computed metrics.
Modify Weight: Sharpe, Weight: NetProfit, and Weight: WinRate to reflect which metrics are most important.
Troubleshooting
If metrics remain - or NaN, confirm enough trades (Min Trades Required) have occurred.
If no top 3 lines appear, it could mean no valid trades were taken in the specified range, or the script lacks sufficient bars to calculate RSI for some lengths. In this case set better buyvalue and sellvalues in the inputs
Disclaimer
Past performance is not indicative of future results specialy as this indicator can repaint based on max candles in memory which are limited by your subscription
MMXM ICT [TradingFinder] Market Maker Model PO3 CHoCH/CSID + FVG🔵 Introduction
The MMXM Smart Money Reversal leverages key metrics such as SMT Divergence, Liquidity Sweep, HTF PD Array, Market Structure Shift (MSS) or (ChoCh), CISD, and Fair Value Gap (FVG) to identify critical turning points in the market. Designed for traders aiming to analyze the behavior of major market participants, this setup pinpoints strategic areas for making informed trading decisions.
The document introduces the MMXM model, a trading strategy that identifies market maker activity to predict price movements. The model operates across five distinct stages: original consolidation, price run, smart money reversal, accumulation/distribution, and completion. This systematic approach allows traders to differentiate between buyside and sellside curves, offering a structured framework for interpreting price action.
Market makers play a pivotal role in facilitating these movements by bridging liquidity gaps. They continuously quote bid (buy) and ask (sell) prices for assets, ensuring smooth trading conditions.
By maintaining liquidity, market makers prevent scenarios where buyers are left without sellers and vice versa, making their activity a cornerstone of the MMXM strategy.
SMT Divergence serves as the first signal of a potential trend reversal, arising from discrepancies between the movements of related assets or indices. This divergence is detected when two or more highly correlated assets or indices move in opposite directions, signaling a likely shift in market trends.
Liquidity Sweep occurs when the market targets liquidity in specific zones through false price movements. This process allows major market participants to execute their orders efficiently by collecting the necessary liquidity to enter or exit positions.
The HTF PD Array refers to premium and discount zones on higher timeframes. These zones highlight price levels where the market is in a premium (ideal for selling) or discount (ideal for buying). These areas are identified based on higher timeframe market behavior and guide traders toward lucrative opportunities.
Market Structure Shift (MSS), also referred to as ChoCh, indicates a change in market structure, often marked by breaking key support or resistance levels. This shift confirms the directional movement of the market, signaling the start of a new trend.
CISD (Change in State of Delivery) reflects a transition in price delivery mechanisms. Typically occurring after MSS, CISD confirms the continuation of price movement in the new direction.
Fair Value Gap (FVG) represents zones where price imbalance exists between buyers and sellers. These gaps often act as price targets for filling, offering traders opportunities for entry or exit.
By combining all these metrics, the Smart Money Reversal provides a comprehensive tool for analyzing market behavior and identifying key trading opportunities. It enables traders to anticipate the actions of major players and align their strategies accordingly.
MMBM :
MMSM :
🔵 How to Use
The Smart Money Reversal operates in two primary states: MMBM (Market Maker Buy Model) and MMSM (Market Maker Sell Model). Each state highlights critical structural changes in market trends, focusing on liquidity behavior and price reactions at key levels to offer precise and effective trading opportunities.
The MMXM model expands on this by identifying five distinct stages of market behavior: original consolidation, price run, smart money reversal, accumulation/distribution, and completion. These stages provide traders with a detailed roadmap for interpreting price action and anticipating market maker activity.
🟣 Market Maker Buy Model
In the MMBM state, the market transitions from a bearish trend to a bullish trend. Initially, SMT Divergence between related assets or indices reveals weaknesses in the bearish trend. Subsequently, a Liquidity Sweep collects liquidity from lower levels through false breakouts.
After this, the price reacts to discount zones identified in the HTF PD Array, where major market participants often execute buy orders. The market confirms the bullish trend with a Market Structure Shift (MSS) and a change in price delivery state (CISD). During this phase, an FVG emerges as a key trading opportunity. Traders can open long positions upon a pullback to this FVG zone, capitalizing on the bullish continuation.
🟣 Market Maker Sell Model
In the MMSM state, the market shifts from a bullish trend to a bearish trend. Here, SMT Divergence highlights weaknesses in the bullish trend. A Liquidity Sweep then gathers liquidity from higher levels.
The price reacts to premium zones identified in the HTF PD Array, where major sellers enter the market and reverse the price direction. A Market Structure Shift (MSS) and a change in delivery state (CISD) confirm the bearish trend. The FVG then acts as a target for the price. Traders can initiate short positions upon a pullback to this FVG zone, profiting from the bearish continuation.
Market makers actively bridge liquidity gaps throughout these stages, quoting continuous bid and ask prices for assets. This ensures that trades are executed seamlessly, even during periods of low market participation, and supports the structured progression of the MMXM model.
The price’s reaction to FVG zones in both states provides traders with opportunities to reduce risk and enhance precision. These pullbacks to FVG zones not only represent optimal entry points but also create avenues for maximizing returns with minimal risk.
🔵 Settings
Higher TimeFrame PD Array : Selects the timeframe for identifying premium/discount arrays on higher timeframes.
PD Array Period : Specifies the number of candles for identifying key swing points.
ATR Coefficient Threshold : Defines the threshold for acceptable volatility based on ATR.
Max Swing Back Method : Choose between analyzing all swings ("All") or a fixed number ("Custom").
Max Swing Back : Sets the maximum number of candles to consider for swing analysis (if "Custom" is selected).
Second Symbol for SMT : Specifies the second asset or index for detecting SMT divergence.
SMT Fractal Periods : Sets the number of candles required to identify SMT fractals.
FVG Validity Period : Defines the validity duration for FVG zones.
MSS Validity Period : Sets the validity duration for MSS zones.
FVG Filter : Activates filtering for FVG zones based on width.
FVG Filter Type : Selects the filtering level from "Very Aggressive" to "Very Defensive."
Mitigation Level FVG : Determines the level within the FVG zone (proximal, 50%, or distal) that price reacts to.
Demand FVG : Enables the display of demand FVG zones.
Supply FVG : Enables the display of supply FVG zones.
Zone Colors : Allows customization of colors for demand and supply FVG zones.
Bottom Line & Label : Enables or disables the SMT divergence line and label from the bottom.
Top Line & Label : Enables or disables the SMT divergence line and label from the top.
Show All HTF Levels : Displays all premium/discount levels on higher timeframes.
High/Low Levels : Activates the display of high/low levels.
Color Options : Customizes the colors for high/low lines and labels.
Show All MSS Levels : Enables display of all MSS zones.
High/Low MSS Levels : Activates the display of high/low MSS levels.
Color Options : Customizes the colors for MSS lines and labels.
🔵 Conclusion
The Smart Money Reversal model represents one of the most advanced tools for technical analysis, enabling traders to identify critical market turning points. By leveraging metrics such as SMT Divergence, Liquidity Sweep, HTF PD Array, MSS, CISD, and FVG, traders can predict future price movements with precision.
The price’s interaction with key zones such as PD Array and FVG, combined with pullbacks to imbalance areas, offers exceptional opportunities with favorable risk-to-reward ratios. This approach empowers traders to analyze the behavior of major market participants and adopt professional strategies for entry and exit.
By employing this analytical framework, traders can reduce errors, make more informed decisions, and capitalize on profitable opportunities. The Smart Money Reversal focuses on liquidity behavior and structural changes, making it an indispensable tool for financial market success.
Wave Smoother [WS]The Wave Smoother is a unique FIR filter built from the interaction of two trigonometric waves. A cosine carrier wave is modulated by a sine wave at half the carrier's period, creating smooth transitions and controlled undershoot. The Phase parameter (0° to 119°) adjusts the modulating wave's phase, affecting both response time and undershoot characteristics. At 30° phase the impulse response starts at 0.5 and exhibits gentle undershoot, providing balanced smoothing. Higher phase values reduce ramp-up time and increase undershoot - this undershoot in the impulse response creates overshooting behavior in the filter's output, which helps reduce lag and speed up the response. The default 70° phase setting provides maximum speed while maintaining stability, though practical settings can range from 30° to 70°. The filter's impulse response consists entirely of smooth curves, ensuring consistent behavior across all settings. This design offers traders flexible control over the smoothing-speed trade-off while maintaining reliable signal generation.
Log Regression OscillatorThe Log Regression Oscillator transforms the logarithmic regression curves into an easy-to-interpret oscillator that displays potential cycle tops/bottoms.
🔶 USAGE
Calculating the logarithmic regression of long-term swings can help show future tops/bottoms. The relationship between previous swing points is calculated and projected further. The calculated levels are directly associated with swing points, which means every swing point will change the calculation. Importantly, all levels will be updated through all bars when a new swing is detected.
The "Log Regression Oscillator" transforms the calculated levels, where the top level is regarded as 100 and the bottom level as 0. The price values are displayed in between and calculated as a ratio between the top and bottom, resulting in a clear view of where the price is situated.
The main picture contains the Logarithmic Regression Alternative on the chart to compare with this published script.
Included are the levels 30 and 70. In the example of Bitcoin, previous cycles showed a similar pattern: the bullish parabolic was halfway when the oscillator passed the 30-level, and the top was very near when passing the 70-level.
🔹 Proactive
A "Proactive" option is included, which ensures immediate calculations of tentative unconfirmed swings.
Instead of waiting 300 bars for confirmation, the "Proactive" mode will display a gray-white dot (not confirmed swing) and add the unconfirmed Swing value to the calculation.
The above example shows that the "Calculated Values" of the potential future top and bottom are adjusted, including the provisional swing.
When the swing is confirmed, the calculations are again adjusted, showing a red dot (confirmed top swing) or a green dot (confirmed bottom swing).
🔹 Dashboard
When less than two swings are available (top/bottom), this will be shown in the dashboard.
The user can lower the "Threshold" value or switch to a lower timeframe.
🔹 Notes
Logarithmic regression is typically used to model situations where growth or decay accelerates rapidly at first and then slows over time, meaning some symbols/tickers will fit better than others.
Since the logarithmic regression depends on swing values, each new value will change the calculation. A well-fitted model could not fit anymore in the future.
Users have to check the validity of swings; for example, if the direction of swings is downwards, then the dataset is not fitted for logarithmic regression.
In the example above, the "Threshold" is lowered. However, the calculated levels are unreliable due to the swings, which do not fit the model well.
Here, the combination of downward bottom swings and price accelerates slower at first and faster recently, resulting in a non-fit for the logarithmic regression model.
Note the price value (white line) is bound to a limit of 150 (upwards) and -150 (down)
In short, logarithmic regression is best used when there are enough tops/bottoms, and all tops are around 100, and all bottoms around 0.
Also, note that this indicator has been developed for a daily (or higher) timeframe chart.
🔶 DETAILS
In mathematics, the dot product or scalar product is an algebraic operation that takes two equal-length sequences of numbers (arrays) and returns a single number, the sum of the products of the corresponding entries of the two sequences of numbers.
The usual way is to loop through both arrays and sum the products.
In this case, the two arrays are transformed into a matrix, wherein in one matrix, a single column is filled with the first array values, and in the second matrix, a single row is filled with the second array values.
After this, the function matrix.mult() returns a new matrix resulting from the product between the matrices m1 and m2.
Then, the matrix.eigenvalues() function transforms this matrix into an array, where the array.sum() function finally returns the sum of the array's elements, which is the dot product.
dot(x, y)=>
if x.size() > 1 and y.size() > 1
m1 = matrix.new()
m2 = matrix.new()
m1.add_col(m1.columns(), y)
m2.add_row(m2.rows (), x)
m1.mult (m2)
.eigenvalues()
.sum()
🔶 SETTINGS
Threshold: Period used for the swing detection, with higher values returning longer-term Swing Levels.
Proactive: Tentative Swings are included with this setting enabled.
Style: Color Settings
Dashboard: Toggle, "Location" and "Text Size"
N-Degree Moment-Based Adaptive Detection🙏🏻 N-Degree Moment-Based Adaptive Detection (NDMBAD) method is a generalization of MBAD since the horizontal line fit passing through the data's mean can be simply treated as zero-degree polynomial regression. We can extend the MBAD logic to higher-degree polynomial regression.
I don't think I need to talk a lot about the thing there; the logic is really the same as in MBAD, just hit the link above and read if you want. The only difference is now we can gather cumulants not only from the horizontal mean fit (degree = 0) but also from higher-order polynomial regression fit, including linear regression (degree = 1).
Why?
Simply because residuals from the 0-degree model don't contain trend information, and while in some cases that's exactly what you need, in other cases, you want to model your trend explicitly. Imagine your underlying process trends in a steady manner, and you want to control the extreme deviations from the process's core. If you're going to use 0-degree, you'll be treating this beautiful steady trend as a residual itself, which "constantly deviates from the process mean." It doesn't make much sense.
How?
First, if you set the length to 0, you will end up with the function incrementally applied to all your data starting from bar_index 0. This can be called the expanding window mode. That's the functionality I include in all my scripts lately (where it makes sense). As I said in the MBAD description, choosing length is a matter of doing business & applied use of my work, but I think I'm open to talk about it.
I don't see much sense in using degree > 1 though (still in research on it). If you have dem curves, you can use Fourier transform -> spectral filtering / harmonic regression (regression with Fourier terms). The job of a degree > 0 is to model the direction in data, and degree 1 gets it done. In mean reversion strategies, it means that you don't wanna put 0-degree polynomial regression (i.e., the mean) on non-stationary trending data in moving window mode because, this way, your residuals will be contaminated with the trend component.
By the way, you can send thanks to @aaron294c , he said like mane MBAD is dope, and it's gonna really complement his work, so I decided to drop NDMBAD now, gonna be more useful since it covers more types of data.
I wanned to call it N-Order Moment Adaptive Detection because it abbreviates to NOMAD, which sounds cool and suits me well, because when I perform as a fire dancer, nomad style is one of my outfits. Burning Man stuff vibe, you know. But the problem is degree and order really mean two different things in the polynomial context, so gotta stay right & precise—that's the priority.
∞
BarRange StrategyHello,
This is a long-only, volatility-based strategy that analyzes the range of the previous bar (high - low).
If the most recent bar’s range exceeds a threshold based on the last X bars, a trade is initiated.
You can customize the lookback period, threshold value, and exit type.
For exits, you can choose to exit after X bars or when the close price exceeds the previous bar’s high.
The strategy is designed for instruments with a long-term upward-sloping curves, such as ES1! or NQ1!. It may not perform well on other instruments.
Commissions are set to $2.50 per side ($5.00 per round trip).
Recommended timeframes are 1h and higher. With adjustments to the lookback period and threshold, it could potentially achieve similar results on lower timeframes as well.
Quick scan for drift🙏🏻
ML based algorading is all about detecting any kind of non-randomness & exploiting it, kinda speculative stuff, not my way, but still...
Drift is one of the patterns that can be exploited, because pure random walks & noise aint got no drift.
This is an efficient method to quickly scan tons of timeseries on the go & detect the ones with drift by simply checking wherther drift < -0.5 or drift > 0.5. The code can be further optimized both in general and for specific needs, but I left it like dat for clarity so you can understand how it works in a minute not in an hour
^^ proving 0.5 and -0.5 are natural limits with no need to optimize anything, we simply put the metric on random noise and see it sits in between -0.5 and 0.5
You can simply take this one and never check anything again if you require numerous live scans on the go. The metric is purely geometrical, no connection to stats, TSA, DSA or whatever. I've tested numerous formulas involving other scaling techniques, drift estimates etc (even made a recursive algo that had a great potential to be written about in a paper, but not this time I gues lol), this one has the highest info gain aka info content.
The timeseries filtered by this lil metric can be further analyzed & modelled with more sophisticated tools.
Live Long and Prosper
P.S.: there's no such thing as polynomial trend/drift, it's alwasy linear, these curves you see are just really long cycles
P.S.: does cheer still work on TV? @admin
[Global Contraction Expansion Index SGM]Script Features
Dynamic Period Choice: The user can adjust the calculation period (period) for relative performance, allowing flexibility according to specific market analysis needs.
Sector Selection: The script takes into account different economic sectors through well-known ETFs like QQQ (technology), XLF (financial), XLY (consumer discretionary), XLV (healthcare), XLI (industrial) and XLE (energy). This diversification helps gain a general overview of economic health across different market segments.
Relative Performance Calculation: For each sector, the script calculates the relative performance using a simple moving average (SMA) of the price change over the specified period. This helps identify price trends adjusted for normal market fluctuations.
GCEI Index: The GCEI Index is calculated as the average of the relative performance of all sectors, multiplied by 100 to express it as a percentage. This provides an overall indicator of sectoral economic performance.
Crossover Signals: The script detects and marks points where the overall index (GCEI) crosses its own exponential moving average (emaGCEI), indicating potential changes in the overall trend of market performance.
Visualization: Results are visualized through graphs, where positive and negative regions are colored differently. Fills between the zero line and the index curves make it easy to see periods of contraction or expansion
When this index diverges from the SP500, it may be a sign that the technology sector is outperforming other sectors.
[SGM Forex Interest Rate]
Through an analysis of the interest rates of selected currencies, this indicator calculates the difference between these rates to provide an indication of the relative strength between the two currencies. This relative strength is graphically represented as an area with a specific color for better visualization.
The curves represent the values of the two selected currencies, while the colored area between them highlights the difference in strength. A horizontal line is also drawn at the zero level to help identify turning points or divergence points.
Interest rates play a crucial role in forex trading for several reasons:
Impact on capital flows: Interest rates affect international capital flows. Investors are attracted to currencies offering higher yields, which can lead to currency appreciation with higher interest rates.
Influence on monetary policy decisions: Central banks often adjust interest rates to achieve macroeconomic goals such as price stability, economic growth, and full employment. Announcements of interest rate changes or hints about the future direction of rates can have a significant impact on the foreign exchange market.
Determination of financing costs: Interest rates affect the financing costs of transactions in the foreign exchange market. Traders often borrow low-interest currencies to purchase higher-yielding currencies, which can lead to large movements in the market.
Economic Indicators: Interest rates are also key economic indicators. Changes in interest rates may reflect overall economic conditions and be interpreted as signs of economic growth or contraction.
Risk and volatility factors: Interest rate differences between two countries can create arbitrage opportunities, but also risks. Unexpected changes in interest rates or market expectations may result in increased volatility in the foreign exchange market.
In sum, interest rates are a fundamental part of the global financial landscape and are therefore crucial for forex traders, as they provide indications of economic trends, capital flows and trading opportunities.
SMA Angular Trends [Yosiet]This indicator uses two specific SMA configurations conditioned by an angular slope that is always repeated in trend markets, which are usually beneficial in swing or long-term strategies.
SETTINGS
- Fast Angle Threshold: Is the value in degrees for the condition of the fast sma
- Slow Angle Threshold: Is the value in degrees for the condition of the slow sma
- Linear Mode: When is active, it shows the sma curves only when the condition is satisfied. When is inactive, it shows color of the trends
HOW TO USE
This indicator it helps to see clearly the trends and the oppotunities to entry/exit in breakouts and retests
WHY THOSE SMAs
The SMAs are sma(7, low) and sma(30, high), those setups came from analyze several others indicators with machine learning searching for convergence points in 2018.
THOUGHTS
This indicator only pretends to help traders to take decissions with extra data confirmation
IMPROVEMENTS
You can comment your ideas and sugestions to improve this indicator
Signal Filter / Connectable [Azullian]The connectable signal filter is an intricate part of an indicator system designed to help test, visualize and build strategy configurations without coding. Like all connectable indicators , it interacts through the TradingView input source, which serves as a signal connector to link indicators to each other. All connectable indicators send signal weight to the next node in the system until it reaches either a connectable signal monitor, signal filter and/or strategy.
The connectable signal filter's function has several roles in the connectable system:
• Input hub: Connect indicators or daisy-chained indicators directly to the filter, manage connections in one place
• Modification: Modify incoming signals by applying smoothing, scaling, or modifiers
• Filtering: Set the trade direction and conditions a signal must adhere to to be passed through
• Visualization: When connected, the signal filter visualizes all incoming signal weights
Let's review the separate parts of this indicator.
█ INPUTS
We've provided 3 inputs for connecting indicators or chains (1→, 2→, 3→) which are all set to 'Close' by default.
An input has several controls:
• Enable disable: Toggle the entire input on or off
• Input: Connect indicators here, choose indicators with a compatible : Signal connector.
• G - Gain: Increase or reduce the strength of the incoming signal by a factor.
█ FILTER SIGNALS
The core of the signal filter , determine a signal direction with the signal mode and determine a threshold (TH).
• ¤ - Trade direction:
○ EL: Send Enter Long signals to the strategy
○ XL: Send Exit Long signals to the strategy
○ ES: Send Enter Short signals to the strategy
○ XS: Send Exit Short signals to the strategy
• TH - Threshold: Define how much weight is needed for a signal to be accepted and passed through to the connectable strategy .
■ VISUALS
• ☼: Brightness % : Set the opacity for the signal curves
• 🡓: ES Color : Set the color for the ES: Entry Short signal
• ⭳: XS Color : Set the color for the XS: Exit Short signal
• ⌥: Plot mode : Set the plotting mode
○ Signals IN: Show all signals
○ Signals OUT: Show only scoring signals
• 🡑: EL Color : Set the color for the EL: Enter Long signal
• ⭱: XL Color : Set the color for the XL: Exit Long signal
█ USAGE OF CONNECTABLE INDICATORS
■ Connectable chaining mechanism
Connectable indicators can be connected directly to the signal monitor, signal filter or strategy , or they can be daisy chained to each other while the last indicator in the chain connects to the signal monitor, signal filter or strategy. When using a signal filter you can chain the filter to the strategy input to make your chain complete.
• Direct chaining: Connect an indicator directly to the signal monitor, signal filter or strategy through the provided inputs (→).
• Daisy chaining: Connect indicators using the indicator input (→). The first in a daisy chain should have a flow (⌥) set to 'Indicator only'. Subsequent indicators use 'Both' to pass the previous weight. The final indicator connects to the signal monitor, signal filter, or strategy.
■ Set up the signal filter with a connectable indicator and strategy
Let's connect the MACD to a connectable signal filter and a strategy :
1. Load all relevant indicators
• Load MACD / Connectable
• Load Signal filter / Connectable
• Load Strategy / Connectable
2. Signal Filter: Connect the MACD to the Signal Filter
• Open the signal filter settings
• Choose one of the three input dropdowns (1→, 2→, 3→) and choose : MACD / Connectable: Signal Connector
• Toggle the enable box before the connected input to enable the incoming signal
3. Signal Filter: Update the filter settings if needed
• The default filter mode for the trading direction is SWING, and is compatible with the default settings in the strategy and indicators.
4. Signal Filter: Update the weight threshold settings if needed
• All connectable indicators load by default with a score of 6 for each direction (EL, XL, ES, XS)
• By default, weight threshold (TH) in the signal filter is set at 5. This allows each occurrence to score, as the default score in each / Connectable indicator is 6 and thus is 1 point above the threshold. Adjust to your liking.
5. Strategy: Connect the strategy to the signal filter in the strategy settings
• Select a strategy input → and select the Signal filter: Signal connector
6. Strategy: Enable filter compatible directions
• As the default setting of the signal filter has enabled EL (Enter Long), XL (Exit Long), ES (Enter Short) and XS (Exit short), the connectable strategy will receive all compatible directions.
Now that everything is connected, you'll notice green spikes in the signal filter representing long signals, and red spikes indicating short signals. Trades will also appear on the chart, complemented by a performance overview. Your journey is just beginning: delve into different scoring mechanisms, merge diverse connectable indicators, and craft unique chains. Instantly test your results and discover the potential of your configurations. Dive deep and enjoy the process!
█ BENEFITS
• Adaptable Modular Design: Arrange indicators in diverse structures via direct or daisy chaining, allowing tailored configurations to align with your analysis approach.
• Streamlined Backtesting: Simplify the iterative process of testing and adjusting combinations, facilitating a smoother exploration of potential setups.
• Intuitive Interface: Navigate TradingView with added ease. Integrate desired indicators, adjust settings, and establish alerts without delving into complex code.
• Signal Weight Precision: Leverage granular weight allocation among signals, offering a deeper layer of customization in strategy formulation.
• Advanced Signal Filtering: Define entry and exit conditions with more clarity, granting an added layer of strategy precision.
• Clear Visual Feedback: Distinct visual signals and cues enhance the readability of charts, promoting informed decision-making.
• Standardized Defaults: Indicators are equipped with universally recognized preset settings, ensuring consistency in initial setups across different types like momentum or volatility.
• Reliability: Our indicators are meticulously developed to prevent repainting. We strictly adhere to TradingView's coding conventions, ensuring our code is both performant and clean.
█ COMPATIBLE INDICATORS
Each indicator that incorporates our open-source 'azLibConnector' library and adheres to our conventions can be effortlessly integrated and used as detailed above.
For clarity and recognition within the TradingView platform, we append the suffix ' / Connectable' to every compatible indicator.
█ COMMON MISTAKES, CLARIFICATIONS AND TIPS
• Removing an indicator from a chain: Deleting a linked indicator and confirming the "remove study tree" alert will also remove all underlying indicators in the object tree. Before removing one, disconnect the adjacent indicators and move it to the object stack's bottom.
• Point systems: The azLibConnector provides 500 points for each direction (EL: Enter long, XL: Exit long, ES: Enter short, XS: Exit short) Remember this cap when devising a point structure.
• Flow misconfiguration: In daisy chains the first indicator should always have a flow (⌥) setting of 'indicator only' while other indicator should have a flow (⌥) setting of 'both'.
• Hide attributes: As connectable indicators send through quite some information you'll notice all the arguments are taking up some screenwidth and cause some visual clutter. You can disable arguments in Chart Settings / Status line.
• Layout and abbreviations: To maintain a consistent structure, we use abbreviations for each input. While this may initially seem complex, you'll quickly become familiar with them. Each abbreviation is also explained in the inline tooltips.
• Inputs: Connecting a connectable indicator directly to the strategy delivers the raw signal without a weight threshold, meaning every signal will trigger a trade.
█ A NOTE OF GRATITUDE
Through years of exploring TradingView and Pine Script, we've drawn immense inspiration from the community's knowledge and innovation. Thank you for being a constant source of motivation and insight.
█ RISK DISCLAIMER
Azullian's content, tools, scripts, articles, and educational offerings are presented purely for educational and informational uses. Please be aware that past performance should not be considered a predictor of future results.
Signal Monitor / Connectable [Azullian]The connectable signal monitor is a connectable tool to help test, visualize signal weights. Like all connectable indicators , it interacts through the TradingView input source, which serves as a signal connector to link indicators to each other. All connectable indicators send signal weight to the next node in the system until it reaches either a connectable signal monitor, signal filter and/or strategy.
Let's review the separate parts of this indicator.
█ INPUTS
We've provided 3 inputs for connecting indicators or chains (1→, 2→, 3→) which are all set to 'Close' by default.
An input has several controls:
• Enable disable: Toggle the entire input on or off
• Input: Connect indicators here, choose indicators with a compatible : Signal connector.
■ VISUALS
• ☼: Brightness % : Set the opacity for the signal curves
• 🡓: ES Color : Set the color for the ES: Entry Short signal
• ⭳: XS Color : Set the color for the XS: Exit Short signal
• ⌥: Plot mode : Set the plotting mode
○ Signals IN: Show all signals
○ Signals OUT: Show only scoring signals
• 🡑: EL Color : Set the color for the EL: Enter Long signal
• ⭱: XL Color : Set the color for the XL: Exit Long signal
█ USAGE OF CONNECTABLE INDICATORS
■ Connectable chaining mechanism
Connectable indicators can be connected directly to the signal monitor, signal filter or strategy , or they can be daisy chained to each other while the last indicator in the chain connects to the connectable signal monitor, signal filter or strategy . When using a signal filter or signal monitor you can chain the filter to the strategy input to make your chain complete.
• Direct chaining: Connect an indicator directly to the signal monitor, signal filter or strategy through the provided inputs (→).
• Daisy chaining: Connect indicators using the indicator input (→). The first in a daisy chain should have a flow (⌥) set to 'Indicator only'. Subsequent indicators use 'Both' to pass the previous weight. The final indicator connects to the signal monitor, signal filter, or strategy.
■ Set up the signal monitor with a connectable indicator and strategy
Let's connect the MACD to a connectable signal monitor :
1. Load all relevant indicators
• Load MACD / Connectable
• Load Signal monitor / Connectable
2. Signal Monitor: Connect the MACD to the Signal Monitor
• Open the signal monitor settings
• Choose one of the three input dropdowns (1→, 2→, 3→) and choose : MACD / Connectable: Signal Connector
• Toggle the enable box before the connected input to enable the incoming signal
Now that everything is connected, you'll notice green spikes in the signal monitor representing long signals, and red spikes indicating short signals.
█ BENEFITS
• Adaptable Modular Design: Arrange indicators in diverse structures via direct or daisy chaining, allowing tailored configurations to align with your analysis approach.
• Streamlined Backtesting: Simplify the iterative process of testing and adjusting combinations, facilitating a smoother exploration of potential setups.
• Intuitive Interface: Navigate TradingView with added ease. Integrate desired indicators, adjust settings, and establish alerts without delving into complex code.
• Signal Weight Precision: Leverage granular weight allocation among signals, offering a deeper layer of customization in strategy formulation.
• Advanced Signal Filtering: Define entry and exit conditions with more clarity, granting an added layer of strategy precision.
• Clear Visual Feedback: Distinct visual signals and cues enhance the readability of charts, promoting informed decision-making.
• Standardized Defaults: Indicators are equipped with universally recognized preset settings, ensuring consistency in initial setups across different types like momentum or volatility.
• Reliability: Our indicators are meticulously developed to prevent repainting. We strictly adhere to TradingView's coding conventions, ensuring our code is both performant and clean.
█ COMPATIBLE INDICATORS
Each indicator that incorporates our open-source 'azLibConnector' library and adheres to our conventions can be effortlessly integrated and used as detailed above.
For clarity and recognition within the TradingView platform, we append the suffix ' / Connectable' to every compatible indicator.
█ COMMON MISTAKES, CLARIFICATIONS AND TIPS
• Removing an indicator from a chain: Deleting a linked indicator and confirming the "remove study tree" alert will also remove all underlying indicators in the object tree. Before removing one, disconnect the adjacent indicators and move it to the object stack's bottom.
• Point systems: The azLibConnector provides 500 points for each direction (EL: Enter long, XL: Exit long, ES: Enter short, XS: Exit short) Remember this cap when devising a point structure.
• Flow misconfiguration: In daisy chains the first indicator should always have a flow (⌥) setting of 'indicator only' while other indicator should have a flow (⌥) setting of 'both'.
• Hide attributes: As connectable indicators send through quite some information you'll notice all the arguments are taking up some screenwidth and cause some visual clutter. You can disable arguments in Chart Settings / Status line.
• Layout and abbreviations: To maintain a consistent structure, we use abbreviations for each input. While this may initially seem complex, you'll quickly become familiar with them. Each abbreviation is also explained in the inline tooltips.
• Inputs: Connecting a connectable indicator directly to the strategy delivers the raw signal without a weight threshold, meaning every signal will trigger a trade.
█ A NOTE OF GRATITUDE
Through years of exploring TradingView and Pine Script, we've drawn immense inspiration from the community's knowledge and innovation. Thank you for being a constant source of motivation and insight.
█ RISK DISCLAIMER
Azullian's content, tools, scripts, articles, and educational offerings are presented purely for educational and informational uses. Please be aware that past performance should not be considered a predictor of future results.
Bitcoin's Logarithmic ChannelLogarithmic growth is a reasonable way to describe the long term growth of bitcoin's market value: for a network that is experiencing growing adoption and is powered by an asset with a finite and disinflationary supply, it’s natural to expect a more explosive growth of its market capitalization early on, followed by diminishing returns as the network and the asset mature.
I used publicly available data to model the market capitalization of bitcoin, deriving thereform a set of three curves forming a logarithmic growth channel for the market capitalization of bitcoin. Using the time series for the circulating supply, we derive a logarithmic growth channel for the bitcoin price.
Model uses publicly available data from July 17, 2010 to December 31, 2022. Everything since the beginning of 2023 is a prediction.
Past performance is not a guarantee of future results.
Supertrend Targets [ChartPrime]The Supertrend Targets indicator combines the concepts of trend-following with dynamic volatility-based target levels. It takes core simple and classical concepts and provides actionable insights. The core of this indicator revolves around the "Supertrend" algorithm, which essentially uses the Average True Range (ATR) and a multiplier to determine if the price of a financial instrument is in an uptrend or downtrend. The indicator generates various plot points on the trading chart, which traders can use to make informed trading decisions.
Users can set several input parameters such as the source price, custom levels, multiplier scale, length of the average true range, and the window length. Traders can also opt to enable a table that shows numeric target data by percentiles, risk ratio, take profit and stop loss points.
The generated plots and fills on the chart represent various levels of potential gains and drawdowns, acting as potential targets for taking profit or stopping losses. These include the 25th, 50th, 75th, 90th, and 100th percentiles, which are adjustable by scale. There are also plots for average gain and drawdown levels, enhanced by standard deviation curves if enabled.
The Supertrend line indicators are color-coded for ease of understanding: blue for bullish performance and orange for bearish performance. The "Center Line" represents the point at which traders might consider entering a position.
Lastly, the script presents a summary table (when enabled) at the right side of the chart displaying numeric data of the plotted targets. This data provides additional insights on the risk-reward balance for each percentile, helping traders to execute their strategies more effectively.
Here's a comprehensive breakdown of its functionalities and features:
Inputs:
Source: Determines the price series type (e.g., Close, Open, High, Low, etc.).
Show Trailing Stop: Option to display the trailing stop on the chart.
Levels: Sets the number of target levels you want to display. Can range from -5 to 5.
Scale: A scaling factor for adjusting targets, can be between 1 to 100.
Window Length: Length for the target computation, determines how many bars will be considered.
Unique: Ensures every data point used in calculations is unique.
Multiplier: Multiplier for the ATR (Average True Range) to compute the SuperTrend.
ATR Length: Period for the ATR computation.
Custom Level: Allows users to set their own levels using various statistics like Average, Average + STDEV, Percentile, or can be disabled.
Percent Rank: Determines the percentile rank for targeting.
Enable Table: Enables or disables a table display.
Methods:
Flag: Identifies bullish and bearish trend reversals.
Target Percent: Determines the expected price movement (both gains and drawdowns) based on historical trend reversals.
Value Percent: Computes the percentage difference between the current price and the entry price during trend reversals.
Plots:
Multiple target lines are plotted on the chart to visualize potential gain and drawdown levels. These levels are adjusted based on user settings. Additionally, the main Supertrend line is plotted to indicate the prevailing trend direction.
Gain Levels: Target levels which show potential upside from the current price.
Drawdown Levels: Target levels which represent potential downside from the current price.
SuperTrend Line: A line that adjusts based on price volatility and trend direction, acting as a dynamic support or resistance.
In conclusion, the "Supertrend Targets " indicator is a powerful tool that combines the principle of trend-following with dynamic targets, providing traders with insights into potential future price movements. The range of customization options allows traders to adapt the indicator to different trading strategies and market conditions.
[blackcat] L1 Dynamic Volatility IndicatorThe volatility indicator (Volatility) is used to measure the magnitude and instability of price changes in financial markets or a specific asset. This thing is usually used to assess how risky the market is. The higher the volatility, the greater the fluctuation in asset prices, but brother, the risk is also relatively high! Here are some related terms and explanations:
- Historical Volatility: The actual volatility of asset prices over a certain period of time in the past. This thing is measured by calculating historical data.
- Implied Volatility: The volatility inferred from option market prices, used to measure market expectations for future price fluctuations.
- VIX Index (Volatility Index): Often referred to as the "fear index," it predicts the volatility of the US stock market within 30 days in advance. This is one of the most famous volatility indicators in global financial markets.
Volatility indicators are very important for investors and traders because they can help them understand how unstable and risky the market is, thereby making wiser investment decisions.
Today I want to introduce a volatility indicator that I have privately held for many years. It can use colors to judge sharp rises and falls! Of course, if you are smart enough, you can also predict some potential sharp rises and falls by looking at the trend!
In the financial field, volatility indicators measure the magnitude and instability of price changes in different assets. They are usually used to assess the level of market risk. The higher the volatility, the greater the fluctuation in asset prices and therefore higher risk. Historical Volatility refers to the actual volatility of asset prices over a certain period of time in the past, which can be measured by calculating historical data; while Implied Volatility is derived from option market prices and used to measure market expectations for future price fluctuations. In addition, VIX Index is commonly known as "fear index" and is used to predict volatility in the US stock market within 30 days. It is one of the most famous volatility indicators in global financial markets.
Volatility indicators are very important for investors and traders because they help them understand market uncertainty and risk, enabling them to make wiser investment decisions. The L1 Dynamic Volatility Indicator that I am introducing today is an indicator that measures volatility and can also judge sharp rises and falls through colors!
This indicator combines two technical indicators: Dynamic Volatility (DV) and ATR (Average True Range), displaying warnings about sharp rises or falls through color coding. DV has a slow but relatively smooth response, while ATR has a fast but more oscillating response. By utilizing their complementary characteristics, it is possible to construct a structure similar to MACD's fast-slow line structure. Of course, in order to achieve fast-slow lines for DV and ATR, first we need to unify their coordinate axes by normalizing them. Then whenever ATR's yellow line exceeds DV's purple line with both curves rapidly breaking through the threshold of 0.2, sharp rises or falls are imminent.
However, it is important to note that relying solely on the height and direction of these two lines is not enough to determine the direction of sharp rises or falls! Because they only judge the trend of volatility and cannot determine bull or bear markets! But it's okay, I have already considered this issue early on and added a magical gradient color band. When the color band gradually turns warm, it indicates a sharp rise; conversely, when the color band tends towards cool colors, it indicates a sharp fall! Of course, you won't see the color band in sideways consolidation areas, which avoids your involvement in unnecessary trades that would only waste your funds! This indicator is really practical and with it you can better assess market risks and opportunities!
EMA curvesPlot EMAs for lengths 9, 21, 55 ,100, 200
An exponential moving average (EMA) is a type of moving average (MA) that places a greater weight and significance on the most recent data points. The exponential moving average is also referred to as the exponentially weighted moving average. An exponentially weighted moving average reacts more significantly to recent price changes than a simple moving average simple moving average (SMA), which applies an equal weight to all observations in the period.