OPEN-SOURCE SCRIPT
Telah dikemas kini {Gunzo} Trend Sniper (WMA with coefficient)
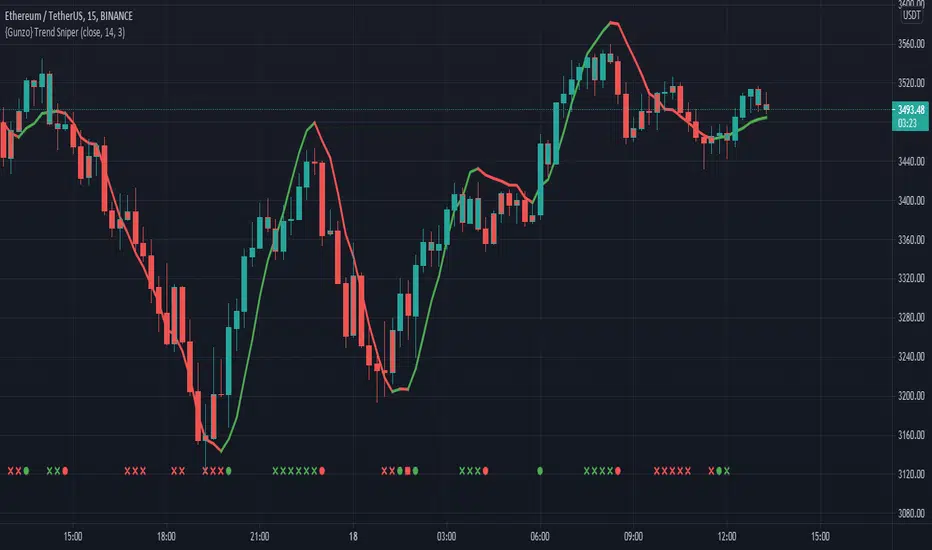
Trend Sniper is a trend-following indicator that sticks closer to the trend than others moving averages as it is using an upgraded weighted moving average implementation.
OVERVIEW :
It is typical to use a moving average indicator (SMA, EMA, WMA or TMA) to identify the trend of an asset. Standard moving averages indicators smooth the price and doesn’t stick very closely to the actual price, showing potential lagging information.
CALCULATION :
In order to have a trendline that sticks to the price, we are going to use a weighted moving average as it puts more weight on recent candles and less on past candles. The weight is usually calculated using the distance from current candle to the other candles used in the calculation. We have the following formula for the standard calculation as implemented in TradingView :
WMA_standard = (Price1 * Weight1 + …… + PriceN * WeightN)) / (Weight1 + …… + WeightN)
This “Trend Sniper” indicator uses an additional coefficient to alter even more the weight of each candle.
WMA_with_coefficient = (Price1 * (Weight1 - Coefficient) + …… + PriceN * (WeightN - Coefficient)) / ((Weight1 - Coefficient) + …… + (WeightN - Coefficient))
SETTINGS :
VISUALIZATIONS :
This indicator has 3 possible visualizations :
USAGE :
This indicator can help analyze the trend directional changes :
OVERVIEW :
It is typical to use a moving average indicator (SMA, EMA, WMA or TMA) to identify the trend of an asset. Standard moving averages indicators smooth the price and doesn’t stick very closely to the actual price, showing potential lagging information.
CALCULATION :
In order to have a trendline that sticks to the price, we are going to use a weighted moving average as it puts more weight on recent candles and less on past candles. The weight is usually calculated using the distance from current candle to the other candles used in the calculation. We have the following formula for the standard calculation as implemented in TradingView :
WMA_standard = (Price1 * Weight1 + …… + PriceN * WeightN)) / (Weight1 + …… + WeightN)
This “Trend Sniper” indicator uses an additional coefficient to alter even more the weight of each candle.
WMA_with_coefficient = (Price1 * (Weight1 - Coefficient) + …… + PriceN * (WeightN - Coefficient)) / ((Weight1 - Coefficient) + …… + (WeightN - Coefficient))
SETTINGS :
- MA source : Source used for moving average calculation (ex : “close”)
- MA length : Length of the moving average. Higher values will give a smoother line, lower values will give a more reactive line.
- Use extra smoothing : Enable/disable usage of a EMA to extra smooth the line curve. If activated the indicator may be lagging, but it will also avoid many false buy/sell signals.
- MA extra smoothing length : Length of the moving average of the extra smoothing.
- Change candle colors : Enable/disable painting the candles of the chart with the colors of the weighted moving average.
- Display buy/sell signals : Display buy/sell signals (circles) when the moving average is changing direction
VISUALIZATIONS :
This indicator has 3 possible visualizations :
- Moving Average line : the line represents the weighted moving average that is following the price of the asset, when the line goes up we are in a uptrend (green line) when the line goes down we are in a downtrend (red line).
- Candle coloring : the color of the moving average line can be applied to the candles of the chart for better readability.
- Signals : Buy/Sell signals can be displayed at the bottom of the chart
USAGE :
This indicator can help analyze the trend directional changes :
- First of all, if the moving average line is under the price (or above the price), then we can assume that the uptrend is strong (or downtrend is strong).
- If the current candle crosses the moving average line, it is the first sign that the trend is weakening and possibly starting to revert.
- If the weighted moving average is changing direction, then the trend change is confirmed and the color of the line changes
Nota Keluaran
Added alerts for trend direction change.Added signals and alerts for trend weakening
Skrip sumber terbuka
Dalam semangat sebenar TradingView, pencipta skrip ini telah menjadikannya sumber terbuka supaya pedagang dapat menilai dan mengesahkan kefungsiannya. Terima kasih kepada penulis! Walaupun anda boleh menggunakannya secara percuma, ingat bahawa menerbitkan semula kod ini adalah tertakluk kepada Peraturan Dalaman kami.
Penafian
Maklumat dan penerbitan adalah tidak dimaksudkan untuk menjadi, dan tidak membentuk, nasihat untuk kewangan, pelaburan, perdagangan dan jenis-jenis lain atau cadangan yang dibekalkan atau disahkan oleh TradingView. Baca dengan lebih lanjut di Terma Penggunaan.