SFL Levels - levels that matterThis is an indicator that gives you an easy way to display the following significant levels on a chart:
- The daily open
- The weekly open
- The monthly open
- Yesterday's high and low price
- Last week's high and low price
These levels often function as natural support and resistance and because of that, it's relevant to have them on your charts.
Every type of level can be enabled or disabled, allowing you to easily customize for the levels you want to see.
The colours and line types can also be changed as you wish.
Cari dalam skrip untuk "daily"

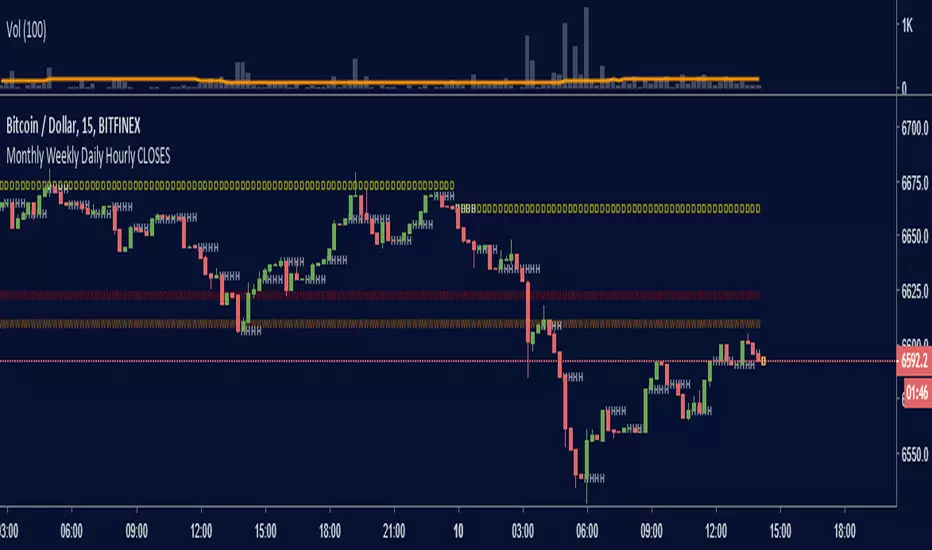
Monthly Weekly Daily Hourly CLOSESDraws horizontal segments where the last Monthly, Weekly, Daily and Hourly closes are.
Easily identify current price relative position to these key prices.
I use it as a kind of pivot points and help me with trend following entries: longs if up from last close, shorts if down from last close.
Monthly: red line (MMMMM)
Weekly: orange line (WWWWW)
Daily: yellow line (DDDDD)
Hourly: white line (HHHHH)
//Original idea from "Key Levels
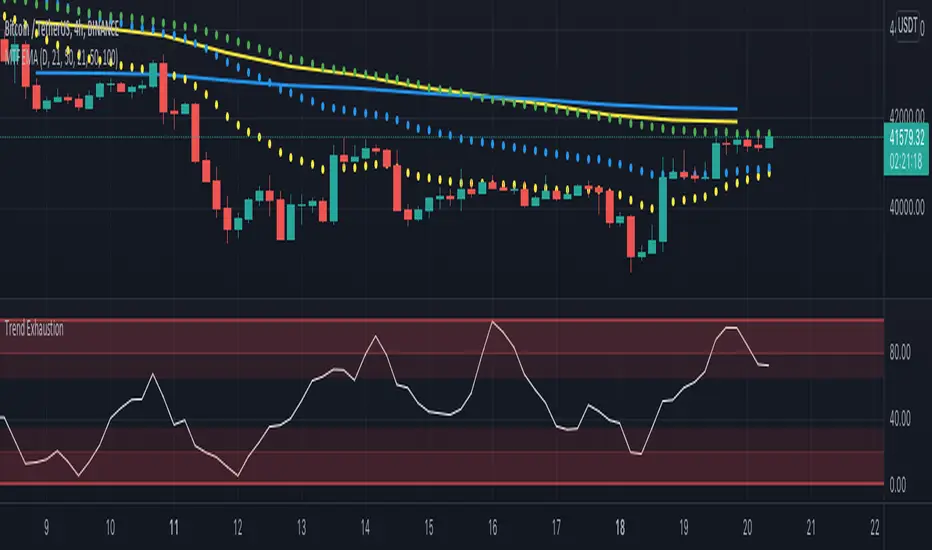
Trend + Momentum Zones — Early Signals on the DailyWhy?
Spot potential reversals 1–2 candles early on the daily chart with clear red/green zones that keep decision-making simple.
What you get
Crystal-clear sell zones: Overheated areas highlighted in a red band at a glance.
Defined buy zones: Deep pullbacks flagged in a green band with early warnings.
Trend-aware logic: Aligns with market regime to reduce false signals.
Whipsaw filter: Dampens noise on choppy days.
Alert-ready: Plug-and-play BUY/SELL markers for easy alerts.
Flexible thresholds: Adjust bands to match volatility and your style.
How to use
Primary timeframe: Daily (3D/1W also supported if you prefer).
Reading:
Green band = potential accumulation.
Red band = potential profit-taking.
Best practice: wait for band exit + trend confirmation for higher conviction.
Who is it for?
Swing & position traders
Crypto / majors / index futures watchers
Anyone who wants zones, not clutter
Important
This is not a standalone system. Use with risk management, multi-timeframe context, and key S/R levels.
Quick start
Add to chart → set Daily.
Tune upper/lower bands to market volatility.
Enable alerts on BUY/SELL markers and follow your plan.
Tags: #trend #momentum #zones #daily #swing #riskmanagement #crypto #forex #indices

Multi TF High/Low/Open/Close LineNOTE: I'm not sure why the screengrab isn't showing the lines. They are there, and when I share the chart from this link they are there.... idk
This is a requested spin-off version of my previous HLOC for the Daily/Weekly/Monthly that allows users to choose 3 different timeframe units (Mins, Hours, Days, etc...) from the dropdown menu and then select the lookback period in which to draw the HLOC.
I've had quite a few requests to allow users to see multiple lookbacks for the same timeframe unit, mostly weekly, and I did not wish to change that particular script for that purpose. However, I was able to take the existing script and alter it for user input.
This indicator draws a line on the TF 1, TF 2, and TF 3 bar at the High, Low, Open and Close of user input Timeframe unit and selected lookback period.
The lookback period will go back the number of candles entered. So for example if you choose a 5 Min chart with a lookback of 3, the lines will be drawn on the HLOC 3 closed 5 min candles back. Selecting 0 will show data on the current Real-Time candle.
An example of a request I have gotten was for last week, the previous week and the previous month. The settings for that would be: TF 1 - 1 week Lookback 1, TF 2 - 1 week Lookback 2, TF 3 - 1 month Lookback 1.
Each set of lines has an optional identifying label with its own color set that can be shown with or without price value, and has drop down menus for size and style of each set of labels. The TF unit value is displayed on the label, but not the lookback.
So if you are using the hourly on all 3 TF's with different lookback periods, they will all say "60" on the label.
I recommend using the line and label options to distinguish between the different lookback values.
Each set of lines has inputs for line/text color, line width and style and each line argument can be selected independently.
In the chart example I have displayed only the High and Low on three 1 hour TF's with the lookback of 4, 5 and 6 candles with the labels descending in size. With this data I can see that over the last 6 hours the price of ES is in an descending pattern and I should be on alert for a break.
Since I trade ES in RTH on a much lower timeframe, this data can alert me to a bigger picture potential trend change or continuation. I would personally use this with pivot data for timing and look for entries in areas of high volume that moved price to a new
high or low that have not been retested.
I will be looking to add a user input offset for labels in the future. I have had bad luck with it in the past working for a couple weeks and then throwing an error, but I will look into it again soon.
I also recommend going into Chart Settings/Status Line and turning off indicator arguments OR moving the script to the top of the indicator list to avoid obstructed chart view with this indicators arguments. When script allows, I will update it to hide them.

Multi Timeframe EMA by DigitaldYou can use this indicator to show the Daily-EMAs beside the EMAs of the current timeframe.
Everything can be adjusted
Cheers
[MF] Auto Fibonacci LevelsDescription:
Automatically draw Fibonacci Pivot levels based on the previous (day's, week's or month's)
Range ( High-Low ). The HLC3 is used as the default Pivot level.
Unlike the "Auto Fibonacci Levels", this variation does not update
Levels on current day even if the price goes past the R3/S3 levels.
Timeframes: 1D, 1W, 1M
Range = (High - Low) - From previous Day, Week or month.
FIB LEVELS:
- Yellow = Pivot and Pivot Zone (HLC3 by default)
- red = R1,S1 Levels 0.236 * Range
- Green = R2,S2 Levels 0.368 * Range
- Lime = R3,S3 Levels 0.618 * Range
- Blue = R4,S4 Levels 0.786 * Range
- Gray = R5,S5 Levels 1.000 * Range
- Lime = R6,S6 Levels 1.236 * Range
- Red = R7,S7 Levels 1.382 * Range
- Blue = R8,S8 Levels 1.618 * Range
- Green = R9,S9 Levels 2.000 * Range
CLASSIC LEVELS:
- Yellow = Pivot and Pivot Zone (HLC3)
- Green = R1,S1 Levels (Pivot*2 - Low), (Pivot*2 - High)
- Lime = R2,S2 Levels ( Pivot + Range), ( Pivot - Range)
- Lime = R3,S3 Levels (High + 2*( Pivot - Low)), (Low - 2*(High - Pivot ))
- Blue = R4,S4 Levels (High + 3*( Pivot - Low)), (Low - 3*(High - Pivot ))
Refrences:
- Auto Daily Fib Levels R3.0 by JustUncleL
- Auto Fib by TheYangGuizi
- Monthly Dynamic Range Levels (Fibonaci) V0 by RicardoSantos
Modifications:
- Added next FIB Levels. (changes during the current cycle)
- Added FIB 0.236 Levels
- Added Option to change the colors of the Fib Levels
- Changed Default colors to the colors of Tradingview
- Upgraded to Version4 Pinescript

ATR Daily Levels Band NakitxuAverage True Range
What Is the Average True Range (ATR)?
The average true range (ATR) is a technical analysis indicator, that measures market volatility by decomposing the entire range of an asset price for that period.
The true range indicator is taken as the greatest of the following: current high less the current low; the absolute value of the current high less the previous close; and the absolute value of the current low less the previous close.
The ATR is then a moving average, generally using 14 days, of the true ranges.
This script is an especial request of a TradingView user.
Shows 5 levels based on ATR daily, plotted in wherever timeframe you are using:
level 1: prv day ATR + prv day close
level 2: prv day ATR + prv day high
level 3: level 2 - prv day ATR
level 4: prv day close - prv day ATR
level 5: prv day low - prv day
Only show the levels if you are in a timeframe daily or lower than daily.

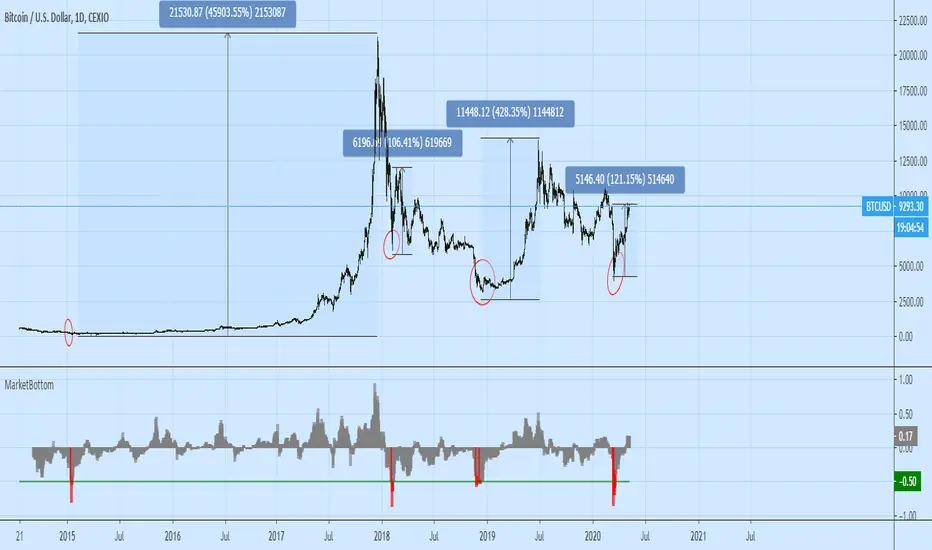
Market Bottom (Daily) by O.S.A.This indi shows the bottoms of market. It depends on average price and rate of change in daily. If you see in red on chart this means you shold buy :)
It works only on daily period.
Use your own risk.
Cheers
Fine Crown RangesThis is a script for placing ranges at different times and periods
ranges, weeky, daily, sessions, ma's

Reset Every (Price)Someone requested a high/low price indicator that would reset the "remembered" prices daily. I started out doing just that, and then decided to make it much more configurable.
Choose the units (minutes, hours, days, weeks, months) and the number of those units, and this will reset the highest/lowest value remembered to the current values on your chosen time interval.
This should work with any time interval you desire, within reason...asking for resets every 4000 hours on a monthly chart will probably not work.
GE, monthly, every 7 months:
Ford, weekly, every 18 months:
Dow Jones Industrial Average, weekly, every 90 days:
LTCBTC, daily, every 10 days:
ETHUSD, 30 minutes, every 10 days:
BTCUSD, 1 minute, every 10 hours:
EURUSD, 1 minute, every 50 minutes:
Also, I am about to publish another version of this with just one source input that can be applied to any indicator...stay tuned!

MAGNUS® CyclesThis indicator will help you if you struggle making any profit in bitcoin.
It generates very few signals with very nice profit potential ( around 100% this year ! ).
Perfect tool for longterm swing traders and new traders that need help figuring out the midterm trend.
Use it with these parameters only:
weekly: 13, 5, 12
daily: 92, 21, 96

Bias DailyThis indicator shows in a different way how to evaluate the BIAS Daily.
Evaluate yesterday's closed candle and that of the day before yesterday
The conditions are:
LONG BIAS =
Candle closed above High Candle [2 ]
- In this condition a long continuation can be considered
SHORT BIAS =
The candle closed below the low candle [2 ]
- In this condition a short continuation can be considered
IN THE RANGE =
The candle did not close below or above the Low and High candle
- In this condition it is better not to risk it
The user has the possibility to:
- Choose to show high or low BIAS levels
- Shows the Table in which the BIAS D is marked
The indicator should be used as TTrades shows in its videos, it can also be implemented in ICT strategies.
The indicator takes into consideration the last 2 candles already closed, so on the candle that is forming you can expect reactions in the Pd Array of the Candle Range , below I show examples of how to use it in Multitimeframe
BIAS LONG =
BIAS SHORT =

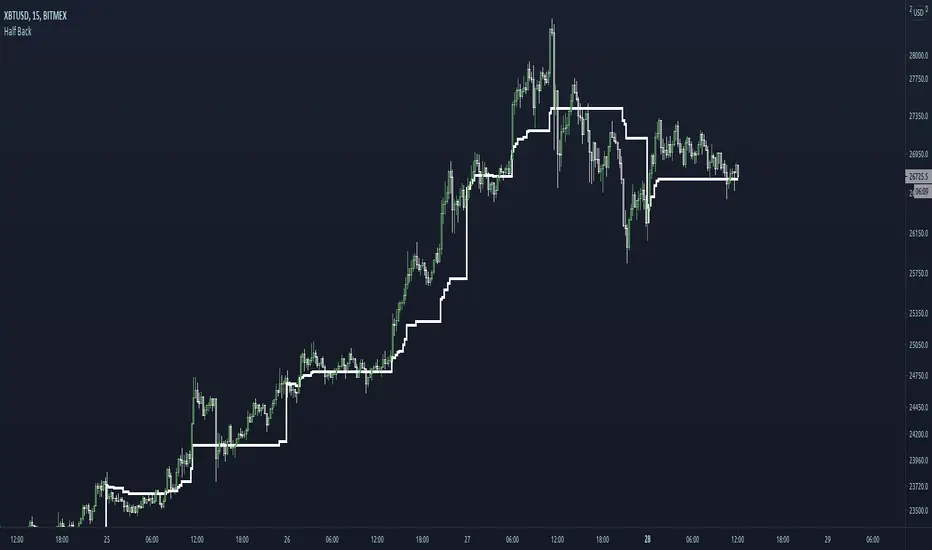
Half BackA dynamic intraday midpoint for Day Timeframe trader reference.
Midpoint is halfway between the day's highest high and lowest low.
Midpoint resets daily.
msoro daily $1 DCAPlots the dollar value of total btc accrued over the past year by buying 1 dollar's worth daily.
Black line is the breakeven level.

DDA-Daily Delta Analysis_v2 Fixed the code so you can look at all timeframes and not just the daily.

Optimal Daily MA Suite [MTF]Title: Optimal Daily MA Suite
Description: This is a comprehensive Multi-Timeframe (MTF) analysis suite designed to streamline chart layouts. Instead of loading multiple separate indicators to track various trend lines, this single tool allows traders to overlay higher-timeframe Moving Averages and key support/resistance levels directly onto their intraday charts.
Utility & Workflow: Swing traders and day traders often need to monitor "Big Picture" Daily Moving Averages (like the Daily 200 SMA or Daily 50 EMA) while executing trades on lower timeframes like the 15m or 1H. This tool automates that process, ensuring the major trend context is always visible without cluttering the indicator list.
Key Features:
Multi-Timeframe Engine: By default, all MAs are calculated on the Daily ("D") timeframe, regardless of the chart's current timeframe. This creates a stable "anchor" for trend analysis. The timeframe is fully customizable in the settings (e.g., set to "W" for Weekly analysis).
10 Customizable Slots: Toggle up to 10 different Moving Averages on/off individually.
Flexible Calculation Types: Supports SMA, EMA, WMA, VWMA, RMA (SMMA), and SWMA for every single line.
Trend Cloud Crossovers: Includes two dedicated "Cloud" setups to visualize crossovers (e.g., Golden Cross or Death Cross) with fill shading between the fast and slow lines.
Price Action Crossovers: Optional markers to highlight when the closing price crosses specific MAs.
Contextual Levels: Includes Previous Day High (PDH) and Previous Day Low (PDL) markers for immediate intraday support/resistance context.
How to Use:
Settings: Open the settings menu to select your "Indicator Timeframe" (Default: Daily).
Customization: Enable only the MAs relevant to your strategy (e.g., Enable MA 8 for the 50 SMA and MA 10 for the 200 SMA).
Clouds: Use the "Crossover Set" inputs to define a Bullish/Bearish trend cloud between two moving averages of your choice.
Technical Note: This script uses request.security with lookahead=barmerge.lookahead_off to ensure no repainting of historical data while providing accurate higher-timeframe values on closed bars.
Credits: Standard Moving Average calculations based on TradingView built-in functions.

Punjis Dynamic Daily EMA/SMA 5,9,21,50,100 LevelsPunjis Dynamic Daily EMA/SMA 5,9,21,50,100 Levels
Overview:
This indicator displays daily timeframe moving averages as horizontal lines extending to the right of your chart, regardless of what timeframe you're currently viewing. It includes six key moving averages: EMA 5, EMA 9, EMA 21, SMA 50, SMA 100, and SMA 200.
Key Features:
Clean Chart Design: Unlike traditional moving average lines that clutter your chart with curves across all candles, this indicator uses horizontal lines that extend only from the current price level to the right edge of your screen
Multi-Timeframe Analysis: View daily moving averages on any intraday timeframe (1min, 5min, 15min, etc.) without switching charts
Fully Customizable:
Toggle each moving average on/off independently
Adjust the period length for each MA
Customize colors for each line
Master toggle to show/hide all lines at once
Reduced Visual Noise: Horizontal lines keep your price action clean and easy to read while still providing critical support/resistance levels
Professional Layout: Perfect for traders who need to monitor multiple key levels without obscuring candlestick patterns and chart analysis
Benefits of Horizontal Lines:
Cleaner Charts: Traditional MAs draw lines through every candle, creating visual clutter. Horizontal lines only show current values, keeping your chart clean
Focus on Current Levels: What matters most is where the MAs are NOW relative to price - horizontal lines highlight this instantly
Better Price Action Visibility: See candlestick patterns, volume, and support/resistance levels clearly without MA lines crossing through them
Quick Reference: Instantly identify if price is above or below key moving averages without following curved lines across the chart
Professional Appearance: Clean, minimalist design preferred by institutional traders and technical analysts
Use Cases:
Day traders monitoring higher timeframe levels on intraday charts
Swing traders tracking daily moving averages as dynamic support/resistance
Multi-timeframe analysis without chart switching
Identifying trend direction and potential reversal zones
Clean workspace for pattern recognition and price action trading

IDLP – Intraday Daily Levels Pro [FXSMARTLAB]🔥 IDLP – Intraday Daily Levels Pro
IDLP – Intraday Daily Levels Pro is a precision toolkit for intraday traders who rely on objective daily structure instead of repainting indicators and noisy signals.
Every level plotted by IDLP is derived from one simple rule:
Today’s trading decisions must be based on completed market data only.
That means:
✅ No use of the current day’s unfinished data for levels
✅ No lookahead
✅ No hidden repaint behavior
IDLP reconstructs the previous trading day from the intraday chart and then projects that structure forward onto the current session, giving you a stable, institutional-style intraday map.
🧱 1. Previous Daily Levels (Core Structure)
IDLP extracts and displays the full previous daily structure, which you can toggle on/off individually via the inputs:
Previous Daily High (PDH)
Previous Daily Low (PDL)
Previous Daily Open
Previous Daily Close,
Previous Daily Mid (50% of the range)
Previous Daily Q1 (25% of the range)
Previous Daily Q3 (75% of the range)
All of these come from the day that just closed and are then locked for the entire current session.
What these levels tell you:
PDH / PDL – true extremes of yesterday’s price action (liquidity zones, breakout/reversal points).
Previous Daily Open / Close – how the market positioned itself between session start and end
Mid (50%) – equilibrium level of the previous day’s auction.
Q1 / Q3 (25% / 75%) internal structure of the previous day’s range, dividing it into four equal zones and helping you see if price is trading in the lower, middle, or upper quarter of yesterday’s range.
All these levels are non-repaint: once the day is completed, they are fixed and never change when you scroll, replay, or backtest.
🎯 2. Previous Day Pivot System (P, S1, S2, R1, R2)
IDLP includes a classic floor-trader pivot grid, but critically:
It is calculated only from the previous day’s high, low, and close.
So for the current session, the following are fixed:
Pivot P – central reference level of the previous day.
Support 1 (S1) and Support 2 (S2)
Resistance 1 (R1) and Resistance 2 (R2)
These levels are widely used by institutional desks and algos to structure:
mean-reversion plays, breakout zones, intraday targets, and risk placement.
Everything in this section is non-repaint because it only uses the previous day’s fully closed OHLC.
📏 3. 1-Day ADR Bands Around Previous Daily Open
Instead of a multi-day ADR, IDLP uses a pure 1-Day ADR logic:
ADR = Range of the previous day
ADR = PDH − PDL
From that, IDLP builds two clean bands centered around the previous daily Open:
ADR Upper Band = Previous Day Open + (ADR × Multiplier)
ADR Lower Band = Previous Day Open − (ADR × Multiplier)
The multiplier is user-controlled in the inputs:
ADR Multiplier (default: 0.8)
This lets you choose how “tight” or “wide” you want the ADR envelope to be around the previous day’s open.
Typical use cases:
Identify realistic intraday extension targets, Spot exhaustion moves beyond ADR bands, Frame reversals after reaching volatility extremes, Align trades with or against volatility expansion
Again, since ADR is calculated only from the completed previous day, these bands are totally non-repaint during the current session.
🔒 4. True Non-Repaint Architecture
The internal logic of IDLP is built to guarantee non-repaint behavior:
It reconstructs each day using time("D") and tracks:
dayOpen, dayHigh, dayLow, dayClose for the current day
prevDayOpen, prevDayHigh, prevDayLow, prevDayClose for the previous day
At the moment a new day starts:
The “current day” gets “frozen” into prevDay*
These prevDay* values then drive: Previous Daily Levels, Pivots, ADR.
During the current day:
All these “previous day” values stay fixed, no matter what happens.
They do not move in real time, they do not shift in replay.
This means:
What you see in the past is exactly what you would have seen live.
No fake backtests.
No illusion of perfection from repainting behavior.
🎯 5. Designed For Intraday Traders
IDLP – Intraday Daily Levels Pro is made for:
- Day traders and scalpers
- Index and FX traders
- Prop firm challenge trading
- Traders using ICT/SMC-style levels, liquidity, and range logic
- Anyone who wants a clean, institutional-style daily framework without noise
You get:
Previous Day OHLC
Mid / Q1 / Q3 of the previous range
Previous-Day Pivots (P, S1, S2, R1, R2)
1-Day ADR Bands around Previous Day Open
All calculated only from closed data, updated once per day, and then locked.

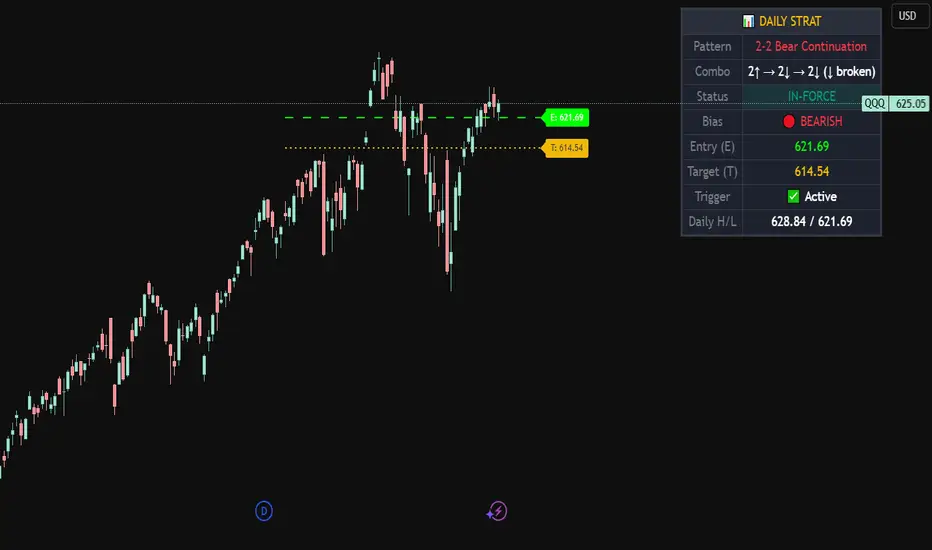
Strat Daily Predictor📊 Strat Daily Predictor
This indicator analyzes Daily timeframe Strat patterns and displays actionable trading setups on any chart timeframe.
🔹 FEATURES:
• Detects all major Strat patterns (2-1-2, 3-1-2, 3-2-2, 1-2-2, 2-2, 1-2, 1-3)
• Shows Entry (E) and Target (T) price levels
• Pattern status: ACTIONABLE, TRIGGERED, or IN-FORCE
• Visual Entry/Target lines on chart
• Entry signals when price breaks trigger levels
• Works on any timeframe using Daily analysis
🔹 PATTERN TYPES:
• Continuation patterns (trend following)
• Reversal patterns (counter-trend)
• Bullish & Bearish setups
🔹 TABLE DISPLAYS:
• Current pattern name
• Bar combo (e.g., 2↑ → 1 → 2↑)
• Bias (BULLISH/BEARISH)
• Entry & Target prices
• Daily High/Low levels
🔹 HOW TO USE:
1. Add to any timeframe chart
2. Check table for Daily pattern setup
3. Wait for ACTIONABLE patterns
4. Enter when price breaks Entry level
5. Target shown on chart
🔹 ALERTS:
• Long Entry
• Short Entry
• Actionable Pattern
• In-Force Pattern
Based on Rob Smith's "The Strat" methodology.
P_NQ Futures Daily Bias & Structure ProOverview The Master Sniper is a professional-grade execution system designed for high-volatility assets like NQ (Nasdaq 100) and ES (S&P 500). Unlike standard indicators that generate blind signals, this script uses a Multi-Timeframe Logic Engine to first establish a daily bias and then hunt for specific intraday triggers.
It features a Hybrid Strategy that can automatically switch between Trend Following (Smart Money Concepts) and Mean Reversion (Gap Fades), giving you a complete toolkit for any market condition.
Key Features
1. Macro Bias Engine (The Filter) Before generating any signal, the script analyzes the Daily Chart in the background:
Structure: Checks for Higher Highs/Lows vs. Lower Highs/Lows.
Momentum: Uses RSI and the 200 EMA to ensure you aren't buying the top or selling the bottom.
Result: It generates a directional bias (Bullish/Bearish) that filters out low-probability trades.
2. Hybrid Entry Logic
Trend Mode (SMC): Identifies Fair Value Gaps (FVG) within "Discount" or "Premium" zones. It only triggers if the price pulls back into a value area aligned with the Daily Bias.
Reversal Mode (Elasticity): Detects when price is over-extended (2.0 Standard Deviations from VWAP) or when a "Liquidity Sweep" occurs, signaling a snap-back trade.
Gap Rejection (Morning Fade): A dedicated engine that monitors the Opening Gap. If the market gaps significantly but fails to hold, it triggers a "Fade" trade to target the gap fill.
3. Professional Trade Management Visualizes your trade plan instantly on the chart:
Split Targets: Draws targets for Contract 1 (Scalp) and Contract 2 (Runner).
Auto-Break Even: The moment TP1 is hit, the Stop Loss line visually moves to your Entry Price, signaling a "Risk-Free" trade.
Infinite Target Lines: Extends target lines to the right until the trade concludes, keeping your chart clean.
4. Risk Filters
Range Filter: Prevents buying in the Top 1/3 or selling in the Bottom 1/3 of the daily range.
Proximity Filter: Blocks trades that are squeezing too tight against the 100-candle High/Low.
How to Use
Timeframe: Optimized for the 5-Minute (5m) chart on Futures (NQ/ES) or Tech Stocks.
Dashboard: Check the bottom-right panel. Ensure "Status" says "SCANNING" and Filters show "Active."
Execution: Wait for the alert (e.g., "🟢 ENTER LONG"). Place your orders at the Blue Line with SL at the Red Line.

MC² Daily Candidates (v1.0 SAFE)// This Pine Script® code is subject to the terms of the Mozilla Public License 2.0 at mozilla.org
// © mason_fibkins
//@version=5
indicator("MC² Daily Candidates (v1.0 SAFE)", overlay=true)
// ──────────────────────────────────────────
// INTERNAL DAILY DATA (NO TIMEFRAME ARGUMENT)
// ──────────────────────────────────────────
getDaily(_src) =>
request.security(syminfo.tickerid, "D", _src)
// Daily values
d_close = getDaily(close)
d_open = getDaily(open)
d_high = getDaily(high)
d_low = getDaily(low)
d_vol = getDaily(volume)
// ──────────────────────────────────────────
// Parameters
// ──────────────────────────────────────────
lookbackVol = input.int(10, "Vol Lookback (days)")
atrLength = input.int(14, "ATR Length")
emaLen = input.int(20, "EMA Length")
smaLen = input.int(50, "SMA Length")
// ──────────────────────────────────────────
// Core Calculations (DAILY)
// ──────────────────────────────────────────
// Relative Volume
relVol = d_vol / request.security(syminfo.tickerid, "D", ta.sma(volume, lookbackVol))
// Momentum — last 2 daily bullish candles
twoGreen = (d_close > d_open) and (request.security(syminfo.tickerid, "D", close ) > request.security(syminfo.tickerid, "D", open ))
// Trend filters
emaTrend = d_close > request.security(syminfo.tickerid, "D", ta.ema(close, emaLen))
smaTrend = d_close > request.security(syminfo.tickerid, "D", ta.sma(close, smaLen))
// ATR Expansion
d_atr = request.security(syminfo.tickerid, "D", ta.atr(atrLength))
atrExpand = d_atr > request.security(syminfo.tickerid, "D", ta.atr(atrLength))
// Strong Close
dayRange = d_high - d_low
closePos = dayRange > 0 ? (d_close - d_low) / dayRange : 0.5
strongClose = closePos > 0.70
// MASTER CONDITION
candidate = relVol > 2.0 and twoGreen and emaTrend and smaTrend and atrExpand and strongClose
// ──────────────────────────────────────────
// PLOT — GREEN CIRCLE BELOW DAILY BARS
// ──────────────────────────────────────────
plotshape(candidate, title="Daily Candidate", style=shape.circle, size=size.large, color=color.new(color.green, 0), location=location.belowbar, text="MC²")
// ──────────────────────────────────────────
// END
// ──────────────────────────────────────────
plot(candidate ? 1 : 0, title="MC2_Signal", display=display.none)

Watermark | Bar Time | Average Daily RangeMulti Info Panel & Watermark
Multi Info Panel & Watermark is a utility indicator that displays several pieces of chart information in a single, customizable panel. It is designed to support intraday and swing analysis by making key data—such as symbol details, date, and average daily range—easy to see at a glance, as well as providing simple tools for notes and backtesting.
Features
Watermark / Custom Note
Optional text overlay that can be used as a watermark or personal note.
Can display a strategy name, reminder, or any other user-defined label on the chart.
Ticker Info
Shows information about the currently active symbol on the chart (for example, symbol name and other basic details depending on the inputs).
Helps keep track of which market or pair is being analyzed, especially when using multiple charts.
Current Date
Displays the current date directly on the chart.
Useful for screenshots, journaling, and documenting analysis.
Average Daily Range (ADR)
Calculates the average daily range of the active symbol over a user-defined number of recent days.
Helps visualize how much price typically moves in a day, which can support position sizing, target setting, or volatility awareness within your own trading approach.
Open Bar Time Marker
Marks the open time of a selected bar (for example, a session open or a specific reference bar).
Primarily intended as a visual aid for manual backtesting and reviewing historical price action.
Usage
Use the watermark and ticker info to keep your charts labeled and organized.
Refer to the ADR readout to understand typical daily volatility of the instrument you are studying.
Use the date and open bar time marker when creating screenshots, trade journals, or when replaying historical sessions for review.
This script does not generate trading signals and does not guarantee any performance or results. It is provided solely as an informational and visualization tool. Always combine it with your own analysis, risk management, and decision-making. Nothing in this indicator or description should be considered financial advice.

Séparateur H4 & DailyH4 & Daily Separator - TradingView Indicator
This Pine Script v6 indicator draws infinite vertical lines to mark H4 and Daily candle separations on your chart.
Features:
H4 Separations: Marks candles starting at 3am, 7am, 11am, 3pm, 7pm, and 11pm
Daily Separations: Marks candles starting at midnight (00:00)
Fully Customizable:
Toggle H4 and/or Daily lines independently
Choose line color, thickness (1-4), and style (Solid, Dotted, Dashed)
Control the number of visible vertical lines (1-500)
Use Case:
Perfect for traders who want to visualize higher timeframe separations while trading on lower timeframes. Helps identify H4 and Daily candle opens without switching charts.
Installation:
Simply copy the code into TradingView's Pine Editor and add it to your chart. All settings are adjustable in the indicator's settings panel.
