Cari dalam skrip untuk "ema"


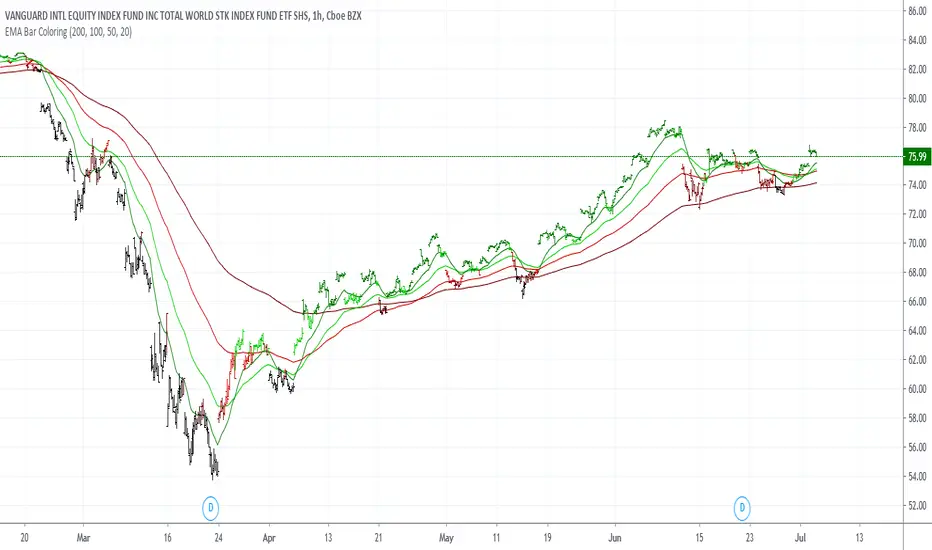
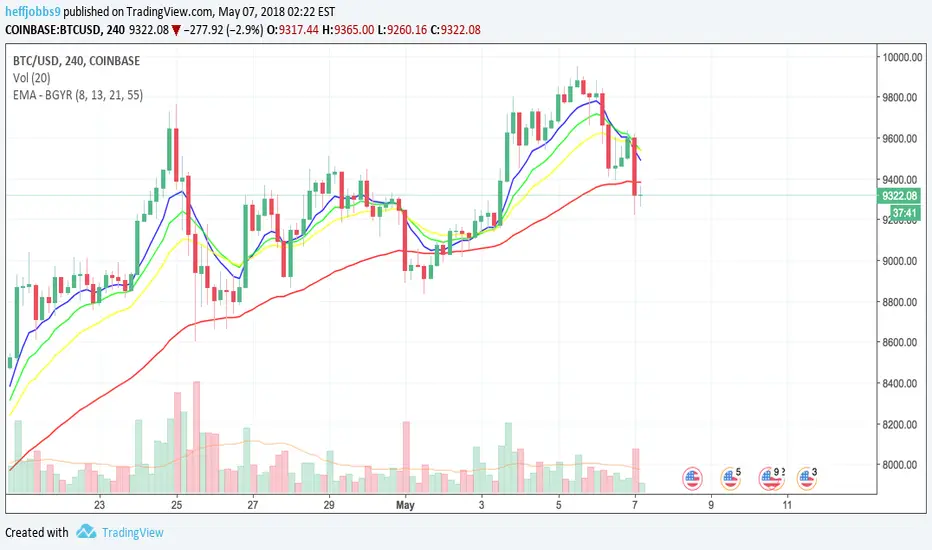
EMA Bar ColoringHi,
This is a simple visualization because I wanted to use tradingview on the cellphone with less Lines and Easy to understand.
There are 4 moving averages for each level of the closing price, the color changes.
The Moving averages can be seen in the option tab.
Also the plot of the closing prices can also be seen.
It works better with bar charts.
Best Regards,
RERS


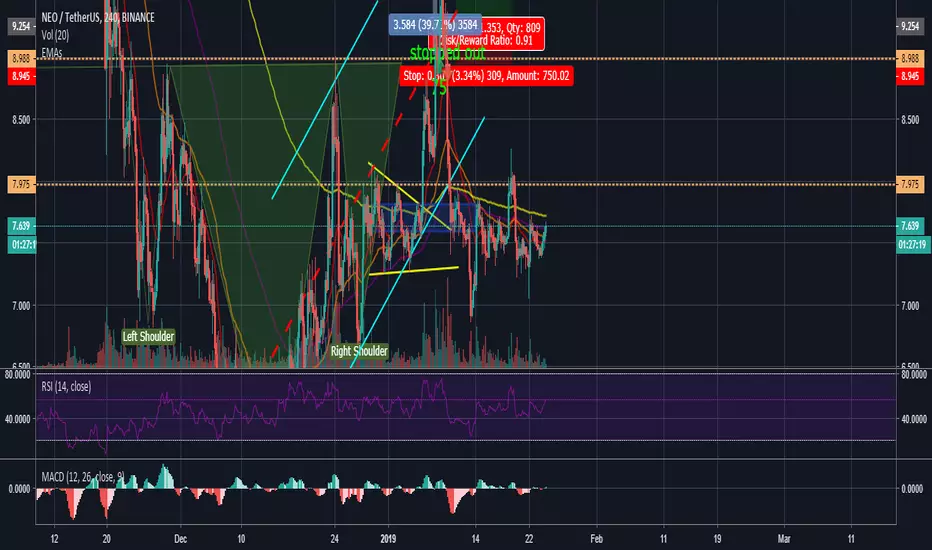


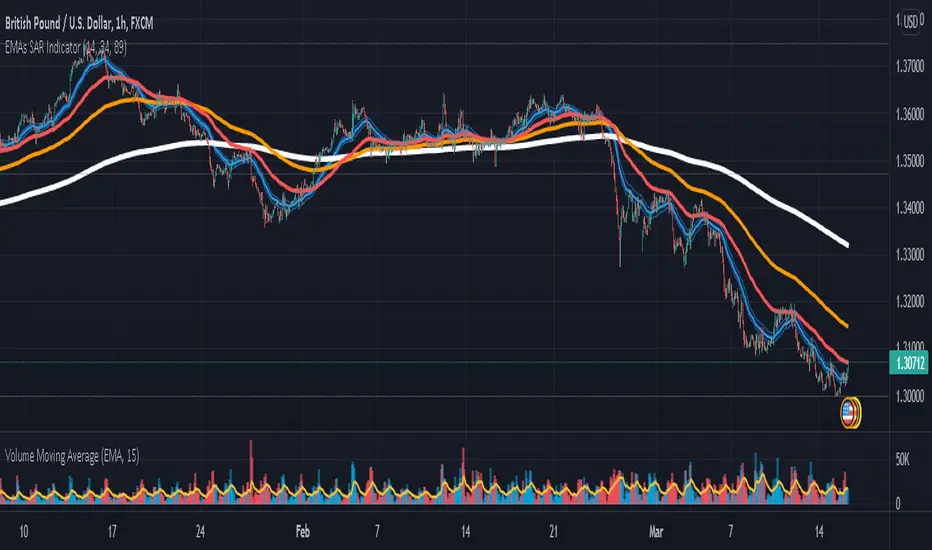
EMAs: 10,20
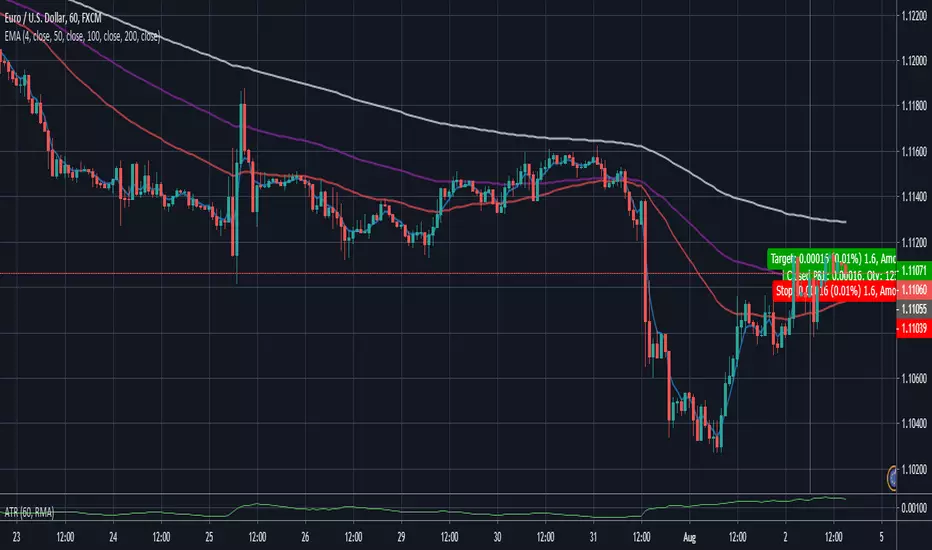
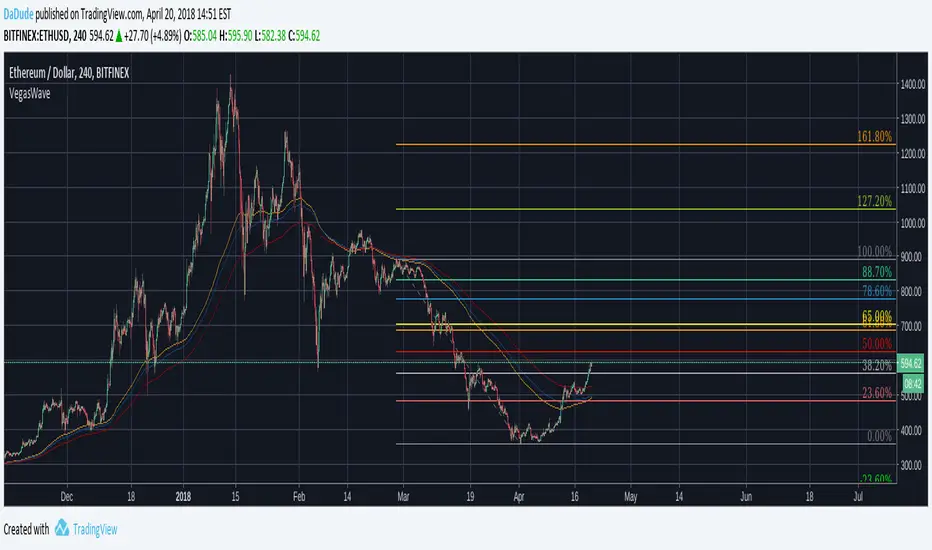
Hello this is a script that seeks to increase a bit the number of indicators used in the free version. its use is to know if a trend continues or will change, it is a very used and simple but efficient system. If the distance between the lines remains constant then it indicates or gives an indication that the trend continues but if they are cut it indicates or gives an indication of change of interest.
sorry for my bad english but I speak spanish


Multi-TF VWAP+EMA LevelsVWAP + Multi-Timeframe EMA Dashboard displays key levels for institutional trading analysis. It shows VWAP and EMAs (5, 20, 50, 100, 200) from a user-selected timeframe in a compact top-right table.
Core Features
# Timeframe Selector: Dropdown with 5m, 15m, 30m, 1H, 2H, 4H, 1D (default), 1W, 1M options.
# Dynamic Levels: All values calculated from chosen timeframe using request.security().
# Clean Table Display: Dark theme table shows current symbol name and precise values (2 decimals).
# Real-time Updates: Refreshes only on last bar (barstate.islast) for performance.It
