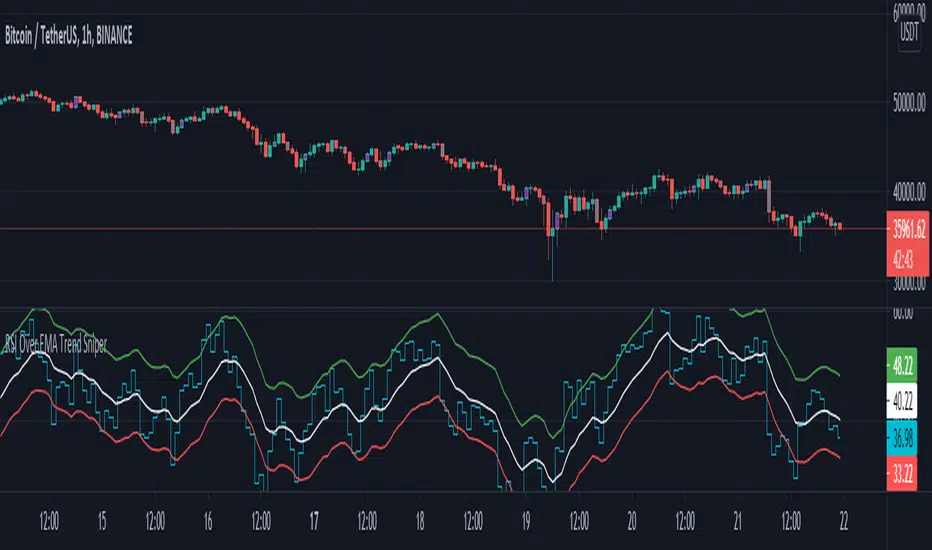
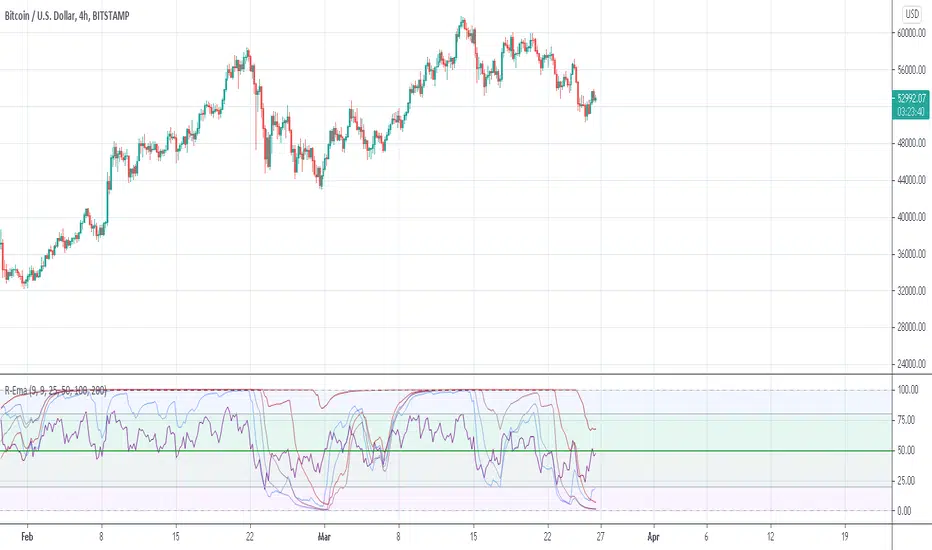
RSI Over EMA Trend SniperThis is an indicator that uses horizontal EMA lines with a RSI line on top of it to provide optimal entry and exit positions for trading crypto.
How to use:
If the Aqua(RSI) line passes upwards on the red heading to the white - it's heading towards a good BUY signal. To be safe you wait until it passes above the white line, then BUY LONG. Another signal to buy long is when the Aqua line passes above the white and green lines.
Selling is essentially the opposite, if the Aqua line is passing down from the green or white lines, then it's time to sell and exit your trade.
This indicator works well as a confirmation, and it's nice to have multiple confirmations, so it's suggested you use this with other indicators that can provide entry and exit confirmations.
Cari dalam skrip untuk "ema"
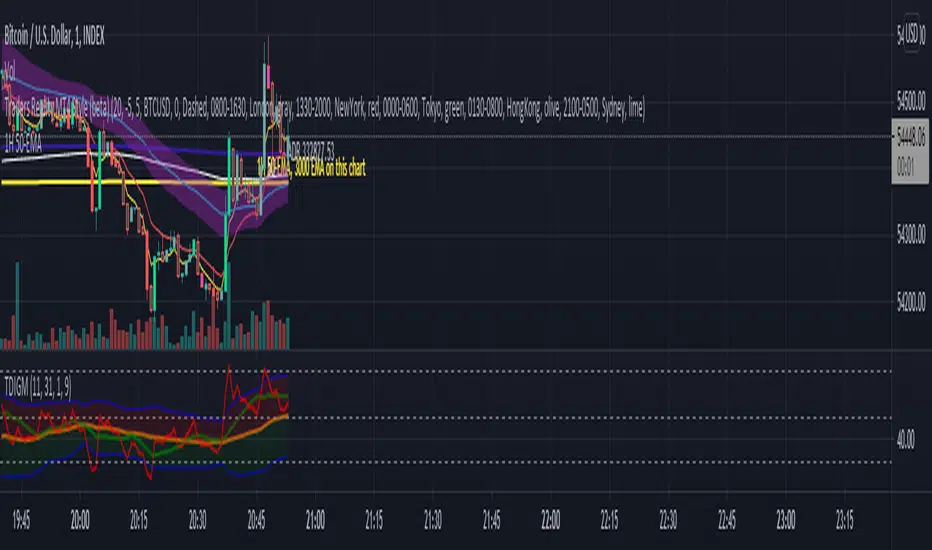
1H 50-EMAFor anyone using a smaller timeframe who still wants to see the 1-hr 50-ema without having to change its settings every time
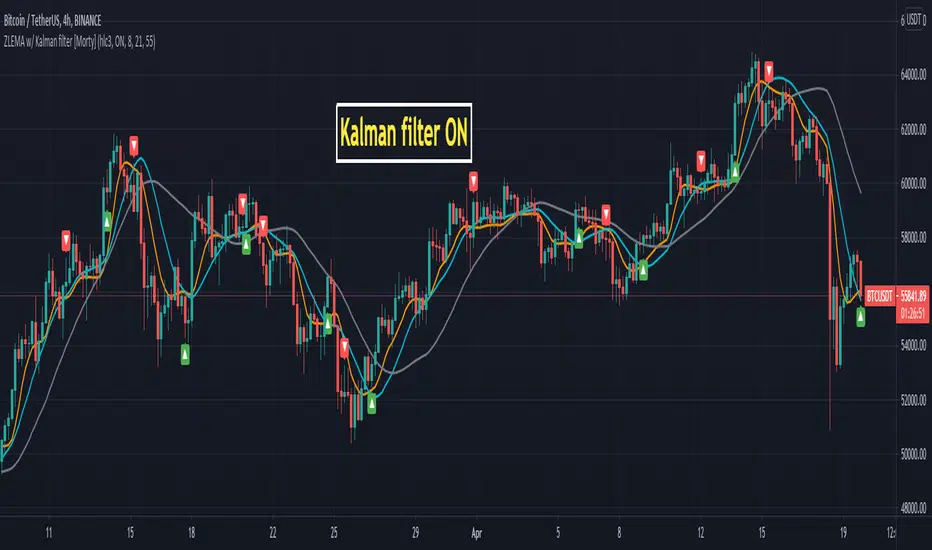
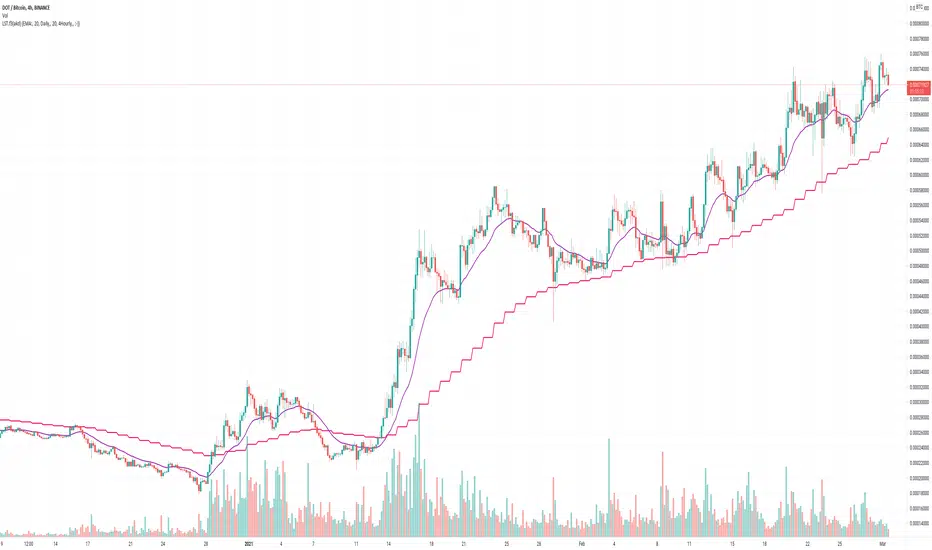
ZLEMA Zero lag EMA with Kalman filter [Morty]This indicator plot 3 Kalman filter zero lag EMA lines. It has less lag and is also smoother than the original EMA.
It also has an option to show the crossover of two EMAs.
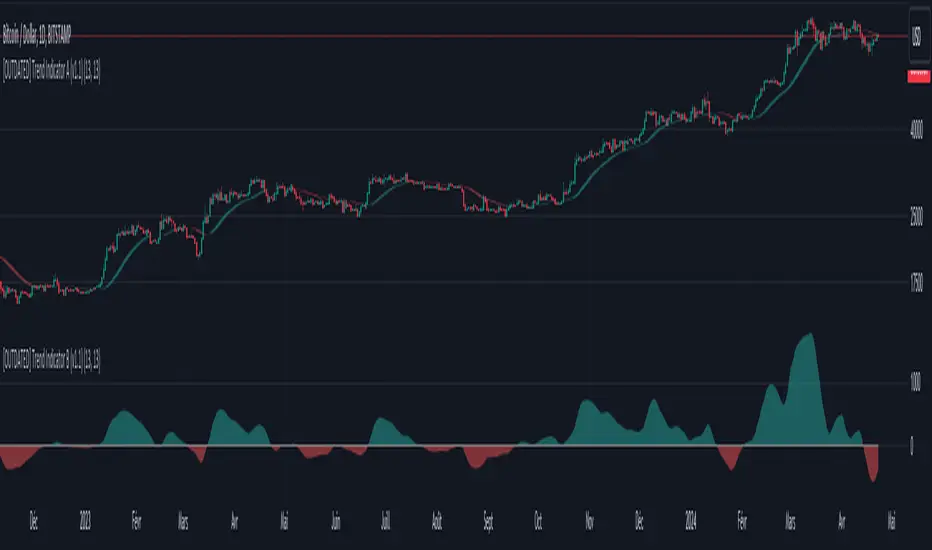
Dziwne Trend Indicator B (EMA + Heikin Ashi) V1Based on my own "Dziwne Trend Indicator A (EMA + Heikin Ashi cloud)" , I tweaked the original script to display and "measure" the overall trend.
Performante's Average Bitcoin Volume EMA Indicator This is the average Bitcoin volume with the data collected from the major retail exchanges + the exponential moving average (EMA) for the volume added on to better understand relative volume.
Thank you Julio!

EMA clouds strategy ElleEMA cloud strategy with variables suggested by Ripster47.
Take Entry close to 10 min 4/5 EMA ONLY

Guppy Multi MA & EMAA combination of 4 customizable MA's and EMA's to give a cloud of support or Ressistance.

LedgerStatusToolbox fork3: EMA/SMA that stays on a specific timeMy (akd) radically cut down fork#3 of the "Ledger Status Toolbox"
which had included many more options that I don't need
but was missing the 4hourly, and hourly = which I added here
and yes, I kicked out the weekly. Hardly ever looking at that anyways. Shall I reintroduce it for fork4 ?
The huge advantage of this approach, over other SMA/EMA indicators:
It stays on the chosen (e.g. daily) data, and calculates the moving averages for that data. Even if you switch the chart to different time candles (like hours or weeks).
So whatever time resolution candles you look at, these indicator lines stay in the same place.
Thanks to krogsgard. Check out his "Ledger Status Toolbox" it also has Bollinger bands (but those are always on "current" I think?). A very powerful tool, just too powerful for most times for me newb. So I cut it down to this mini version. Enjoy!
MA+EMASMA and EMA will indicate market price simple moving average and exponential moving average .
Deduction price will help you to forecast SMA trend.

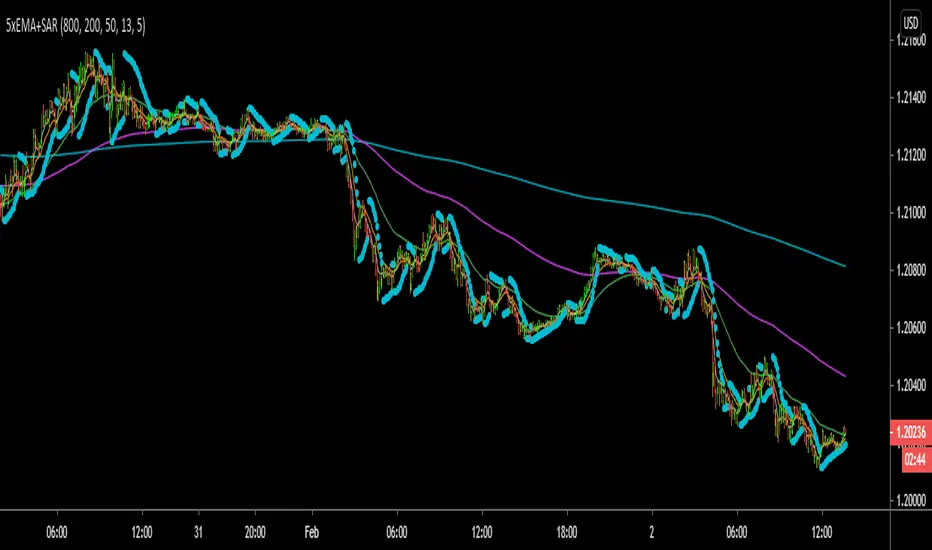
Heavy EMAThis script looks at 5 different EMAs so that you can compare the short term to the long term trend, and combines it with the Parabolic SAR. This can be used to find a great entry into a new or reversing trend.
Ehler Fisher applied on distance EMAThis is an improved version of Fisher, which use as a source the distance from EMA , compared to the initial source which was on the close of a candle.
It can be used in any market, any time frame .
For conditions we have multiple conditions for the logic, in this case initially if our fisher is above 0 is a long direction ,if its belowe 0 its a short direction.
Also we can improve this condition even further, in this case if we cross up our previous line its a buy signal, and if we cross down its a sell signal.
For best usage combine the cross together with the position of fisher respecting the 0.
If you have any other questions, let me know with a private message.

Combined EMA & MA crossovers [CDI]Implementation of the strategy of moving averages crossings combining two fast and two slow that are used to confirm the entry.
The purpose is to be able to quickly see a backtesting of the strategy by easily configuring the profit / loss percentage. In this script the profit percentage is used for the loss percentage as well.
Additionally you can see the moving averages all in a single chart tool.
In the community to which I belong, this strategy is used in daily candles, especially for swing trading, but it can be used in different time frames.
WARNING:
- For purpose educate only
- The entries are used under your responsibility

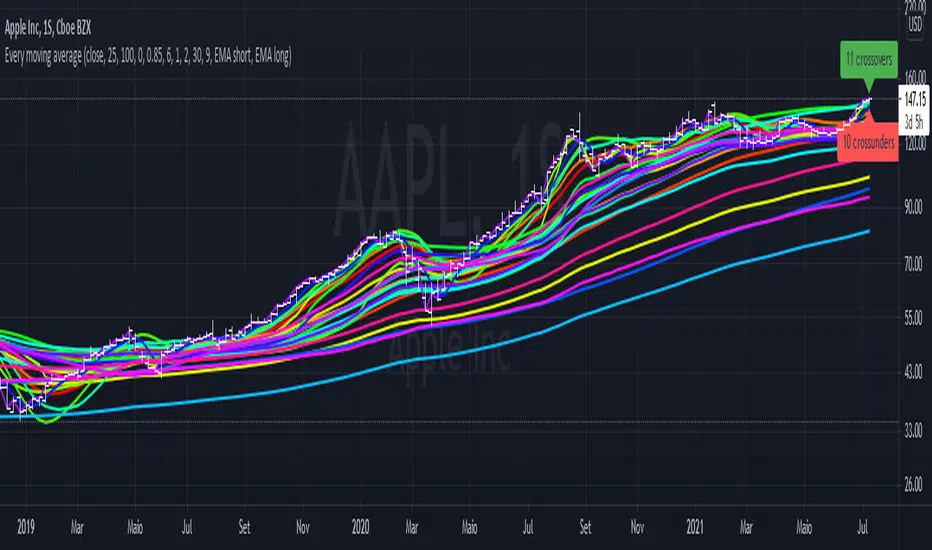
Every single moving average (ALMA, EMA, HMA, KAMA, RMA, SMA...)So you may be looking at the graph and thinking "this is a mess", and I agree.
The purpose of this script is to plot in the same graph every single type of moving average that I could think of, so you can find the ones that are better for your timeframe and for your asset. Once you add it, disable those types that doesn't seem to serve your purpose, until you can select one you like.
The average types are: ALMA, EMA, HMA, KAMA, RMA, SMA, SWMA, VIDYA, VWAP, VWMA, and WMA. Each one is ploted two times (except SWMA and VWAP), one with a short period, and another with a long, both of which you can configure.
Moving Average Colored EMA/3 SMA1. Updated this available script to have 2 SMA's and 2 EMA's.
2. Revised so that plot turns white when flat.
3. Added Trend Gain to control what slope "flat" has for different TF's.

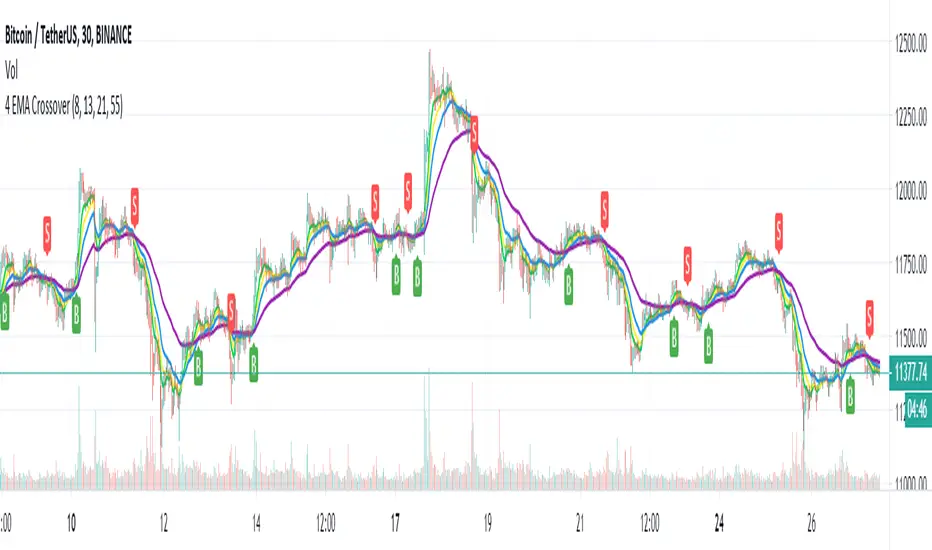
4 EMA Crossover w/alerts4 EMA crossover visualized (buy/sell) w/ alerts.
Personally I use 8, 13, 21 & 55 for LTF's and 21, 55, 100 & 200 for HTF's