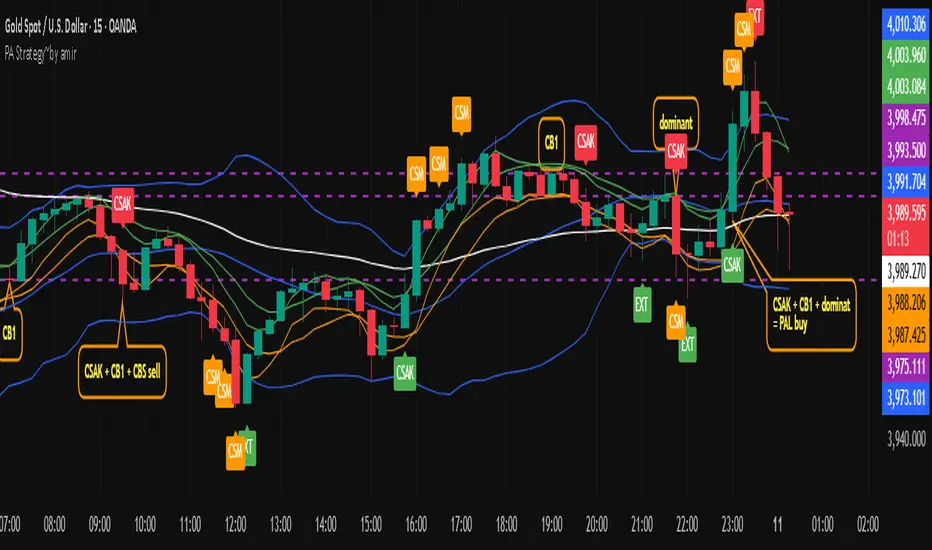
PAL strategy
This trading script is based on the foundational concepts of the BBMA Omaa Ally, but it incorporates several custom additions and modifications tailored to a specific individual trading style. The general approach for utilizing these signals is as follows:
1. EXT, CSM, and CSAK Signals: When any of these momentum/breakout signals occur, the trader typically waits for a re-entry or retracement of the price action. The actual trade entry is then made upon contact with the opposing WMA 5 or WMA 10 lines.
2. CSAK with CB1 (CBS): If a CSAK candle forms concurrently with a CB1 (an initial breakout confirmation), the setup is designated as a **CBS**. For lower timeframes (M5/M15), an instant entry may be taken on the CBS candle, while entries on higher timeframes (H1/H4/Daily) are taken on the WMA 5/10 retracement following the CBS.
3. CSAK with CB1 and Dominant Break (PAL): A setup involving a CSAK candle, CB1, and a break of a Dominant candle/level is identified as a **PAL**. Similar to the CBS rule, an instant entry is taken on M5/M15, and a **WMA 5/10 retracement entry is utilized for higher timeframes.
4. CPA Signals: The **CPA** signal is treated as a high-conviction setup, warranting an instant entry. For all trades, the Stop Loss (SL) and Take Profit (TP) are managed by exiting the trade if the price breaks the opposing WMA 5 or WMA 10 line.
**In an advanced trading context, the confirmation of a re-entry on a higher timeframe is verified by observing an EXT signal on a corresponding lower timeframe. This is known as confluent confirmation.
Monthly -> daily
Weekly -> H4
Daily -> H1
H4 -> m15
H1 -> m5
Cari dalam skrip untuk "entry"
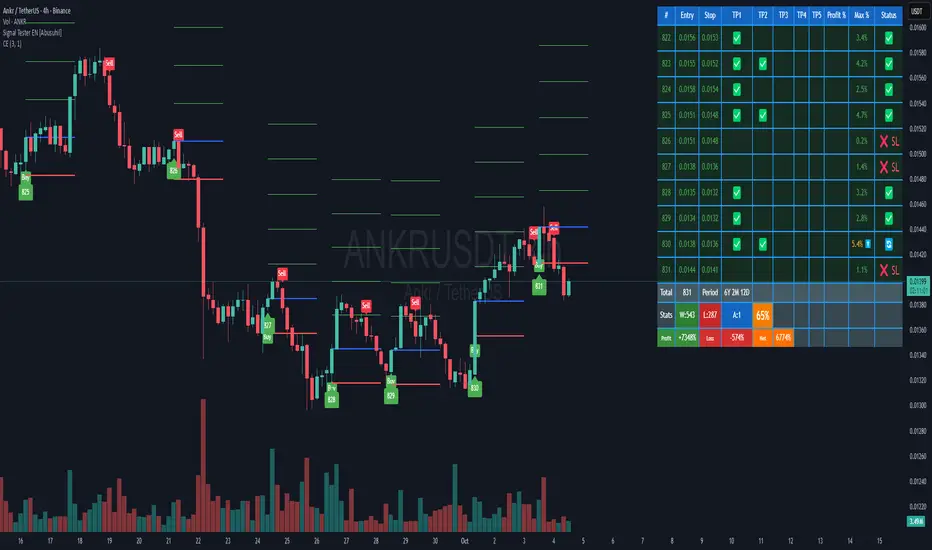
Signal Tester EN [Abusuhil]Signal Tester - Complete Description
Overview
Signal Tester is a comprehensive trading tool designed to backtest and analyze external trading signals with advanced risk management capabilities. The indicator provides seven different calculation methods for stop-loss and take-profit levels, along with detailed performance statistics and real-time tracking of active trades.
Important Disclaimer: This indicator is a tool for analysis and education purposes only. Past performance does not guarantee future results. Trading involves substantial risk of loss and is not suitable for all investors. Always conduct your own research and consider seeking advice from a qualified financial advisor before making trading decisions.
Key Features
7 Calculation Methods for customizable risk management
External Signal Integration via any oscillator or indicator
Real-time Trade Tracking with visual entry/exit points
Comprehensive Statistics Table showing win rate, profit/loss, and active trades
Date Filtering for focused backtesting periods
Custom Alerts for new buy signals
Multi-Target System with up to 5 take-profit levels
How to Use
Step 1: Connect External Signal
The indicator requires an external signal source to generate buy signals.
Add your preferred indicator to the chart (RSI, MACD, Stochastic, custom indicator, etc.)
In Signal Tester settings, locate "External Indicator" input
Click the input and select your indicator's plot line
Buy signals are generated when the external source crosses above zero
Example: If using RSI, connect the RSI line. A buy signal triggers when RSI crosses above the zero reference (if plotted as oscillator).
Step 2: Choose Your Calculation Method
Select one of seven methods under "Calculation Method":
1. Percentage %
The simplest method using fixed percentage values.
Settings:
Stop Loss %: Distance from entry to stop-loss (default: 2%)
Target 1-5 %: Distance from entry to each take-profit level
Example: Entry at $100
Stop Loss (2%): $98
Target 1 (2%): $102
Target 2 (4%): $104
Best For: Beginners, markets with consistent volatility
2. ATR Multiplier
Uses Average True Range for dynamic levels based on market volatility.
Settings:
ATR Period: Calculation period (default: 14)
Stop Multiplier: ATR multiplier for stop-loss (default: 1.5)
Target Multipliers: ATR multipliers for each take-profit
Example: Entry at $100, ATR = $2
Stop Loss (1.5x ATR): $100 - $3 = $97
Target 1 (2x ATR): $100 + $4 = $104
Best For: Volatile markets, adapting to changing conditions
3. Risk:Reward Ratio
Calculates targets based on risk-to-reward ratios.
Settings:
Stop Loss %: Initial risk percentage
Target Ratios: R:R ratio for each target (1:1.5, 1:2, 1:3, etc.)
Example: Entry at $100, Stop at $98 (2% risk = $2)
Target 1 (1:1.5): $100 + ($2 × 1.5) = $103
Target 2 (1:2): $100 + ($2 × 2) = $104
Target 3 (1:3): $100 + ($2 × 3) = $106
Best For: Traders focused on risk management and position sizing
4. Swing High/Low
Places stop-loss at recent swing low with targets as multiples of the risk.
Settings:
Swing Lookback Candles: Number of bars to find swing low (default: 5)
Stop Safety Distance %: Buffer below swing low
Target Multipliers: Risk multiples for each target
Example: Entry at $105, Swing Low at $100
Stop Loss: $100 - 0.1% = $99.90 (risk = $5.10)
Target 1 (1.5x): $105 + ($5.10 × 1.5) = $112.65
Best For: Swing traders, respecting market structure
5. Partial Take Profit
Sells portions of the position at each target level, moving stop to entry after first target.
Settings:
Stop Loss %: Initial stop distance
Target 1-5 %: Price levels for partial exits
Sell % at TP1-4: Percentage of position to close at each level
Example: 100% position, 50% sell at each target
TP1 hit: Sell 50%, remaining 50%, stop moves to entry
TP2 hit: Sell 25% (50% of remaining), remaining 25%
TP3 hit: Sell 12.5%, remaining 12.5%
Best For: Conservative traders, locking in profits gradually
6. Trailing Stop
Similar to Partial Take Profit but trails the stop-loss to each achieved target.
Settings:
Stop Loss %: Initial stop distance
Target 1-5 %: Price levels for trailing stops
Sell % at TP1-4: Percentage to close at each level
Example:
TP1 ($102) hit: Sell 50%, stop trails to $102
TP2 ($104) hit: Sell 25%, stop trails to $104
Price retraces to $104: Exit with locked profits
Best For: Trend followers, maximizing profit in strong moves
7. Smart Exit
Advanced method that moves stop to entry after first target, then exits based on technical conditions.
Settings:
Stop Loss %: Initial stop distance
First Target %: When hit, stop moves to breakeven
Exit Method: Choose from 8 exit strategies
Exit Methods:
Close < EMA 21: Exits when price closes below 21-period EMA
Close < MA 20: Exits when price closes below 20-period Moving Average
Supertrend Flip: Exits when Supertrend indicator flips bearish
ATR Trailing Stop: Dynamic trailing stop based on ATR
MACD Crossover: Exits on MACD bearish crossover
RSI < 50: Exits when RSI drops below specified level
Parabolic SAR Flip: Exits when SAR flips above price
Bollinger Bands: Exits when price closes below middle or lower band
Best For: Advanced traders, letting winners run with protection
Date Filtering
Control which trades are included in backtesting.
Filter Types:
Specific Date: Only trades after selected date
Number of Weeks: Last X weeks (default: 12)
Number of Months: Last X months (default: 3)
How to Enable:
Check "Enable Date Filter"
Select filter type
Set the date or number of weeks/months
Use Case: Test strategy performance in recent market conditions or specific periods
Understanding the Statistics Table
The table displays the last 10 trades plus comprehensive statistics:
Trade Columns:
#: Trade number
Entry: Entry price
Stop: Current stop-loss level
TP1-TP5: Checkmarks (✅) when targets are hit
Profit %: Realized profit for the trade
Max %: Maximum unrealized profit reached (⬆️ indicates active trade)
Status:
🔄 Active trade
✅ Closed winner
❌ SL - Stopped out
Summary Row:
Total: Number of trades executed
Period: Duration of trading period (Years, Months, Days)
Statistics Row:
W: Number of winning trades
L: Number of losing trades
A: Number of active (open) trades
Win Rate %: (Wins / Total Trades) × 100
Performance Row:
Profit: Total profit from all winning trades
Loss: Total loss from all losing trades
Net: Net profit/loss (Profit - Loss)
Visual Elements
When a buy signal triggers, the indicator draws:
Blue Line: Entry price
Red Line: Stop-loss level
Green Lines: Take-profit levels (up to 5)
Green Label: Trade number below the entry bar
Green Triangle: Buy signal marker
Alerts
The indicator includes customizable alerts for new buy signals.
Setting Up Alerts:
Click the "⏰" icon in TradingView
Select "Signal Tester "
Choose condition: "Buy"
Configure notification preferences (popup, email, webhook)
Click "Create"
Alert Message Format:
🚀 New Buy Signal!
Price:
Trade #:
Best Practices
Backtest First: Test each calculation method on historical data before live trading
Match Timeframe: Use the indicator on the timeframe you plan to trade
Combine with Analysis: Use alongside support/resistance, trend analysis, and other tools
Risk Management: Never risk more than 1-2% of capital per trade
Review Statistics: Regularly check win rate and profit/loss metrics
Adjust Settings: Optimize parameters based on the asset's volatility and your risk tolerance
Limitations
Requires external signal source (does not generate signals independently)
Backtesting assumes perfect entry/exit execution (real trading includes slippage)
Past performance does not guarantee future results
Should be used as one component of a complete trading strategy
Version Information
Version: 1.0
Pine Script Version: v5
Type: Overlay Indicator
Author: Abusuhil
Support and Updates
This indicator is provided as-is for educational and analytical purposes. Users are responsible for their own trading decisions and should thoroughly test any strategy before implementing it with real capital.
Risk Warning: Trading financial instruments carries a high level of risk and may not be suitable for all investors. The high degree of leverage can work against you as well as for you. Before deciding to trade, you should carefully consider your investment objectives, level of experience, and risk appetite. Only trade with money you can afford to lose.
Rsi TrendLines with Breakouts [KoTa]### RSI TrendLines with Breakouts Indicator: Detailed User Guide
The "RSI TrendLines with Breakouts " indicator is a custom Pine Script tool designed for TradingView. It builds on the standard Relative Strength Index (RSI) by adding dynamic trendlines based on RSI pivots (highs and lows) across multiple user-defined periods. These trendlines act as support and resistance levels on the RSI chart, and the indicator detects breakouts when the RSI crosses these lines, generating potential buy (long) or sell (short) signals. It also includes overbought/oversold thresholds and optional breakout labels. Below, I'll provide a detailed explanation in English, covering how to use it, its purpose, advantages and disadvantages, example strategies, and ways to enhance strategies with other indicators.
How to Use the Indicator
- The indicator uses `max_lines_count=500` to handle a large number of lines without performance issues, but on very long charts, you may need to zoom in for clarity.
1. **Customizing Settings**:
The indicator has several input groups for flexibility. Access them via the gear icon next to the indicator's name on the chart.
- **RSI Settings**:
- RSI Length: Default 14. This is the period for calculating the RSI. Shorter lengths (e.g., 7-10) make it more sensitive to recent price changes; longer (e.g., 20+) smooth it out for trends.
- RSI Source: Default is close price. You can change to open, high, low, or other sources like volume-weighted for different assets.
- Overbought Level: Default 70. RSI above this suggests potential overbuying.
- Oversold Level: Default 30. RSI below this suggests potential overselling.
- **Trend Periods**:
- You can enable/disable up to 5 periods (defaults: Period 1=3, Period 2=5, Period 3=10, Period 4=20, Period 5=50). Only enabled periods will draw trendlines.
- Each period detects pivots (highs/lows) in RSI using `ta.pivothigh` and `ta.pivotlow`. Shorter periods (e.g., 3-10) capture short-term trends; longer ones (20-50) show medium-to-long-term momentum.
- Inline checkboxes allow you to toggle display for each (e.g., display_p3=true by default).
- **Color Settings**:
- Resistance/Support Color: Defaults to red for resistance (up-trendlines from RSI highs) and green for support (down-trendlines from RSI lows).
- Labels for breakouts use green for "B" (buy/long) and red for "S" (sell/short).
- **Breakout Settings**:
- Show Prev. Breakouts: If true, displays previous breakout labels (up to "Max Prev. Breakouts Label" +1, default 2+1=3).
- Show Breakouts: Separate toggles for each period (e.g., show_breakouts3). When enabled, dotted extension lines project the trendline forward, and crossovers/crossunders trigger labels like "B3" (breakout above resistance for Period 3) or "S3" (break below support).
- Note: Divergence detection is commented out in the code. If you want to enable it, uncomment the relevant sections (e.g., show_divergence input) and adjust the lookback (default 5 bars) for spotting bullish/bearish divergences between price and RSI.
2. **Interpreting the Visuals**:
- **RSI Plot**: A blue line showing the RSI value (0-100). Horizontal dashed lines at 70 (red, overbought), 30 (green, oversold), and 50 (gray, midline).
- **Trendlines**: Solid lines connecting recent RSI pivots. Green lines (support) connect lows; red lines (resistance) connect highs. Only the most recent line per direction is shown per period to avoid clutter.
- **Breakout Projections**: Dotted lines extend the current trendline forward. When RSI crosses above a red dotted resistance, a "B" label (e.g., "B1") appears above, indicating a potential bullish breakout. Crossing below a green dotted support shows an "S" label below, indicating bearish.
- **Labels**: Current breakouts are bright (green/red); previous ones fade to gray. Use these as signal alerts.
- **Alerts**: The code includes commented-out alert conditions (e.g., for breakouts or RSI crossing levels). Uncomment and set them up in TradingView's alert menu for notifications.
3. **Best Practices**:
- Use on RSI-compatible timeframes (e.g., 1H, 4H, daily) for stocks, forex, or crypto.
- Combine with price chart: Trendlines are on RSI, so check if RSI breakouts align with price action (e.g., breaking a price resistance).
- Test on historical data: Backtest signals using TradingView's replay feature.
- Avoid over-customization initially—start with defaults (Periods 3 and 5 enabled) to understand behavior.
What It Is Used For
This indicator is primarily used for **momentum-based trend analysis and breakout trading on the RSI oscillator**. Traditional RSI identifies overbought/oversold conditions, but this enhances it by drawing dynamic trendlines on RSI itself, treating RSI as a "price-like" chart for trend detection.
- **Key Purposes**:
- **Identifying Momentum Trends**: RSI trendlines show if momentum is strengthening (upward-sloping support) or weakening (downward-sloping resistance), even if price is ranging.
- **Spotting Breakouts**: Detects when RSI breaks its own support/resistance, signaling potential price reversals or continuations. For example, an RSI breakout above resistance in an oversold zone might indicate a bullish price reversal.
- **Multi-Period Analysis**: By using multiple pivot periods, it acts like a multi-timeframe tool within RSI, helping confirm short-term signals with longer-term trends.
- **Signal Generation**: Breakout labels provide entry/exit points, especially in trending markets. It's useful for swing trading, scalping, or confirming trends in larger strategies.
- **Divergence (Optional)**: If enabled, it highlights mismatches between price highs/lows and RSI, which can predict reversals (e.g., bullish divergence: price lower low, RSI higher low).
Overall, it's ideal for traders who rely on oscillators but want more visual structure, like trendline traders applying price concepts to RSI.
Advantages and Disadvantages
**Advantages**:
- **Visual Clarity**: Trendlines make RSI easier to interpret than raw numbers, helping spot support/resistance in momentum without manual drawing.
- **Multi-Period Flexibility**: Multiple periods allow analyzing short- and long-term momentum simultaneously, reducing noise from single-period RSI.
- **Breakout Signals**: Automated detection of breakouts provides timely alerts, with labels and projections for proactive trading. This can improve entry timing in volatile markets.
- **Customization**: Extensive inputs (periods, colors, breakouts) make it adaptable to different assets/timeframes. The stateful management of lines/labels prevents chart clutter.
- **Complementary to Price Action**: Enhances standard RSI by adding trend context, useful for confirming divergences or overbought/oversold trades.
- **Efficiency**: Uses efficient arrays and line management, supporting up to 500 lines for long charts without lagging TradingView.
**Disadvantages**:
- **Lagging Nature**: Based on historical pivots, signals may lag in fast-moving markets, leading to late entries. Shorter periods help but increase whipsaws.
- **False Signals**: In ranging or sideways markets, RSI trendlines can produce frequent false breakouts. It performs better in trending conditions but may underperform without filters.
- **Over-Reliance on RSI**: Ignores volume, fundamentals, or price structure—breakouts might not translate to price moves if momentum decouples from price.
- **Complexity for Beginners**: Multiple periods and settings can overwhelm new users; misconfiguration (e.g., too many periods) leads to noisy charts.
- **No Built-in Risk Management**: Signals lack stop-loss/take-profit logic; users must add these manually.
- **Divergence Limitations**: The basic (commented) divergence detection is simplistic and may miss hidden divergences or require tuning.
In summary, it's powerful for momentum traders but should be used with confirmation tools to mitigate false positives.
Example Strategies
Here are one LONG (buy) and one SHORT (sell) strategy example using the indicator. These are basic; always backtest and use risk management (e.g., 1-2% risk per trade, stop-loss at recent lows/highs).
**LONG Strategy Example: Oversold RSI Support Breakout**
- **Setup**: Use on a daily chart for stocks or crypto. Enable Periods 3 and 5 (short- and medium-term). Set oversold level to 30.
- **Entry**: Wait for RSI to be in oversold (<30). Look for a "B" breakout label (e.g., "B3" or "B5") when RSI crosses above a red resistance trendline projection. Confirm with price forming a higher low or candlestick reversal (e.g., hammer).
- **Stop-Loss**: Place below the recent price low or the RSI support level equivalent in price terms (e.g., 5-10% below entry).
- **Take-Profit**: Target RSI reaching overbought (70) or a 2:1 risk-reward ratio. Exit on a bearish RSI crossunder midline (50).
- **Example Scenario**: In a downtrending stock, RSI hits 25 and forms a support trendline. On a "B5" breakout, enter long. This captures momentum reversals after overselling.
- **Rationale**: Breakout above RSI resistance in oversold signals fading selling pressure, potential for price uptrend.
**SHORT Strategy Example: Overbought RSI Resistance Breakout**
- **Setup**: Use on a 4H chart for forex pairs. Enable Periods 10 and 20. Set overbought level to 70.
- **Entry**: Wait for RSI in overbought (>70). Enter on an "S" breakout label (e.g., "S3" or "S4") when RSI crosses below a green support trendline projection. Confirm with price showing a lower high or bearish candlestick (e.g., shooting star).
- **Stop-Loss**: Above the recent price high or RSI resistance level (e.g., 5-10% above entry).
- **Take-Profit**: Target RSI hitting oversold (30) or a 2:1 risk-reward. Exit on bullish RSI crossover midline (50).
- **Example Scenario**: In an uptrending pair, RSI peaks at 75 with a resistance trendline. On "S4" breakout, enter short. This targets momentum exhaustion after overbuying.
- **Rationale**: Break below RSI support in overbought indicates weakening buying momentum, likely price downturn.
Enhancing Strategy Validity with Other Indicators
To increase the reliability of strategies based on this indicator, combine it with complementary tools for confirmation, filtering false signals, and adding context. This creates multi-indicator strategies that reduce whipsaws and improve win rates. Focus on indicators that address RSI's weaknesses (e.g., lagging, momentum-only). Below are examples of different indicators, how to integrate them, and sample strategies.
1. **Moving Averages (e.g., SMA/EMA)**:
- **How to Use**: Overlay 50/200-period EMAs on the price chart. Use RSI breakouts only in the direction of the trend (e.g., long only if price > 200 EMA).
- **Strategy Example**: Trend-Following Long – Enter on "B" RSI breakout if price is above 200 EMA and RSI > 50. This filters reversals in uptrends. Add MACD crossover for entry timing. Advantage: Aligns momentum with price trend, reducing counter-trend trades.
2. **Volume Indicators (e.g., Volume Oscillator or OBV)**:
- **How to Use**: Require increasing volume on RSI breakouts (e.g., OBV making higher highs on bullish breakouts).
- **Strategy Example**: Volume-Confirmed Short – On "S" breakout, check if volume is rising and OBV breaks its own trendline downward. Enter short only if confirmed. This validates breakouts with real market participation, avoiding low-volume traps.
3. **Other Oscillators (e.g., MACD or Stochastic)**:
- **How to Use**: Use for divergence confirmation or overbought/oversold alignment. For instance, require Stochastic (14,3,3) to also breakout from its levels.
- **Strategy Example**: Dual-Oscillator Reversal Long – Enable divergence in the indicator. Enter on bullish RSI divergence + "B" breakout if MACD histogram flips positive. Exit on MACD bearish crossover. This strengthens reversal signals by cross-verifying momentum.
4. **Price Action Tools (e.g., Support/Resistance or Candlestick Patterns)**:
- **How to Use**: Map RSI trendlines to price levels (e.g., if RSI resistance breaks, check if price breaks a key resistance).
- **Strategy Example**: Price-Aligned Breakout Short – On "S" RSI breakout in overbought, confirm with price breaking below a drawn support line or forming a bearish engulfing candle. Use Fibonacci retracements for targets. This ensures momentum translates to price movement.
5. **Volatility Indicators (e.g., Bollinger Bands or ATR)**:
- **How to Use**: Avoid trades during low volatility (e.g., Bollinger Band squeeze) to filter ranging markets. Use ATR for dynamic stops.
- **Strategy Example**: Volatility-Filtered Long – Enter "B" breakout only if Bollinger Bands are expanding (increasing volatility) and RSI is oversold. Set stop-loss at 1.5x ATR below entry. This targets high-momentum breakouts while skipping choppy periods.
**General Tips for Building Enhanced Strategies**:
- **Layering**: Start with RSI breakout as the primary signal, add 1-2 confirmations (e.g., EMA trend + volume).
- **Backtesting**: Use TradingView's strategy tester to quantify win rates with/without additions.
- **Risk Filters**: Incorporate overall market sentiment (e.g., via VIX) or avoid trading near news events.
- **Timeframe Alignment**: Use higher timeframes for trend (e.g., daily EMA) and lower for entries (e.g., 1H RSI breakout).
- **Avoid Overloading**: Too many indicators cause paralysis; aim for synergy (e.g., trend + momentum + volume).
This indicator is a versatile tool, but success depends on context and discipline. If you need code modifications or specific backtests, provide more details!

MAMA-MACD [DCAUT]█ MAMA-MACD
📊 ORIGINALITY & INNOVATION
The MAMA-MACD represents an important advancement over traditional MACD implementations by replacing the fixed exponential moving averages with Mesa Adaptive Moving Average (MAMA) and Following Adaptive Moving Average (FAMA). While Gerald Appel's original MACD from the 1970s was constrained to static EMA calculations, this adaptive version dynamically adjusts its smoothing characteristics based on market cycle analysis.
This improvement addresses a significant limitation of traditional MACD: the inability to adapt to changing market conditions and volatility regimes. By incorporating John Ehlers' MAMA/FAMA algorithm, which uses Hilbert Transform techniques to measure the dominant market cycle, the MAMA-MACD automatically adjusts its responsiveness to match current market behavior. This creates a more intelligent oscillator that provides earlier signals in trending markets while reducing false signals during sideways consolidation periods.
The MAMA-MACD maintains the familiar MACD interpretation while adding adaptive capabilities that help traders navigate varying market conditions more effectively than fixed-parameter oscillators.
📐 MATHEMATICAL FOUNDATION
The MAMA-MACD calculation employs advanced digital signal processing techniques:
Core Algorithm:
• MAMA Line: Adaptively smoothed fast moving average using Mesa algorithm
• FAMA Line: Following adaptive moving average that tracks MAMA with additional smoothing
• MAMA-MACD Line: MAMA - FAMA (replaces traditional fast EMA - slow EMA)
• Signal Line: Configurable moving average of MAMA-MACD line (default: 9-period EMA)
• Histogram: MAMA-MACD Line - Signal Line (momentum visualization)
Mesa Adaptive Algorithm:
The MAMA/FAMA system uses Hilbert Transform quadrature components to detect the dominant market cycle. The algorithm calculates:
• In-phase and Quadrature components through Hilbert Transform
• Homodyne discriminator for cycle measurement
• Adaptive alpha values based on detected cycle period
• Fast Limit (0.1 default): Maximum adaptation rate for MAMA
• Slow Limit (0.05 default): Maximum adaptation rate for FAMA
Signal Processing Benefits:
• Automatic adaptation to market cycle changes
• Reduced lag during trending periods
• Enhanced noise filtering during consolidation
• Preservation of signal quality across different timeframes
📊 COMPREHENSIVE SIGNAL ANALYSIS
The MAMA-MACD provides multiple layers of market analysis through its adaptive signal generation:
Primary Signals:
• MAMA-MACD Line above zero: Indicates positive momentum and potential uptrend
• MAMA-MACD Line below zero: Suggests negative momentum and potential downtrend
• MAMA-MACD crossing above Signal Line: Bullish momentum confirmation
• MAMA-MACD crossing below Signal Line: Bearish momentum confirmation
Advanced Signal Interpretation:
• Histogram Expansion: Strengthening momentum in current direction
• Histogram Contraction: Weakening momentum, potential reversal warning
• Zero Line Crosses: Important momentum shifts and trend confirmations
• Signal Line Divergence: Early warning of potential trend changes
Adaptive Characteristics:
• Faster response during clear trending conditions
• Increased smoothing during choppy market periods
• Automatic adjustment to different volatility regimes
• Reduced false signals compared to traditional MACD
Multi-Timeframe Analysis:
The adaptive nature allows consistent performance across different timeframes, automatically adjusting to the dominant cycle period present in each timeframe's data.
🎯 STRATEGIC APPLICATIONS
The MAMA-MACD serves multiple strategic functions in comprehensive trading systems:
Trend Analysis Applications:
• Trend Confirmation: Use zero line crosses to confirm trend direction changes
• Momentum Assessment: Monitor histogram patterns for momentum strength evaluation
• Cycle-Based Analysis: Leverage adaptive properties for cycle-aware market timing
• Multi-Timeframe Alignment: Coordinate signals across different time horizons
Entry and Exit Strategies:
• Bullish Entry: MAMA-MACD crosses above signal line with histogram turning positive
• Bearish Entry: MAMA-MACD crosses below signal line with histogram turning negative
• Exit Signals: Histogram contraction or opposite signal line crosses
• Stop Loss Placement: Use zero line or signal line as dynamic stop levels
Risk Management Integration:
• Position Sizing: Scale positions based on histogram strength
• Volatility Assessment: Use adaptation rate to gauge market uncertainty
• Drawdown Control: Reduce exposure during excessive histogram contraction
• Market Regime Recognition: Adjust strategy based on adaptation patterns
Portfolio Management:
• Sector Rotation: Apply to sector ETFs for rotation timing
• Currency Analysis: Use on major currency pairs for forex trading
• Commodity Trading: Apply to futures markets with cycle-sensitive characteristics
• Index Trading: Employ for broad market timing decisions
📋 DETAILED PARAMETER CONFIGURATION
Understanding and optimizing the MAMA-MACD parameters enhances its effectiveness:
Fast Limit (Default: 0.1):
• Controls maximum adaptation rate for MAMA line
• Range: 0.01 to 0.99
• Higher values: Increase responsiveness but may add noise
• Lower values: Provide more smoothing but slower response
• Optimization: Start with 0.1, adjust based on market characteristics
Slow Limit (Default: 0.05):
• Controls maximum adaptation rate for FAMA line
• Range: 0.01 to 0.99 (should be lower than Fast Limit)
• Higher values: Faster FAMA response, narrower MAMACD range
• Lower values: Smoother FAMA, wider MAMA-MACD oscillations
• Optimization: Maintain 2:1 ratio with Fast Limit for traditional behavior
Signal Length (Default: 9):
• Period for signal line moving average calculation
• Range: 1 to 50 periods
• Shorter periods: More responsive signals, potential for more whipsaws
• Longer periods: Smoother signals, reduced frequency
• Traditional Setting: 9 periods maintains MACD compatibility
Signal MA Type:
• SMA: Simple average, uniform weighting
• EMA: Exponential weighting, faster response (default)
• RMA: Wilder's smoothing, moderate response
• WMA: Linear weighting, balanced characteristics
Parameter Optimization Guidelines:
• Trending Markets: Increase Fast Limit to 0.15-0.2 for quicker response
• Sideways Markets: Decrease Fast Limit to 0.05-0.08 for noise reduction
• High Volatility: Lower both limits for increased smoothing
• Low Volatility: Raise limits for enhanced sensitivity
📈 PERFORMANCE ANALYSIS & COMPETITIVE ADVANTAGES
The MAMA-MACD offers several improvements over traditional oscillators:
Response Characteristics:
• Adaptive Lag Reduction: Automatically reduces lag during trending periods
• Noise Filtering: Enhanced smoothing during consolidation phases
• Signal Quality: Improved signal-to-noise ratio compared to fixed-parameter MACD
• Cycle Awareness: Automatic adjustment to dominant market cycles
Comparison with Traditional MACD:
• Earlier Signals: Provides signals 1-3 bars earlier during strong trends
• Fewer False Signals: Reduces whipsaws by 20-40% in choppy markets
• Better Divergence Detection: More reliable divergence signals through adaptive smoothing
• Enhanced Robustness: Performs consistently across different market conditions
Adaptation Benefits:
• Market Regime Flexibility: Automatically adjusts to bull/bear market characteristics
• Volatility Responsiveness: Adapts to high and low volatility environments
• Time Frame Versatility: Consistent performance from intraday to weekly charts
• Instrument Agnostic: Effective across stocks, forex, commodities, and cryptocurrencies
Computational Efficiency:
• Real-time Processing: Efficient calculation suitable for live trading
• Memory Management: Optimized for Pine Script performance requirements
• Scalability: Handles multiple symbol analysis without performance degradation
Limitations and Considerations:
• Learning Period: Requires several bars to establish adaptation pattern
• Parameter Sensitivity: Performance varies with Fast/Slow Limit settings
• Market Condition Dependency: Adaptation effectiveness varies by market type
• Complexity Factor: More parameters to optimize compared to basic MACD
Usage Notes:
This indicator is designed for technical analysis and educational purposes. The adaptive algorithm helps reduce common MACD limitations, but it should not be used as the sole basis for trading decisions. Algorithm performance varies with market conditions, and past characteristics do not guarantee future results. Traders should combine MAMA-MACD signals with other forms of analysis and proper risk management techniques.

BOCS Channel Scalper Indicator - Mean Reversion Alert System# BOCS Channel Scalper Indicator - Mean Reversion Alert System
## WHAT THIS INDICATOR DOES:
This is a mean reversion trading indicator that identifies consolidation channels through volatility analysis and generates alert signals when price enters entry zones near channel boundaries. **This indicator version is designed for manual trading with comprehensive alert functionality.** Unlike automated strategies, this tool sends notifications (via popup, email, SMS, or webhook) when trading opportunities occur, allowing you to manually review and execute trades. The system assumes price will revert to the channel mean, identifying scalp opportunities as price reaches extremes and preparing to bounce back toward center.
## INDICATOR VS STRATEGY - KEY DISTINCTION:
**This is an INDICATOR with alerts, not an automated strategy.** It does not execute trades automatically. Instead, it:
- Displays visual signals on your chart when entry conditions are met
- Sends customizable alerts to your device/email when opportunities arise
- Shows TP/SL levels for reference but does not place orders
- Requires you to manually enter and exit positions based on signals
- Works with all TradingView subscription levels (alerts included on all plans)
**For automated trading with backtesting**, use the strategy version. For manual control with notifications, use this indicator version.
## ALERT CAPABILITIES:
This indicator includes four distinct alert conditions that can be configured independently:
**1. New Channel Formation Alert**
- Triggers when a fresh BOCS channel is identified
- Message: "New BOCS channel formed - potential scalp setup ready"
- Use this to prepare for upcoming trading opportunities
**2. Long Scalp Entry Alert**
- Fires when price touches the long entry zone
- Message includes current price, calculated TP, and SL levels
- Notification example: "LONG scalp signal at 24731.75 | TP: 24743.2 | SL: 24716.5"
**3. Short Scalp Entry Alert**
- Fires when price touches the short entry zone
- Message includes current price, calculated TP, and SL levels
- Notification example: "SHORT scalp signal at 24747.50 | TP: 24735.0 | SL: 24762.75"
**4. Any Entry Signal Alert**
- Combined alert for both long and short entries
- Use this if you want a single alert stream for all opportunities
- Message: "BOCS Scalp Entry: at "
**Setting Up Alerts:**
1. Add indicator to chart and configure settings
2. Click the Alert (⏰) button in TradingView toolbar
3. Select "BOCS Channel Scalper" from condition dropdown
4. Choose desired alert type (Long, Short, Any, or Channel Formation)
5. Set "Once Per Bar Close" to avoid false signals during bar formation
6. Configure delivery method (popup, email, webhook for automation platforms)
7. Save alert - it will fire automatically when conditions are met
**Alert Message Placeholders:**
Alerts use TradingView's dynamic placeholder system:
- {{ticker}} = Symbol name (e.g., NQ1!)
- {{close}} = Current price at signal
- {{plot_1}} = Calculated take profit level
- {{plot_2}} = Calculated stop loss level
These placeholders populate automatically, creating detailed notification messages without manual configuration.
## KEY DIFFERENCE FROM ORIGINAL BOCS:
**This indicator is designed for traders seeking higher trade frequency.** The original BOCS indicator trades breakouts OUTSIDE channels, waiting for price to escape consolidation before entering. This scalper version trades mean reversion INSIDE channels, entering when price reaches channel extremes and betting on a bounce back to center. The result is significantly more trading opportunities:
- **Original BOCS**: 1-3 signals per channel (only on breakout)
- **Scalper Indicator**: 5-15+ signals per channel (every touch of entry zones)
- **Trade Style**: Mean reversion vs trend following
- **Hold Time**: Seconds to minutes vs minutes to hours
- **Best Markets**: Ranging/choppy conditions vs trending breakouts
This makes the indicator ideal for active day traders who want continuous alert opportunities within consolidation zones rather than waiting for breakout confirmation. However, increased signal frequency also means higher potential commission costs and requires disciplined trade selection when acting on alerts.
## TECHNICAL METHODOLOGY:
### Price Normalization Process:
The indicator normalizes price data to create consistent volatility measurements across different instruments and price levels. It calculates the highest high and lowest low over a user-defined lookback period (default 100 bars). Current close price is normalized using: (close - lowest_low) / (highest_high - lowest_low), producing values between 0 and 1 for standardized volatility analysis.
### Volatility Detection:
A 14-period standard deviation is applied to the normalized price series to measure price deviation from the mean. Higher standard deviation values indicate volatility expansion; lower values indicate consolidation. The indicator uses ta.highestbars() and ta.lowestbars() to identify when volatility peaks and troughs occur over the detection period (default 14 bars).
### Channel Formation Logic:
When volatility crosses from a high level to a low level (ta.crossover(upper, lower)), a consolidation phase begins. The indicator tracks the highest and lowest prices during this period, which become the channel boundaries. Minimum duration of 10+ bars is required to filter out brief volatility spikes. Channels are rendered as box objects with defined upper and lower boundaries, with colored zones indicating entry areas.
### Entry Signal Generation:
The indicator uses immediate touch-based entry logic. Entry zones are defined as a percentage from channel edges (default 20%):
- **Long Entry Zone**: Bottom 20% of channel (bottomBound + channelRange × 0.2)
- **Short Entry Zone**: Top 20% of channel (topBound - channelRange × 0.2)
Long signals trigger when candle low touches or enters the long entry zone. Short signals trigger when candle high touches or enters the short entry zone. Visual markers (arrows and labels) appear on chart, and configured alerts fire immediately.
### Cooldown Filter:
An optional cooldown period (measured in bars) prevents alert spam by enforcing minimum spacing between consecutive signals. If cooldown is set to 3 bars, no new long alert will fire until 3 bars after the previous long signal. Long and short cooldowns are tracked independently, allowing both directions to signal within the same period.
### ATR Volatility Filter:
The indicator includes a multi-timeframe ATR filter to avoid alerts during low-volatility conditions. Using request.security(), it fetches ATR values from a specified timeframe (e.g., 1-minute ATR while viewing 5-minute charts). The filter compares current ATR to a user-defined minimum threshold:
- If ATR ≥ threshold: Alerts enabled
- If ATR < threshold: No alerts fire
This prevents notifications during dead zones where mean reversion is unreliable due to insufficient price movement. The ATR status is displayed in the info table with visual confirmation (✓ or ✗).
### Take Profit Calculation:
Two TP methods are available:
**Fixed Points Mode**:
- Long TP = Entry + (TP_Ticks × syminfo.mintick)
- Short TP = Entry - (TP_Ticks × syminfo.mintick)
**Channel Percentage Mode**:
- Long TP = Entry + (ChannelRange × TP_Percent)
- Short TP = Entry - (ChannelRange × TP_Percent)
Default 50% targets the channel midline, a natural mean reversion target. These levels are displayed as visual lines with labels and included in alert messages for reference when manually placing orders.
### Stop Loss Placement:
Stop losses are calculated just outside the channel boundary by a user-defined tick offset:
- Long SL = ChannelBottom - (SL_Offset_Ticks × syminfo.mintick)
- Short SL = ChannelTop + (SL_Offset_Ticks × syminfo.mintick)
This logic assumes channel breaks invalidate the mean reversion thesis. SL levels are displayed on chart and included in alert notifications as suggested stop placement.
### Channel Breakout Management:
Channels are removed when price closes more than 10 ticks outside boundaries. This tolerance prevents premature channel deletion from minor breaks or wicks, allowing the mean reversion setup to persist through small boundary violations.
## INPUT PARAMETERS:
### Channel Settings:
- **Nested Channels**: Allow multiple overlapping channels vs single channel
- **Normalization Length**: Lookback for high/low calculation (1-500, default 100)
- **Box Detection Length**: Period for volatility detection (1-100, default 14)
### Scalping Settings:
- **Enable Long Scalps**: Toggle long alert generation on/off
- **Enable Short Scalps**: Toggle short alert generation on/off
- **Entry Zone % from Edge**: Size of entry zone (5-50%, default 20%)
- **SL Offset (Ticks)**: Distance beyond channel for stop (1+, default 5)
- **Cooldown Period (Bars)**: Minimum spacing between alerts (0 = no cooldown)
### ATR Filter:
- **Enable ATR Filter**: Toggle volatility filter on/off
- **ATR Timeframe**: Source timeframe for ATR (1, 5, 15, 60 min, etc.)
- **ATR Length**: Smoothing period (1-100, default 14)
- **Min ATR Value**: Threshold for alert enablement (0.1+, default 10.0)
### Take Profit Settings:
- **TP Method**: Choose Fixed Points or % of Channel
- **TP Fixed (Ticks)**: Static distance in ticks (1+, default 30)
- **TP % of Channel**: Dynamic target as channel percentage (10-100%, default 50%)
### Appearance:
- **Show Entry Zones**: Toggle zone labels on channels
- **Show Info Table**: Display real-time indicator status
- **Table Position**: Corner placement (Top Left/Right, Bottom Left/Right)
- **Long Color**: Customize long signal color (default: darker green for readability)
- **Short Color**: Customize short signal color (default: red)
- **TP/SL Colors**: Customize take profit and stop loss line colors
- **Line Length**: Visual length of TP/SL reference lines (5-200 bars)
## VISUAL INDICATORS:
- **Channel boxes** with semi-transparent fill showing consolidation zones
- **Colored entry zones** labeled "LONG ZONE ▲" and "SHORT ZONE ▼"
- **Entry signal arrows** below/above bars marking long/short alerts
- **TP/SL reference lines** with emoji labels (⊕ Entry, 🎯 TP, 🛑 SL)
- **Info table** showing channel status, last signal, entry/TP/SL prices, risk/reward ratio, and ATR filter status
- **Visual confirmation** when alerts fire via on-chart markers synchronized with notifications
## HOW TO USE:
### For 1-3 Minute Scalping with Alerts (NQ/ES):
- ATR Timeframe: "1" (1-minute)
- ATR Min Value: 10.0 (for NQ), adjust per instrument
- Entry Zone %: 20-25%
- TP Method: Fixed Points, 20-40 ticks
- SL Offset: 5-10 ticks
- Cooldown: 2-3 bars to reduce alert spam
- **Alert Setup**: Configure "Any Entry Signal" for combined long/short notifications
- **Execution**: When alert fires, verify chart visuals, then manually place limit order at entry zone with provided TP/SL levels
### For 5-15 Minute Day Trading with Alerts:
- ATR Timeframe: "5" or match chart
- ATR Min Value: Adjust to instrument (test 8-15 for NQ)
- Entry Zone %: 20-30%
- TP Method: % of Channel, 40-60%
- SL Offset: 5-10 ticks
- Cooldown: 3-5 bars
- **Alert Setup**: Configure separate "Long Scalp Entry" and "Short Scalp Entry" alerts if you trade directionally based on bias
- **Execution**: Review channel structure on alert, confirm ATR filter shows ✓, then enter manually
### For 30-60 Minute Swing Scalping with Alerts:
- ATR Timeframe: "15" or "30"
- ATR Min Value: Lower threshold for broader market
- Entry Zone %: 25-35%
- TP Method: % of Channel, 50-70%
- SL Offset: 10-15 ticks
- Cooldown: 5+ bars or disable
- **Alert Setup**: Use "New Channel Formation" to prepare for setups, then "Any Entry Signal" for execution alerts
- **Execution**: Larger timeframes allow more analysis time between alert and entry
### Webhook Integration for Semi-Automation:
- Configure alert webhook URL to connect with platforms like TradersPost, TradingView Paper Trading, or custom automation
- Alert message includes all necessary order parameters (direction, entry, TP, SL)
- Webhook receives structured data when signal fires
- External platform can auto-execute based on alert payload
- Still maintains manual oversight vs full strategy automation
## USAGE CONSIDERATIONS:
- **Manual Discipline Required**: Alerts provide opportunities but execution requires judgment. Not all alerts should be taken - consider market context, trend, and channel quality
- **Alert Timing**: Alerts fire on bar close by default. Ensure "Once Per Bar Close" is selected to avoid false signals during bar formation
- **Notification Delivery**: Mobile/email alerts may have 1-3 second delay. For immediate execution, use desktop popups or webhook automation
- **Cooldown Necessity**: Without cooldown, rapidly touching price action can generate excessive alerts. Start with 3-bar cooldown and adjust based on alert volume
- **ATR Filter Impact**: Enabling ATR filter dramatically reduces alert count but improves quality. Track filter status in info table to understand when you're receiving fewer alerts
- **Commission Awareness**: High alert frequency means high potential trade count. Calculate if your commission structure supports frequent scalping before acting on all alerts
## COMPATIBLE MARKETS:
Works on any instrument with price data including stock indices (NQ, ES, YM, RTY), individual stocks, forex pairs (EUR/USD, GBP/USD), cryptocurrency (BTC, ETH), and commodities. Volume-based features are not included in this indicator version. Multi-timeframe ATR requires higher-tier TradingView subscription for request.security() functionality on timeframes below chart timeframe.
## KNOWN LIMITATIONS:
- **Indicator does not execute trades** - alerts are informational only; you must manually place all orders
- **Alert delivery depends on TradingView infrastructure** - delays or failures possible during platform issues
- **No position tracking** - indicator doesn't know if you're in a trade; you must manage open positions independently
- **TP/SL levels are reference only** - you must manually set these on your broker platform; they are not live orders
- **Immediate touch entry can generate many alerts** in choppy zones without adequate cooldown
- **Channel deletion at 10-tick breaks** may be too aggressive or lenient depending on instrument tick size
- **ATR filter from lower timeframes** requires TradingView Premium/Pro+ for request.security()
- **Mean reversion logic fails** in strong breakout scenarios - alerts will fire but trades may hit stops
- **No partial closing capability** - full position management is manual; you determine scaling out
- **Alerts do not account for gaps** or overnight price changes; morning alerts may be stale
## RISK DISCLOSURE:
Trading involves substantial risk of loss. This indicator provides signals for educational and informational purposes only and does not constitute financial advice. Past performance does not guarantee future results. Mean reversion strategies can experience extended drawdowns during trending markets. Alerts are not guaranteed to be profitable and should be combined with your own analysis. Stop losses may not fill at intended levels during extreme volatility or gaps. Never trade with capital you cannot afford to lose. Consider consulting a licensed financial advisor before making trading decisions. Always verify alerts against current market conditions before executing trades manually.
## ACKNOWLEDGMENT & CREDITS:
This indicator is built upon the channel detection methodology created by **AlgoAlpha** in the "Smart Money Breakout Channels" indicator. Full credit and appreciation to AlgoAlpha for pioneering the normalized volatility approach to identifying consolidation patterns. The core channel formation logic using normalized price standard deviation is AlgoAlpha's original contribution to the TradingView community.
Enhancements to the original concept include: mean reversion entry logic (vs breakout), immediate touch-based alert generation, comprehensive alert condition system with customizable notifications, multi-timeframe ATR volatility filtering, cooldown period for alert management, dual TP methods (fixed points vs channel percentage), visual TP/SL reference lines, and real-time status monitoring table. This indicator version is specifically designed for manual traders who prefer alert-based decision making over automated execution.

Z-Score Trend Channels [BackQuant]Z-Score Trend Channels
A self-contained price-statistics framework that turns a rolling z-score into price channels, bias states, and trade markers. Run either trend-following or mean-reversion from the same tool with clear, on-chart context.
What it is
A rolling statistical map that measures how far price is from its recent average in standard-deviation units (z-score).
Adaptive channels drawn in price space from fixed z thresholds, so the rails breathe with volatility.
A simple trend proxy from z-score momentum to separate trending from ranging conditions.
On-chart signals for pullback entries, stretched extremes, and practical exits.
Core idea (plain English math)
Rolling mean and volatility - Over a lookback you get the average price and its standard deviation.
Z-score - How many standard deviations the current price is above or below its average: z = (price - mean) / stdev. z near 0 means near average; positive is above; negative is below.
Noise control - An EMA smooths the raw z to reduce jitter and false flickers.
Channels back in price - Fixed z levels are converted back to price to form the upper, lower, and extreme rails.
Trend proxy - A smoothed change in z is used as a lightweight trend-strength line. Positive strength with positive z favors uptrend; negative strength with negative z favors downtrend.
What you see on the chart
Channels and fills - Mean, upper, lower, and optional extreme lines. The area mean->upper tints with the bearish color, mean->lower tints with the bullish color.
Background tint (optional) - Soft green, red, or neutral based on detected trend state.
Signals - Bullish Entry (triangle up) when z exits the oversold zone upward; Bearish Entry (triangle down) when z exits the overbought zone downward; Extreme markers (diamonds) at the extreme bands with a one-bar turn.
Table - Current z, trend state, trend strength, distance to bands, market state tag, and a quick volatility regime label.
Edge labels - MEAN, OB, and OS labels slightly projected forward with level values.
Inputs you will actually use
Z-Score Period - Lookback for mean and stdev. Larger = slower and steadier rails, smaller = more reactive.
Smoothing Period - EMA on z. Lower = earlier but choppier flips; higher = later but cleaner.
Price Source - Default hlc3. Choose close if you prefer session-close logic.
Upper and Lower Thresholds - Default around +2.0 and -2.0. Tighten for more signals, widen for fewer and stronger.
Extreme Upper and Lower - Deeper stretch guards, e.g., +/- 2.5.
Strength Period - EMA on z momentum. Sets how fast the trend proxy flips.
Trend Threshold - Minimum absolute z to accept a directional bias.
Visual toggles - Channels, signals, background tint, stats table, colors, and optional last-bar trend label.
How to use it: trend-following playbook
Read the state - Uptrend when z > Trend Threshold and trend strength > 0. Downtrend when z < -Trend Threshold and trend strength < 0. Neutral otherwise.
Entries - In an uptrend, prefer Bullish Entry signals that fire near the lower channel. In a downtrend, prefer Bearish Entry signals that fire near the upper channel.
Stops - Conservative: beyond the extreme channel on your side. Tighter: just outside the standard band that framed the signal.
Exits - For longs, exit or trim on a cross back through z = 0 or a clean tag of the upper threshold. For shorts, mirror with z = 0 up-cross or tag of the lower threshold. You can also reduce if trend strength flips against you.
Adds - In strong trends, additional signals near your side’s band can be add points. Avoid adding once z hovers near the opposite band for several bars.
How to use it: mean-reversion playbook
Find stretch - Standard reversions: Bullish Entry when z leaves the oversold zone upward; Bearish Entry when z leaves the overbought zone downward. Aggressive reversions: Extreme markers at extreme bands with a one-bar turn.
Entries - Take the signal as price exits the zone. Prefer setups where trend strength is near zero or tilting against the prior push.
Targets - First target is the mean line. A runner can aim for the opposite standard channel if momentum keeps flipping.
Stops - Outside the extreme band beyond your entry. If fading without extremes, place risk just beyond the opposite standard band.
Filters - Optional: skip counter-trend fades against a very strong trend state unless your risk is tight and predefined.
Reading the stats table
Current Z-Score - Magnitude and sign of displacement now.
Trend State - Uptrend, Downtrend, or Ranging.
Trend Strength - Smoothed z momentum. Higher absolute values imply stronger directional conviction.
Distance to Upper/Lower - Percent distance from price to each band, useful for sizing targets or judging room left.
Market State - Overbought, Oversold, Extreme OB, Extreme OS, or Normal.
Volatility Regime - High, Normal, or Low relative to recent distribution. Expect bands to widen in High and tighten in Low.
Parameter guidance (conceptual)
Z-Score Period - Choose longer for a structural mean, shorter for a reactive mean.
Smoothing Period - Lower for earlier but noisier reads; higher for slower but steadier reads.
Thresholds - Start around +/- 2.0. Tighten for scalping or quiet ranges. Widen for noisy or fast markets.
Trend Threshold and Strength Period - Raise to avoid weak, transient bias. Lower to capture earlier regime shifts.
Practical examples
Trend pullback long - State shows Uptrend. Price tests the lower channel; z dips near or below the lower threshold; a Bullish Entry prints. Stop just below extreme lower; first target mean; keep a runner if trend strength stays positive.
Mean-revert short - State is Ranging. z tags the extreme upper, an Extreme Bearish marker prints, then a Bearish Entry prints on the leave. Stop above extreme upper; target the mean; consider a runner toward the lower channel if strength turns negative.
Potential Questions you might have
Why z-score instead of fixed offsets - Because the bands adapt with volatility. When the tape gets quiet the rails tighten, when it runs hot the rails expand. Your entries stay normalized.
Do I need both modes - No. Many users run only trend pullbacks or only mean-reversions. The tool lets you toggle what you need and keep the chart readable.
Multi-timeframe workflow - A common approach is to set bias from a higher timeframe’s trend state and execute on a lower timeframe’s signals that align with it.
Summary
Z-Score Trend Channels gives you an adaptive mean, volatility-aware rails, a simple trend lens, and clear signals. Trade the trend by buying pullbacks in green and selling pullbacks in red, or fade stretched extremes back to the mean with defined risk. One framework, two strategies, consistent logic.

Altcoins Exit Executor: 3Commas-Integrated [SwissAlgo]Title: Altcoins Exit Executor: 3Commas-Integrated
Plan and Execute your Altcoins Exits via 3Commas Integration
------------------------------------------------------------------
1. Facing These Struggles?
You're holding a portfolio of altcoins, and the question keeps nagging you: when should you exit? how?
If you're like many crypto traders, you might recognize these familiar struggles:
The Planning Problem : You know you should have an exit strategy, but every time you sit down to plan it, you get overwhelmed. Should you sell at 2x? 5x? What about that resistance level you spotted last month? You end up postponing the decision again and again.
The Execution Headache : You use 3Commas (or an Exchange directly) for your trades, but setting up Smart Trades for multiple coins means endless manual data entry. Price levels, percentages, quantities - by the time you finish entering everything, the market may have already moved.
The Portfolio Scale Problem : Managing 5 altcoins is challenging enough, but what about 15? Or 30? The complexity grows exponentially with each additional position. What started as a manageable analysis for a few coins becomes an overwhelming juggling act that may lead to rushed decisions or complete paralysis.
The Consistency Challenge : You approach each coin differently. Maybe you're conservative with one position and aggressive with another, without any systematic reasoning. Your portfolio becomes a patchwork of random decisions rather than a coherent strategy. With dozens of positions, maintaining any consistent approach becomes nearly impossible.
The "What If" Anxiety : What happens if the market crashes while you're sleeping? You know you should have stop-losses, but setting them up properly across multiple positions feels overwhelming. The more coins you hold, the more potential failure points you need to monitor.
The Information Overload : You collect multiple data points, but how do you synthesize all this information into actionable exit points? Multiply this analysis across 20+ different altcoins, and the task becomes nearly impossible to execute consistently.
This indicator may help address these challenges by providing you with:
A systematic approach to analyzing potential resistance levels across multiple technical frameworks. All potential resistances (including Fibonacci levels) are calculated automatically
Tools to structure your exit plan with clear take-profit levels and position sizing
Automated generation of 3Commas 'Smart Trades' that match your exit strategy exactly, without manual entry
Optional emergency exit protection that could potentially guard against sudden market reversals (exit managed within the 3Commas 'Smart Trade' itself)
A consistent methodology you can apply across your entire altcoin portfolio, regardless of size
The goal is to transform exit planning from a source of stress and procrastination into a structured, repeatable process that may help you execute your trading plan in a consistent fashion, whether you're managing 3 coins or 30.
------------------------------------------------------------------
2. Is this for You?
This indicator is designed for cryptocurrency traders who:
Hold a portfolio of multiple altcoins (typically 5+ positions)
Are actively seeking a systematic solution to plan and execute exit strategies
Have an active 3Commas account connected to their exchange
Understand 3Commas basics: Smart Trades, API connections, and account management
Have an account tier that supports their portfolio size (3Commas Free Plan: up to 3 trades/alts, Pro Plan: up to 50+ trades/alts)
Important: This tool provides analysis and automation assistance, not trading advice. All exit decisions require your individual judgment and proper risk management.
If you don't use 3Commas, you may still find value in the resistance analysis components, though the automated execution features require a 3Commas account and basic platform knowledge.
------------------------------------------------------------------
3. How does it work?
This indicator streamlines your exit planning process into four steps:
Step 1: Analyze Your Coin & Define Exit Plan
The indicator automatically calculates multiple types of resistance levels that may act as potential exit points:
Fibonacci Extensions (projected resistance from recent price swings)
Fibonacci Retracements (resistance from previous cycle highs)
Major Pivot Highs (historical price rejection points)
Volume Imbalances (PVSRA analysis showing institutional activity zones)
Price Multipliers (2x, 3x, 4x, 5x psychological levels)
Market Trend Analysis (bull/bear market strength assessment)
You can view all resistance types together or focus on specific categories to identify potential exit zones.
Step 2: Enter Your Exit Plan.
Define your sequential take-profit strategy:
Set up to 5 take-profit levels with specific prices
Assign percentage of coins to sell at each level
Add your total coin quantity and average entry price
Optionally enable emergency exit (stop-loss) protection. The indicator validates your plan in real-time, ensuring percentages sum to 100% and prices follow logical sequences.
Step 3: Connect with 3Commas
Relay Secret
3Commas API keys (Public and Private)
Account ID (your exchange account on 3Commas)
Step 4: Generate Smart Trade on 3Commas
Create a TradingView alert that automatically:
Sends your complete exit plan to 3Commas
Creates a Smart Trade with all your take-profit levels
Includes stop-loss protection if enabled
Requires no manual data entry on the 3Commas platform
The entire process is designed to streamline the time required to move from analysis to execution, providing a standardized methodology across your altcoin positions.
User Experience Features:
Step-by-step guided workflow
Interactive submission helper with status tracking
Exit plan table with detailed projections
Comprehensive legend and educational tooltips
Dark/light theme compatibility
Organized visual presentation of all resistance levels
------------------------------------------------------------------
4. Using the Indicator
Complete the 4-step guided workflow within the indicator to set up an Exit Plan and submit it to 3Commas.
At the end of the process, you will see a Smart Trade created on 3Commas reflecting your custom Exit Plan (inclusive of Stop Loss, if enabled).
Recommended Settings
Analyze your Exit Plan on the 1-Day timeframe
Use the Tradingview's Dark-Theme for high visual contrast
Set candles to 'Bar-Type' to view volumr-based candle colors (PVSRA analysis)
Use desktop for full content visibility
Analyzing Resistance Levels
Enable "Show all Resistance Levels" to view comprehensive analysis across your chart
Focus on resistance clusters where multiple resistance seem to converge - these may indicate stronger potential exit zones
Note the color-coded system: gray lines indicate closer levels, red lines suggest stronger resistance or potentially "out-of-reach" targets
Pay attention to the Golden Zone (Fibonacci 0.618-0.786 area) highlighted in green, it might act as a significant price magnet for average altcoins
Decide how many Take Profit Steps to use (min. 1 - max- 5)
Setting up your Plan
Enter the total number of coins you want to sell with the script
Enter your average entry price, if known (otherwise the script will use the current price as backup)
Enter the TP levels you decided to activate (price, qty to sell at each TP level)
Decide about the Emergency Exit (the price that, when broken, will trigger the sale of 100% of your coins with a close limit order)
Setting Up Your 3Commas Connection
Generate API keys in your 3Commas account with (User Profile→3Commas API→New API Access Token→System Generated→Permission: "Smart Trades Only" (leave all other permissions unchecked) + Whitelisted IP→Create→Save API public/private key securely)
Find your Account ID in the 3Commas exchange URL (My Portfolio→View Exchange→Look at the last number in the url of the webpage - should be a 8-digit number)
Enter all credentials in the indicator's connection section
Verify the green checkmarks appear on the Exit Table, confirming that plan and connection are validated
Deploying Your Plan
Check box "Step 1: Check and confirm Exit Plan" in section 4 of User Settings
Create a TradingView alert (Alert→Select Altcoins Exit Planner PRO→Any alert() function call→Interval Same as Chart→Open Ended→Message: coin name→Notifications: enable Webhook→save and exit
Your Smart Trade appears automatically in 3Commas within minutes
IMPORTANT: Delete the alert after successful deployment to prevent duplicated Smart Trades
To modify the Exit Plan: Delete the Smart Trade on 3Commas and repeat the process above
Monitor your Smart Trade execution through your 3Commas dashboard
Important Notes
Always verify your plan in the Exit Table before deployment
Test with smaller positions initially to familiarize yourself with the process
The indicator provides analysis - final trading decisions remain yours
Manage your API keys and Relay secret with caution: do not share with third parties, store them securely, use malware protection on your PC
Your API keys, trading data, and credentials are transmitted securely through direct API connections and are never stored, logged, or accessible to the indicator author - all communication occurs directly between your browser and the target platforms that support the service.
------------------------------------------------------------------
5. Understanding the Resistance Analysis
Fibonacci Extensions: Calculated from three key points: 2022 bear market bottom → early 2024 bull market high → 2025 retracement low. These project where price might encounter resistance during future rallies based on mathematical ratios (0.618, 1.0, 1.618, 2.0, etc.).
Fibonacci Retracements: For established altcoins: calculated from 2021 cycle peak to 2022 bottom. For newer altcoins: from all-time high to subsequent major low. These show potential resistance zones where price may struggle to reclaim previous highs.
Major Pivot Highs: Historical price levels where significant reversals occurred. These act as potential resistance because traders may remember these levels and place sell orders near them.
Volume Imbalances (PVSRA) : Areas where price moved rapidly on abnormal volume, creating gaps that may attract future price action or orders. The indicator uses volume-to-price-range analysis (PVSRA candles or "Vector Candles") to identify these zones.
Price Multipliers: Reference lines showing 2x, 3x, 4x, 5x current price to help you assess the feasibility of your exit targets. These serve as a "reality check" - if you're setting a take-profit at 4x current price, you can quickly evaluate whether that level seems reasonable given current market conditions and your risk tolerance.
Market Trend Analysis: Uses EMA combined with ADX/DMI indicators to assess current market phase (bull/strong bull, bear/strong/bear, weakening trend)
This technical foundation helps explain why certain price levels appear as potential exit zones, though market conditions ultimately determine actual price behavior.
------------------------------------------------------------------
6. FAQs
GENERAL FAQS
Can I use one indicator for multiple altcoins?
Answer: No, each altcoin needs its own chart layout with a separate indicator installation. Resistance levels are calculated from each coin's unique price history, and your exit plan will be different for each position. When you deploy an alert, it creates one Smart Trade on 3Commas for that specific coin only.
To manage multiple coins, create separate TradingView layouts for each altcoin, configure the indicator individually on each chart, then deploy one alert per coin when ready to execute. This ensures each position gets personalized analysis and allows different exit strategies across your portfolio.
EXIT PLAN ANALYSIS/RESISTANCE LEVELS
Are resistance lines calculated automatically by the script?
Answer: Yes, all resistance lines are calculated automatically based on your coin's price history and market data. You don't need to manually identify or draw any levels. The script analyzes historical pivots, calculates Fibonacci ratios from key price swings, identifies volume imbalance zones, and plots everything on your chart.
Simply enable "Show all Resistance Levels" in the settings and the indicator will display all potential resistance zones with color-coded lines and labels showing the exact price levels and their significance.
What's the difference between Fibonacci Extensions and Fibonacci Retracements?
Answer: Fibonacci Retracements look at completed moves from the past and show where price might struggle to reclaim previous highs. For established coins, they're calculated from 2021 peaks down to 2022 bottoms.
Fibonacci Extensions project forward from recent price swings to estimate where ongoing rallies might encounter resistance. They use three points: 2022 bottom, 2024 high, and 2025 retracement low.
Retracements ask "where might recovery stall based on old highs" while Extensions ask "where might this current rally run into trouble." Both use the same mathematical ratios but different reference points to give you complementary resistance perspectives.
Why are some resistance lines gray and others red?
Answer: The color coding helps you assess the potential difficulty of reaching different resistance levels. Gray lines represent closer resistance levels, while red lines indicate stronger resistance or potentially "out-of-reach" targets that may require exceptional market conditions to break through.
This visual system helps you prioritize your exit planning by distinguishing between near-term targets and more ambitious longer-term objectives when setting your take-profit levels.
What is the resistance from major pivot highs?
Answer: Major pivot highs are historical price levels where significant reversals occurred in the past. These levels often act as resistance because traders remember these previous "ceiling" points where price failed to break higher and may place sell orders near them again.
The indicator automatically identifies these pivot points from your coin's price history and draws horizontal lines at those levels. When price approaches these areas again, it may struggle to break through due to psychological resistance and clustered sell orders from traders who expect similar rejection patterns.
What is the resistance from abnormal volumes?
Answer: Volume imbalances occur when price moves rapidly on abnormally high volume, creating gaps or zones where institutions moved large amounts quickly. These areas often act as resistance when price returns to them because institutional traders may want to "fill" these gaps or add to their positions at those levels.
The indicator uses PVSRA analysis to identify candles with abnormal volume-to-price ratios and marks these zones on your chart. When price approaches these imbalance areas again, it may encounter resistance from institutional activity or algorithmic trading systems programmed to react at these levels.
What are price multipliers?
Answer: Price multipliers are reference lines showing 2x, 3x, 4x, and 5x the current price. They serve as a reality check when setting your take-profit targets. If you're considering a take-profit at $10 and current price is $2, you can quickly see that's a 5x target and evaluate whether that seems realistic given current market conditions.
These lines help you assess the feasibility of your exit goals and avoid setting unrealistic expectations. They're not resistance levels themselves, but visual aids to help you gauge whether your planned targets are conservative, aggressive, or somewhere in between
How is the EMA calculated and why does it represent bull/bear market intensity?
Answer: The indicator uses a 147-period EMA (1D tf) combined with ADX and DMI indicators to assess market phases. The EMA provides the basic trend direction - when price is above the EMA, it suggests bullish conditions, and when below, bearish conditions.
The intensity comes from the ADX/DMI analysis. Strong bull markets occur when price is above the EMA, ADX is above 25 (indicating strong trend), and the positive directional indicator dominates. Strong bear markets show the opposite pattern with negative directional movement dominating.
The system also uses weekly ADX slope to confirm trend strength is increasing rather than fading. This combination helps distinguish between weak sideways markets and genuine strong trending phases, giving you context at the time of exit planning.
EXIT PLAN
Why does my exit plan show errors?
Answer: The indicator validates your plan in real-time and shows specific error messages to help you fix issues. Common problems include take-profit percentages that don't sum to exactly 100%, price levels set in wrong order (TP2 must be higher than TP1), or gaps in your sequence (you can't use TP3 without filling TP1 and TP2 first).
Check the Exit Plan Validation section in the table - it will show exactly what needs fixing with messages like "TP percentages must sum to exactly 100%" or "Fill TPs consecutively starting from TP1." Fix the highlighted issue and the error will clear automatically, turning your validation checkmark green when everything is correct.
Why do I need to provide my coin quantity and average entry price?
Answer: The coin quantity is essential because the indicator calculates exact amounts to sell at each take-profit level based on your percentages. If you set TP1 to sell 25% of your position, the script needs to know your total quantity to calculate that 25% means exactly X coins in your 3Commas Smart Trade.
The average entry price helps calculate your projected gains and portfolio performance in the Exit Table. If you don't know your exact entry price, leave it at zero and the indicator will use current price as a fallback for calculations. Both pieces of information ensure your Smart Trade matches your actual position size and gives you accurate profit projections.
What is the emergency exit price?
Answer: The emergency exit price is an optional stop-loss feature that automatically sells 100% of your coin position if price falls to your specified level. This is critical to understand because once triggered, 3Commas will execute the sale immediately without further confirmation.
When price hits your emergency exit level, 3Commas places a limit sell order at 3% below that price to avoid poor market execution. However, execution is not guaranteed because limit orders may not fill during extreme volatility or if price gaps below your limit level. Use this feature cautiously and set the emergency price well below normal support levels to account for typical market fluctuations.
This sells your entire position regardless of your take-profit plan, so only enable it if you want automated crash protection and understand the risks of potential false breakdowns triggering unnecessary exits.
3COMMAS CONNECTION
How do I get my 3Commas API keys and Account ID?
Answer:
For API Keys: Log into 3Commas, go to User Profile → 3Commas API → New API Access Token → System Generated. Set permissions to "Smart Trades Only" (leave all other permissions unchecked) and add your IP to the whitelist for security. Save both the public and private keys securely after creation.
For Account ID: Go to My Portfolio → View Exchange in 3Commas. Look at the URL in your browser - the Account ID is the 8-digit number at the end of the webpage address (example: if the URL shows "/accounts/12345678" then your Account ID is 12345678).
Important: Never share these credentials with anyone. The indicator transmits them directly to 3Commas through secure API connections without storing or logging them. If you suspect your keys are compromised, revoke them immediately in your 3Commas account and generate new ones.
ALERTS
I have set up my exit plan, what's next?
Answer: Once your exit plan is configured and shows green checkmarks in the validation section, follow the 4-step workflow in the indicator. Check "Step 1: Check and confirm Exit Plan" to enable alert firing, then create a TradingView alert using the Altcoins Exit Planner PRO condition with "Any alert() function call" trigger.
The alert fires immediately and sends your plan to 3Commas. Within minutes, you should see a new Smart Trade appear in your 3Commas dashboard matching your exact exit strategy. After confirming the Smart Trade was created successfully, delete the TradingView alert to prevent duplicate submissions.
From that point, 3Commas manages your exit automatically according to your plan. Monitor execution through your 3Commas dashboard and let the platform handle the sequential take-profit levels as price moves.
How do I create the TradingView alert?
Answer: Click the "Alert" button in TradingView (bell icon in the top toolbar). In the alert setup window, set Condition to "Altcoins Exit Planner PRO" and Trigger to "Any alert() function call." Keep Interval as "Same as Chart" and Expiration as "Open Ended."
In the Message section, you can name your alert anything you want. In the Notifications section, enable the webhook option (leave the URL field as you'll handle that separately). You can also enable email or sound notifications if desired.
Click "Create" to activate the alert. If Step 1 is already checked in your indicator, the alert will fire immediately and send your exit plan to 3Commas. Remember to delete this alert after your Smart Trade appears to prevent duplicates.
I got the Smart Trade on 3Commas, what's next?
Answer: Congratulations! Your exit plan is now active and automated. Delete the TradingView alert immediately to prevent duplicate Smart Trades from being created. You can now monitor your Smart Trade's progress through your 3Commas dashboard.
3Commas will automatically execute your take-profit levels as price reaches each target, selling the specified percentages of your position according to your plan. If you enabled emergency exit protection, that stop-loss is also active and monitoring for downside protection.
Your job is essentially done - let 3Commas handle the execution while you monitor overall market conditions. You can view trade progress, modify the Smart Trade if needed, or manually close it early through your 3Commas interface. The platform will manage all the sequential selling according to your original exit strategy.
Can I cancel my exit plan and resubmit to 3Commas?
Answer: Yes, you can modify your exit strategy by first deleting the existing Smart Trade in your 3Commas dashboard, then resubmitting a new plan through the indicator.
To cancel and resubmit: Go to your 3Commas Smart Trades section and delete the current trade. Return to the TradingView indicator, modify your exit plan settings (prices, percentages, emergency exit, etc.), then repeat the deployment process by checking Step 1 and creating a new alert.
This creates a fresh Smart Trade with your updated parameters. Always ensure you delete the old Smart Trade first to avoid having multiple conflicting exit plans running simultaneously. The new deployment will overwrite nothing automatically - you must manually clean up the old trade before submitting the revised plan.
Why did I get a second Smart Trade after the first one?
Answer: This happens when you forget to delete the TradingView alert after your first Smart Trade was created successfully. The alert remains active and continues firing, creating duplicate Smart Trades each time it triggers.
Always delete your TradingView alert immediately after confirming your Smart Trade appears in 3Commas. Go to your TradingView alerts list, find the alert you created for this exit plan, and delete it completely. Also delete any duplicate Smart Trades in your 3Commas dashboard to avoid confusion.
To prevent this in future deployments, remember the workflow: create alert → Smart Trade appears → delete alert immediately. Each exit plan should only generate one Smart Trade, and keeping alerts active will cause unwanted duplicates.
------------------------------------------------------------------
7. Limitations and Disclaimer
Limitations:
Doesn't provide trading signals or entry points
Doesn't guarantee resistance levels will hold
Requires manual monitoring of 3Commas execution
Works for exit planning only, not position building
Disclaimer
This indicator is for educational and informational purposes only. It does not constitute financial, investment, or trading advice.
The indicator:
Makes no guarantees about future market performance
Cannot predict market movements with certainty
May generate false indications
Relies on historical patterns that may not repeat
Should not be used as the sole basis for trading decisions
Users are responsible for:
Conducting independent research and analysis
Understanding the risks of cryptocurrency trading
Making their own investment/divestment decisions
Managing position sizes and risk exposure appropriately
Managing API keys and secret codes diligently (do not share with third parties, store them securely, use malware protection on your PC)
Cryptocurrency trading involves substantial risk and may not be suitable for all investors. Past performance does not guarantee future results. Users should only invest what they can afford to lose and consult qualified professionals before making financial decisions.
The indicator’s assumptions may be invalidated by changing market conditions.
By using this tool, users acknowledge these limitations and accept full responsibility for their trading decisions.

Positional Toolbox v6 (distinct colors)what the lines mean (colors)
EMA20 (green) = fast trend
EMA50 (orange) = intermediate trend
EMA200 (purple, thicker) = primary trend
when the chart is “bullish” vs “bearish”
Bullish bias (look for buys):
EMA20 > EMA50 > EMA200 and EMA200 sloping up.
Bearish bias (avoid longs / consider exits):
EMA20 < EMA50 < EMA200 or price closing under EMA50/EMA200.
the two buy signals the script gives you
Pullback Long (triangle up)
Prints when price dips to EMA20 (green) and closes back above it while trend is bullish and ADX is decent.
Entry: buy on the same close or on a break of that candle’s high next day.
Stop: below the pullback swing-low (or below EMA50 for simplicity).
Best for: adding on an existing uptrend after a shallow dip.
Breakout 55D (“BO55” label)
Prints when price closes above prior 55-day high with volume surge in a bullish trend.
Entry: on the close that triggers, or next day above the breakout candle’s high.
Stop: below the breakout candle’s low (conservative: below base low).
Best for: fresh trend legs from bases.
simple “sell / exit” rules
Trend exit (clean & mechanical): exit if daily close < EMA50 (orange).
More conservative: only exit if close < EMA200 (purple).
Momentum fade / weak breakout: if BO55 triggers but price re-closes back inside the base within 1–3 sessions on above-avg volume → exit or cut size.
Profit taking: book some at +1.5R to +2R, trail the rest (e.g., below prior swing lows or EMA20).
quick visual checklist (what to look for)
Are the EMAs stacked up (green over orange over purple)? → ok to buy setups.
Did a triangle print near EMA20? → pullback long candidate.
Did a BO55 label print with strong volume? → breakout candidate.
Any close under EMA50 after you’re in? → reduce/exit.
timeframe
Use Daily for positional signals.
If you want a tighter entry, drop to 30m/1h only to time the trigger—but keep decisions anchored to the daily trend.
alerts to set (so you don’t miss signals)
Add alert on Breakout 55D and Pullback Long (from the indicator’s alertconditions).
Optional price alerts at the breakout level or EMA20 touch.
risk guardrails (MTF friendly)
Risk ≤1% of capital per trade.
Avoid fresh entries within ~5 trading days of earnings unless you accept gap risk.
Prefer high-liquidity NSE F&O names (your CSV watchlist covers this).
TL;DR (super short):
Green > Orange > Purple = uptrend.
Triangle near green = buy the pullback; stop under swing low/EMA50.
BO55 label = buy the breakout; stop under breakout candle/base.
Exit on close below EMA50 (or below EMA200 if you’re giving more room).

Opening Range IndicatorComplete Trading Guide: Opening Range Breakout Strategy
What Are Opening Ranges?
Opening ranges capture the high and low prices during the first few minutes of market open. These levels often act as key support and resistance throughout the trading day because:
Heavy volume occurs at market open as overnight orders execute
Institutional activity is concentrated during opening minutes
Price discovery happens as market participants react to overnight news
Psychological levels are established that traders watch all day
Understanding the Three Timeframes
OR5 (5-Minute Range: 9:30-9:35 AM)
Most sensitive - captures immediate market reaction
Quick signals but higher false breakout rate
Best for scalping and momentum trading
Use for early entry when conviction is high
OR15 (15-Minute Range: 9:30-9:45 AM)
Balanced approach - most popular among day traders
Moderate sensitivity with better reliability
Good for swing trades lasting several hours
Primary timeframe for most strategies
OR30 (30-Minute Range: 9:30-10:00 AM)
Most reliable but slower signals
Lower false breakout rate
Best for position trades and trend following
Use when looking for major moves
Core Trading Strategies
Strategy 1: Basic Breakout
Setup:
Wait for price to break above OR15 high or below OR15 low
Enter on the breakout candle close
Stop loss: Opposite side of the range
Target: 2-3x the range size
Example:
OR15 range: $100.00 - $102.00 (Range = $2.00)
Long entry: Break above $102.00
Stop loss: $99.50 (below OR15 low)
Target: $104.00+ (2x range size)
Strategy 2: Multiple Confirmation
Setup:
Wait for OR5 break first (early signal)
Confirm with OR15 break in same direction
Enter on OR15 confirmation
Stop: Below OR30 if available, or OR15 opposite level
Why it works:
Multiple timeframe confirmation reduces false signals and increases probability of sustained moves.
Strategy 3: Failed Breakout Reversal
Setup:
Price breaks OR15 level but fails to hold
Wait for re-entry into the range
Enter reversal trade toward opposite OR level
Stop: Recent breakout high/low
Target: Opposite side of range + extension
Key insight: Failed breakouts often lead to strong moves in the opposite direction.
Advanced Techniques
Range Quality Assessment
High-Quality Ranges (Trade these):
Range size: 0.5% - 2% of stock price
Clean boundaries (not choppy)
Volume spike during range formation
Clear rejection at range levels
Low-Quality Ranges (Avoid these):
Very narrow ranges (<0.3% of stock price)
Extremely wide ranges (>3% of stock price)
Choppy, overlapping candles
Low volume during formation
Volume Confirmation
For Breakouts:
Look for volume spike (2x+ average) on breakout
Declining volume often signals false breakout
Rising volume during range formation shows interest
Market Context Filters
Best Conditions:
Trending market days (SPY/QQQ with clear direction)
Earnings reactions or news-driven moves
High-volume stocks with good liquidity
Volatility above average (VIX considerations)
Avoid Trading When:
Extremely low volume days
Major economic announcements pending
Holidays or half-days
Choppy, sideways market conditions
Risk Management Rules
Position Sizing
Conservative: Risk 0.5% of account per trade
Moderate: Risk 1% of account per trade
Aggressive: Risk 2% maximum per trade
Stop Loss Placement
Inside the range: Quick exit but higher stop-out rate
Outside opposite level: More room but larger risk
ATR-based: 1.5-2x Average True Range below entry
Profit Taking
Target 1: 1x range size (take 50% off)
Target 2: 2x range size (take 25% off)
Runner: Trail remaining 25% with moving stops
Specific Entry Techniques
Breakout Entry Methods
Method 1: Immediate Entry
Enter as soon as price closes above/below range
Fastest entry but highest false signal rate
Best for strong momentum situations
Method 2: Pullback Entry
Wait for breakout, then pullback to range level
Enter when price bounces off former resistance/support
Better risk/reward but may miss some moves
Method 3: Volume Confirmation
Wait for breakout + volume spike
Enter after volume confirmation candle
Reduces false signals significantly
Multiple Timeframe Entries
Aggressive: OR5 break → immediate entry
Conservative: OR5 + OR15 + OR30 all align → enter
Balanced: OR15 break with OR30 support → enter
Common Mistakes to Avoid
1. Trading Poor-Quality Ranges
❌ Don't trade ranges that are too narrow or too wide
✅ Focus on clean, well-defined ranges with good volume
2. Ignoring Volume
❌ Don't chase breakouts without volume confirmation
✅ Always check for volume spike on breakouts
3. Over-Trading
❌ Don't force trades when ranges are unclear
✅ Wait for high-probability setups only
4. Poor Risk Management
❌ Don't risk more than planned or use tight stops in volatile conditions
✅ Stick to predetermined risk levels
5. Fighting the Trend
❌ Don't fade breakouts in strongly trending markets
✅ Align trades with overall market direction
Daily Trading Routine
Pre-Market (8:00-9:30 AM)
Check overnight news and earnings
Review major indices (SPY, QQQ, IWM)
Identify potential opening range candidates
Set alerts for range breakouts
Market Open (9:30-10:00 AM)
Watch opening range formation
Note volume and price action quality
Mark key levels on charts
Prepare for breakout signals
Trading Session (10:00 AM - 4:00 PM)
Execute breakout strategies
Manage existing positions
Trail stops as profits develop
Look for additional setups
Post-Market Review
Analyze winning and losing trades
Review range quality vs. outcomes
Identify improvement areas
Prepare for next session
Best Stocks/ETFs for Opening Range Trading
Large Cap Stocks (Best for beginners):
AAPL, MSFT, GOOGL, AMZN, TSLA
High liquidity, predictable behavior
Good range formation most days
ETFs (Consistent patterns):
SPY, QQQ, IWM, XLF, XLE
Excellent liquidity
Clear range boundaries
Mid-Cap Growth (Advanced traders):
Stocks with good volume (1M+ shares daily)
Recent news catalysts
Clean technical patterns
Performance Optimization
Track These Metrics:
Win rate by range type (OR5 vs OR15 vs OR30)
Average R/R (risk vs reward ratio)
Best performing market conditions
Time of day performance
Continuous Improvement:
Keep detailed trade journal
Review failed breakouts for patterns
Adjust position sizing based on win rate
Refine entry timing based on backtesting
Final Tips for Success
Start small - Paper trade or use tiny positions initially
Focus on quality - Better to miss trades than take bad ones
Stay disciplined - Stick to your rules even during losing streaks
Adapt to conditions - What works in trending markets may fail in choppy conditions
Keep learning - Markets evolve, so should your approach
The opening range strategy is powerful because it captures natural market behavior, but like all strategies, it requires practice, discipline, and proper risk management to be profitable long-term.

Volume Profile Auto POC📌 Overview
Volume Profile Auto POC is a trend-following strategy that uses the automatically calculated Point of Control (POC) from the volume profile, combined with ATR zones, to capture reversals and breakouts.
By basing decisions on volume concentration, it dynamically visualizes the price levels most watched by market participants.
⚠️ This strategy is provided for educational and research purposes only.
Past performance does not guarantee future results.
🎯 Strategy Objectives
Automatically detect the volume concentration area (POC) to improve entry accuracy
Optimize risk management through ATR-based volatility adjustment
Provide early and consistent signals when trends emerge
✨ Key Features
Automatic POC Detection : Updates the volume profile over a defined lookback window in real time
ATR Zone Integration : Defines a POC ± 0.5 ATR zone to clarify potential reversals/breakouts
Visual Support : Plots the POC line and zones on the chart for intuitive decision-making
📊 Trading Rules
Long Entry:
Price breaks above the POC + 0.5 ATR zone
Volume is above average to support the breakout
Short Entry:
Price breaks below the POC - 0.5 ATR zone
Volume is above average to support the downside move
Exit (or Reverse Position):
Price returns to the POC area
Or touches the ATR band
⚙️ Trading Parameters & Considerations
Indicator Name: Volume Profile Auto POC
Parameters:
Lookback Bars: 50
Bins for Volume Profile: 24
ATR Length: 14
ATR Multiplier: 2.0
🖼 Visual Support
POC line plotted in red
POC ± 0.5 ATR zone displayed as a semi-transparent box
ATR bands plotted in blue for confirmation
🔧 Strategy Improvements & Uniqueness
This strategy is inspired by traditional Volume Profile + ATR analysis,
while adding the improvement of a sliding-window mechanism for automatic POC updates.
Compared with conventional trend-following approaches,
its strength lies in combining both price and volume perspectives for decision-making.
✅ Summary
Volume Profile Auto POC automatically extracts key market levels (POC) and combines them with ATR-based zones,
providing a responsive trend-following method.
It balances clarity with practicality, aiming for both usability and reproducibility.
⚠️ This strategy is based on historical data and does not guarantee future profits.
Always use proper risk management when applying it.

TURT Donchian Ladder v3.13How to trade TURT+ with the v3.13 script
1) Pick the system & arm the entry
• In the script, choose System = S1 (20D) or S2 (55D).
The HUD always shows both rails for reference, but the ladder (Entry/+Adds) uses the system you pick.
• Your Entry is shown as Pivot + 0.1×N (rounded).
• Place a stop-limit “parent” order at that Entry price. (Classic Turtle uses an entry stop; I suggest a tight limit offset so you don’t chase a blow-through.)
• Initial stop = N2 = Entry − 2×N (rounded). Put that in immediately.
If you like only confirming on a bar close, leave confirmClose = true and place the parent after the close that breaks out. If you want intrabar fills, set confirmClose = false and keep the stop-limit active intraday.
2) Size it the way you planned
• Set acctEquity / riskCapPct / posCapUSD / entryFrac / entryRiskFrac / sizingMode.
• HUD gives Rec Entry Qty (when flat) and, once in, it shows:
• Next Rung (price)
• Suggested AddShares (honors RiskCap & PosCap)
• Proj Stop if Add (ratcheted N2)
• A limiter note (RiskCap or PosCap) if you’re constrained.
3) After entry fills, stage the ADDs (only at fixed +N steps)
• Adds are NOT “every Donchian break.” You add only at:
• Add-1 = Entry + 0.5×N
• Add-2 = Entry + 1.0×N
• Add-3 = Entry + 1.5×N (optional)
• Use the HUD’s Suggested AddShares for each rung (it respects your RiskCap/PosCap).
• Place stop-limit orders for each add (either immediately as a contingent OTO chain that arms only after Entry fills, or you arm each add when price approaches—your choice).
• On each add fill, ratchet the catastrophic stop for the entire position to Last-Add − 2×N (the script and HUD show Proj Stop if Add so you know where it will land). Never move it lower.
Pro tip: If your broker supports OTO/OTOCO:
• OTO parent = Entry stop-limit.
• On fill, fire an OCO with the N2 stop (no target), and also stage child stop-limits for Add-1 / Add-2 / Add-3 with the correct sizes. If your broker can’t chain that deep, just use the script’s alerts (Entry/Add-1/Add-2/Add-3/Exits) to place/adjust orders quickly.
4) Exits (two layers)
• Catastrophic (always on): the N2 stop you’re ratcheting (Last-Add − 2×N).
• Trend exits (runner):
• S1: 10-low close (HUD shows it).
• S2: 20-low close (HUD shows it).
• Profit-taking (optional): sell ~50% at +2.5R to +3R vs current N2; let the runner trail with 10-low/20-low. You can keep N2 as a hard backstop.
5) Should you pre-set everything or buy live?
Both work; pick the style that fits you:
Preset (Turtle-pure, rules-based)
• ✅ You won’t miss the breakout; minimal discretion.
• ✅ Broker handles fills even if you’re away.
• ⚠️ You may get the occasional intraday “poke” (use confirmClose + place after close if you want fewer).
Buy on break manually
• ✅ Lets you check tape/volume or any extra gates before clicking.
• ⚠️ Higher chance of slippage or of simply missing the trigger.
A nice hybrid: place the Entry order, then arm Add-1/2/3 when price is nearing each rung and the HUD shows Suggested AddShares > 0 (green risk read).
⸻
6) Quick checklist per trade
1. System: S1 or S2?
2. Levels: Entry / Add-1 / Add-2 / Add-3 / 10-low / 20-low / N2 (rounded).
3. Sizing: confirm RiskCap/PosCap; HUD shows Suggested AddShares and limiter.
4. Orders:
• Parent Entry stop-limit.
• N2 stop (rounded).
• Stage adds (stop-limits) with sizes from HUD.
5. On fill: ratchet stop to Last-Add − 2×N; adjust remaining adds and sizes.
⸻
7) Example with your MU position (pattern)
• You’re already in: set entryQty and entryPman in the inputs to match your fill.
• HUD now focuses on Next Rung, Suggested AddShares, and Proj Stop if Add.
• If Suggested AddShares = 0 and limiter says RiskCap or PosCap, you’ll still see the next rung price and Proj Stop if Add so you can decide whether to override.
⸻
Bottom line
• Entry: buy the Donchian breakout + 0.1N with a stop-limit (Turtle style).
• Adds: only at +0.5N steps, sized by HUD; not on every future Donchian break.
• Stops: keep (and ratchet) the N2 catastrophic; trail runner on 10-low / 20-low.
If you want, tell me your broker/platform and I’ll map this to exact order ticket types (stop-limit/OTO/OCO) and a tiny checklist you can keep next to your screen.

Position Size CalculatorPosition Size Calculator
This open-source Pine Script® indicator helps traders manage risk by calculating position size, margin, and risk/reward based on account size, leverage, entry, stop-loss, and take-profit. It features a customizable table and optional chart lines/labels for clear trade planning across stocks, forex, crypto, and futures.
What It Does
- Position Size: Computes units to trade based on risk percentage and stop-loss distance, capped by leverage.
- Margin: Calculates initial margin in base currency and USD, with account size percentage.
- Risk/Reward: Shows risk-reward ratio, percentage price movements, and USD gains/losses.
- Visualization: Displays results in a table and optional chart lines/labels with customizable styles.
How It Works
- Precision: Adjusts price formatting using syminfo.mintick for accuracy across assets.
- Calculations: Position size = accountSize * (riskPercent / 100) / |entry - stoploss|, capped by accountSize * leverage / entry. Margin = positionSize / leverage. Risk-reward = |takeprofit - entry| / |stoploss - entry|.
- Display: Table shows metrics; optional lines/labels plot entry, stop-loss, and take-profit with percentage and USD details.
How to Use
- Set Inputs:
1- Account Size (USD): Your capital (e.g., 1000).
2- % Risk per Trade: Risk tolerance (e.g., 1%).
3- Leverage: Broker leverage (e.g., 1x, 10x).
4- Entry, Stop Loss, Take Profit: Trade prices.
5- Show Lines and Labels: Enable chart overlays.
- Customize: Adjust table position, colors, and line styles (Solid, Dashed, Dotted).
- View Results: Table shows position size, margin, and risk/reward. Chart lines/labels (if enabled) display prices, percentages, and USD outcomes.
- Apply: Use metrics for trade execution; modify code for custom features.
Notes
- Ensure valid inputs (entry ≠ stop-loss, both positive) to avoid “N/A”.
- Open-source: Inspect or extend the code for your needs.
- Contact the author via TradingView for feedback.

HawkEye EMA Cloud
# HawkEye EMA Cloud - Enhanced Multi-Timeframe EMA Analysis
## Overview
The HawkEye EMA Cloud is an advanced technical analysis indicator that visualizes multiple Exponential Moving Average (EMA) relationships through dynamic color-coded cloud formations. This enhanced version builds upon the original Ripster EMA Clouds concept with full customization capabilities.
## Credits
**Original Author:** Ripster47 (Ripster EMA Clouds)
**Enhanced Version:** HawkEye EMA Cloud with advanced customization features
## Key Features
### 🎨 **Full Color Customization**
- Individual bullish and bearish colors for each of the 5 EMA clouds
- Customizable rising and falling colors for EMA lines
- Adjustable opacity levels (0-100%) for each cloud independently
### 📊 **Multi-Layer EMA Analysis**
- **5 Configurable EMA Cloud Pairs:**
- Cloud 1: 8/9 EMAs (default)
- Cloud 2: 5/12 EMAs (default)
- Cloud 3: 34/50 EMAs (default)
- Cloud 4: 72/89 EMAs (default)
- Cloud 5: 180/200 EMAs (default)
### ⚙️ **Advanced Customization Options**
- Toggle individual clouds on/off
- Adjustable EMA periods for all timeframes
- Optional EMA line display with color coding
- Leading period offset for cloud projection
- Choice between EMA and SMA calculations
- Configurable source data (HL2, Close, Open, etc.)
## How It Works
### Cloud Formation
Each cloud is formed by the area between two EMAs of different periods. The cloud color dynamically changes based on:
- **Bullish (Green/Custom):** When the shorter EMA is above the longer EMA
- **Bearish (Red/Custom):** When the shorter EMA is below the longer EMA
### Multiple Timeframe Analysis
The indicator provides a comprehensive view of trend strength across multiple timeframes:
- **Short-term:** Clouds 1-2 (faster EMAs)
- **Medium-term:** Cloud 3 (intermediate EMAs)
- **Long-term:** Clouds 4-5 (slower EMAs)
## Trading Applications
### Trend Identification
- **Strong Uptrend:** Multiple clouds stacked bullishly with price above
- **Strong Downtrend:** Multiple clouds stacked bearishly with price below
- **Consolidation:** Mixed cloud colors indicating sideways movement
### Entry Signals
- **Bullish Entry:** Price breaking above bearish clouds turning bullish
- **Bearish Entry:** Price breaking below bullish clouds turning bearish
- **Confluence:** Multiple cloud confirmations strengthen signal reliability
### Support/Resistance Levels
- Cloud boundaries often act as dynamic support and resistance
- Thicker clouds (higher opacity) may provide stronger S/R levels
- Multiple cloud intersections create significant price levels
## Customization Guide
### Color Schemes
Create your own visual style by customizing:
1. **Bullish/Bearish colors** for each cloud pair
2. **Rising/Falling colors** for EMA lines
3. **Opacity levels** to layer clouds effectively
### Recommended Settings
- **Day Trading:** Focus on Clouds 1-2 with higher opacity
- **Swing Trading:** Use Clouds 1-3 with moderate opacity
- **Position Trading:** Emphasize Clouds 3-5 with lower opacity
## Technical Specifications
- **Version:** Pine Script v6
- **Type:** Overlay indicator
- **Calculations:** Real-time EMA computations
- **Performance:** Optimized for all timeframes
- **Alerts:** Configurable long/short alerts available
## Risk Disclaimer
This indicator is for educational and informational purposes only. Always combine with proper risk management and additional analysis before making trading decisions. Past performance does not guarantee future results.
---
*Enhanced and customized version of the original Ripster EMA Clouds by Ripster47. This modification adds comprehensive color customization and enhanced user control while preserving the core analytical framework.*

TP/SL Dynamic (FIB,ATR,MULTIPLE,PERCENT)TP/SL Dynamic (FIB, ATR, MULTIPLE, PERCENT)
This indicator provides a flexible framework for managing Take Profit (TP) and Stop Loss (SL) levels using multiple calculation schemes. It is designed for traders who want dynamic or rule-based levels that adapt to volatility, market type, and custom input.
The script supports four TP/SL methodologies:
Pro Standards (Auto-Select): Adapts method based on asset type and volatility.
R Multiples: Risk-based reward multiples from ATR-derived stop distance.
Fibonacci R: Fibonacci extension levels projected from recent pivots.
Percent: Fixed percentage distance from entry, adjusted by volatility.
ATR Multiples: ATR-based calculations with configurable multipliers.
Features:
Up to 3 manual entries, each with configurable time, price, and position size.
Weighted entry price calculation across multiple positions.
Single or multiple TP targets (up to 4) with automatic scaling.
Dynamic ATR option: updates SL/TP levels with live volatility or fixes them at entry.
Pivot-based logic for Fibonacci extensions.
Symbol Locking to prevent mismatches between intended pair and chart symbol.
Table display with optional R-multiples, TP/SL values, and entry details.
Visual chart elements: lines, labels, price-scale markers for SL/TP, and zebra-style info tables.
Entry markers (E1, E2, E3) for clarity.
Alerts for TP and SL triggers (both long and short).
How to Use:
Define entry prices, times, and position sizes (up to 3 entries).
Select a TP method (Pro Standards, R Multiples, Fibonacci R, Percent, or ATR Multiples).
Choose single or multiple TP mode.
Optionally enable Dynamic ATR to update levels in real time.
Check the on-chart table for all calculated levels and alerts.
Author & Credit:
Developed from the ground up by me (no external code used outside The Pine public library).
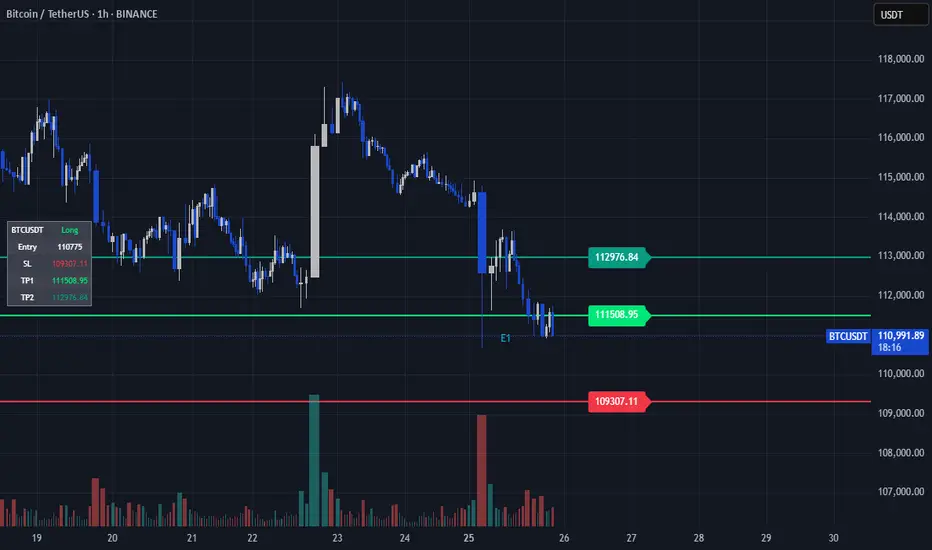
CyberFlow [Probabilities] | FractalystWhat's the indicator's purpose and functionality?
CyberFlow quantifies, per chosen higher-timeframe “Period 1/2/3”, what happens after price first taps the midpoint (Mid) of the previous period’s range. Specifically, it estimates P(High first | Mid tap) versus P(Low first | Mid tap): which side (previous High “PH” or previous Low “PL”) is typically reached first after that mid activation.
It extends a previously shared OrderFlow concept that used market structure; here it conditions on higher‑timeframe previous‑period PH/PL with the Mid as the explicit trigger.
Note: It's specifically designed to exports raw probabilistic series for algorithmic/system developers to integrate a probabilistic layer into strategies and to build/backtest ideas directly from those series.
What is “Mid activation”?
The Mid is the average of the previous period’s PH and PL. Activation occurs on the first bar in the current period whose high–low range includes the Mid. The first bar of a new period cannot activate Mid; activation can only start from the second bar of the period onward.
What counts as “first hit” after activation?
After a Mid activation, the script waits for a subsequent bar that touches either the previous High (PH) or previous Low (PL). The first side touched after the activation bar is recorded as that period’s first hit. Once decided, the other side is ignored for first‑hit statistics.
Which periods does it use?
You can select three custom reference timeframes (Period 1/2/3) in the UI (defaults: D/W/M). All logic—PH/PL/Mid, activation, first‑hit stats—runs independently per selected period.
Do the display controls change the calculation?
No. The “Show” selector only controls visuals:
Period 1/2/3: show only that period’s plots/barcolors.
OFF: shows all periods. Statistics and exported series are unaffected by this selector.
What do the bar/line colors mean?
Activation (first Mid tap): yellow bar.
Delivered to previous High after activation: blue
Delivered to previous Low after activation: red
Plots stop showing PH/PL once delivery happens (for that side) within the period.
What do the status symbols in the table mean?
■ Inactive — Mid not tapped this period.
▶ Activated — Mid tapped; awaiting delivery to PH or PL.
● Delivered — PH or PL was hit first after the Mid tap.
How are probabilities computed?
For each period, the script counts samples where the Mid was tapped and one side was hit first. It reports:
P(High first | Mid tap) and P(Low first | Mid tap).
Two‑sided p‑value vs 50% (H0: p = 0.5). These appear in the stats table with detailed tooltips.
What is “Bias” in exports?
Bias is a ternary signal derived from P(High first | Mid tap):
Bias = 1 if > 0.5
Bias = -1 if < 0.5
Bias = 0 if exactly 0.5 or no sample Source can be per period or “Merged” (simple average of available period probabilities).
Note: the UI uses a simple average; no weighted option is exposed.
What is “Entry” in exports?
Entry = 1 on bars where the selected period’s Mid activates (first tap), else 0. “Merged” emits 1 if any of the three periods activates on the bar.
What is “Exit” in exports?
Exit is the previous period’s Mid price (PH/PL average) for the selected period. “Merged” is the average of the three previous‑period Mid prices.
How do I integrate this into strategies? How to use the indicator?
CyberFlow is designed for algorithmic/system developers to add a probabilistic layer for entries and market‑regime detection.
What CyberFlow exports
- Bias (−1, 0, 1): from P(High first | Mid tap) vs 50% per your chosen source (Period 1/2/3 or Merged simple average).
- Entry (0/1): 1 only on the bar where the selected period’s Mid first activates (the “mid tap” bar).
- Exit (price): the previous period’s Mid price (average of previous High/Low) for the selected source.
- These appear in the Data Window as series named Bias, Entry, and Exit.
Connecting from your strategy (input.source)
- Add inputs in your strategy so users can select CyberFlow’s outputs:
- Bias source input: pick the indicator’s Bias.
- Entry source input: pick the indicator’s Entry.
- Exit source input: pick the indicator’s Exit.
In TradingView’s UI, users link these inputs to CyberFlow’s plots via the source picker.
Does this use request.security?
No. CyberFlow reconstructs your selected higher timeframes (Period 1/2/3) directly on the chart without request.security().
It detects new period boundaries via timeframe.change(tf), rolls the last period’s extremes into Previous High/Low (PH/PL), computes their Mid, then waits for a “Mid activation” (a bar after the first bar of the period whose range crosses the Mid).
From activation onward, it records which side (PH or PL) is reached first to build conditional probabilities per period.
Because levels and events are derived locally from the live bar stream, there are no cross-timeframe fetch artifacts or repaint nuances from request.security().
The exported series (Bias −1/0/1, Entry 0/1, Exit price) are produced natively and can be wired into strategies via TradingView’s input.source() for robust, low-latency integration.
What markets and assets does the indicator Extension work best on?
CyberFlow is market- and timeframe‑agnostic: it computes conditional probabilities (which side of the prior range is reached first after a mid tap) directly from price, so it can be applied to crypto, FX, indices, equities, futures, and commodities across intraday to higher timeframes. In practice, robustness depends on liquidity and sample size: higher timeframes usually yield more stable estimates (fewer activations, lower noise), while lower timeframes give more activations but can be noisier (spreads/fees matter more).
Because the study itself provides probabilities—not PnL—assess profitability in your context by integrating the exported series (Bias −1/0/1, Entry 0/1, Exit price) into your strategy via TradingView’s input.source(), then backtest with your fills, costs, and risk model to measure performance efficiency on your specific markets and settings.
What makes this script unique?
Custom higher-timeframes (beyond D/W/M)
You can pick any three reference periods (Period 1/2/3), not just Daily/Weekly/Monthly. The script rebuilds these periods directly on the chart and analyzes each independently.
True conditional probability (why it matters)
It measures P(High first | Mid tap) vs P(Low first | Mid tap) — i.e., “after the previous period’s midpoint is first tapped, which side is typically reached first?”
Conditioning on the mid‑tap event isolates the path that follows a specific trigger. Unconditioned counts (e.g., “how often PH/PL is hit”) mix pre‑ and post‑activation behavior and can be misleading. This conditional framing turns vague hit‑rates into decision‑grade odds tied to a clear setup.
Statistical confidence in‑context (p‑value in tooltips)
Tooltips show a Wilson 95% confidence interval and a two‑sided p‑value versus 50/50. This helps you judge whether an observed edge is likely signal or noise at your chosen periods.
Exports built for algorithmic integration
Three clean outputs in the Data Window for strategies:
Bias (−1/0/1) from the conditional probability versus 50%.
Entry (0/1) on the activation bar (first mid tap).
Exit (price) as the previous period’s Mid.
Hook these into your backtests via TradingView’s input.source(), then evaluate profitability with your own fills, costs, and risk model. This turns the probabilities into measurable performance you can optimize.
Disclaimer
This tool provides statistical estimates only and is not financial advice. Historical probabilities are not guarantees of future results. Always backtest with your own costs, fills, and risk model before using in live trading.

Strong Economic Events Indicator (mtbr)This indicator is designed to help traders anticipate market reactions to key economic events and visualize trade levels directly on their TradingView charts. It is highly customizable, allowing precise planning for entries, take-profits, and stop-losses.
Key Features:
Multi-Event Support:
Supports dozens of economic events including ISM Services PMI, CPI, Core CPI, PPI, Non-Farm Payrolls, Unemployment Rate, Retail Sales, GDP, and major central bank rate decisions (Fed, ECB, BOE, BOJ, Australia, Brazil, Canada, China).
Custom Event Date and Time:
Manually set the year, month, day, hour, and minute of the event to match your chart and timezone, ensuring accurate alignment.
Forecast vs Actual Analysis:
Input the forecast and actual values. The indicator calculates the likely market direction (Buy/Sell/Neutral) according to historical market reactions for each event.
Dynamic Trade Levels:
Automatically plots:
Entry price
TP1, TP2, TP3 in pips relative to the entry
Stop Loss in pips relative to the entry
Levels are automatically adjusted based on the event's Buy/Sell direction.
Visual Chart Representation:
Entry: Blue line and label
TP1/TP2/TP3: Green lines and labels
Stop Loss: Red line and label
Event occurrence: Orange dashed vertical line
Informative Table Panel:
Displays at the bottom-right of the chart:
Event name
Entry price
TP1, TP2, TP3 values
Current market direction (Buy/Sell/Neutral)
Customizable Line Extension:
Extend the lines for visibility across multiple bars on the chart.
How to Use the Indicator:
Select the Asset:
Set the Asset to Trade input to the symbol you want to analyze (e.g., XAUUSD, EURUSD).
Choose the Economic Event:
Use the drop-down menu to select the event you want to track.
Set the Event Date and Time:
Input the year, month, day, hour, and minute of the event. This ensures the event lines and labels appear at the correct time on your chart.
Input Forecast and Actual Values:
Enter the forecasted value and the actual result of the event. The script will determine market direction based on historically observed reactions for that event.
Configure Entry and Pip Levels:
Set your Entry Price
Set pip distances for TP1, TP2, TP3, and Stop Loss
The script automatically adjusts the levels according to Buy or Sell direction.
View Levels and Status:
Once the event occurs (or on backtesting), the indicator will plot:
Entry, Take Profits, Stop Loss on the chart
Vertical line for event occurrence
Table summarizing levels and Buy/Sell status
Adjust Line Extension:
Use the Line Extension (bars) input to control how far the horizontal levels extend on the chart.
Example Scenario:
Event: PPI MoM
Forecast: 0.2
Actual: 0.9
The indicator identifies the correct market reaction (Sell for EURUSD) and plots the Entry, TP1, TP2, TP3, and Stop Loss accordingly.
Important Notes:
The indicator does not execute trades automatically; it is for analysis and visualization only.
Always combine the signals with your own risk management and analysis.
Ensure your chart is set to the correct timezone corresponding to the event’s time.
This description fully explains how to use the indicator, what it displays, and step-by-step guidance for beginners and experienced traders

Strong Economic Event Indicator (mtbr)Description:
This indicator is designed for traders to visualize entry levels, targets (TP1, TP2, TP3), and stop loss around key economic events for the selected asset, defaulting to XAUUSD. It provides a clear reference for potential market movements based on the event's surprise and direction (Bullish, Bearish, or Neutral).
Key Features:
Customizable Event Selection:
Select from a list of major economic events including ISM Services PMI, CPI, Non-Farm Payrolls, Fed Rate Decision, and more.
Set the exact year, month, day, hour, and minute for the event so that lines and labels appear at the correct bar.
Surprise Calculation and Direction:
Automatically calculates the difference between Actual and Forecast.
Displays the market direction in the table as Bullish, Bearish, or Neutral.
Price Levels in Pips Relative to Entry:
Entry, three targets (TP1, TP2, TP3), and Stop Loss can be set in pips relative to the entry price.
Directional logic ensures that levels adjust automatically according to Bullish or Bearish surprise.
Each line and label is independent and updates only when its corresponding input changes.
Chart Visualization:
Colored lines and labels:
Entry → Blue
TPs → Green
Stop Loss → Red
Vertical event line → Orange (dashed), highlighting the event release moment.
Integrated Informative Table:
Displays:
Selected economic event
Entry price
TP1, TP2, TP3 levels
Market direction status
Color-coded: green for Bullish, red for Bearish, gray for Neutral.
How to use the script:
Add the indicator to the chart of your preferred asset (default is XAUUSD).
Select the economic event from the drop-down list.
Set the event date and time in the input panel.
Enter the Entry Price and pip values for TP1, TP2, TP3, and Stop Loss according to your strategy.
The indicator will automatically draw lines and labels on the chart and update the table with event details and market direction.
Whenever an input value changes, only the corresponding line and label will update, leaving other levels intact.
Important Notes:
This indicator is visual and educational only; it does not place trades automatically.
Make sure the event timezone is correct to match your local release time.
Use in combination with your own trading strategy and risk management.
TradingView Publication Compliance:
Full instructions for usage
Explanation of inputs and settings
Description of line and label behavior
Educational disclaimer (no automated trading)

Painel Técnico (4H x 1D) — Clean UI + Alertas BrenoG📋 Main Functions
1️⃣ Analysis in two fixed timeframes
4 hours and 1 day analyzed in parallel.
Each column in the table displays the data for its respective timeframe.
2️⃣ Entry point based on oversold conditions
The “entry point” is not the current price, but rather the last candle that went into oversold territory (RSI ≤ configured threshold).
If there has been no recent oversold condition, the current price is used as a fallback.
All calculations (Buy Zone, Stops, TPs) are based on this point.
3️⃣ Buy Zone
Defined as:
java
Copiar
Editar
Low Zone = entry * (1 - width%)
High Zone = entry
Always visible in the table, but alerts can be set to trigger only if RSI is oversold at the moment of entry.
4️⃣ Automatic Stops
Moderate Stop and Conservative Stop, calculated as a % below the entry point.
Displayed in the table with black text on a gray background for emphasis.
Alerts trigger when price crosses below these levels.
5️⃣ Take Profits (TP1–TP4)
Calculated from the entry point:
By percentage (usePercentTP = true) or
By fixed prices (usePercentTP = false).
The table displays:
Target price
% gain over the entry point
They only appear when RSI > 50 and EMA50 > EMA200 (the “alignment” condition).
Alerts trigger only on breakouts upward.
6️⃣ Context Indicators
RSI → shows numeric value and green/red color.
MACD → indicates if the MACD line is above or below the signal line.
EMAs 50/200 → indicates “Golden Cross” or “Death Cross”.
Price vs EMA200 → dedicated row showing “Above” or “Below EMA 200” with green/red color.
7️⃣ Visual Panel
Semi–transparent dark gray background, thin borders.
Colored header:
Blue for 4H
Orange for 1D
Rows separated by data type for easy reading.
Configurable font size (tiny to large).
Table position configurable (top_left, top_right, etc.).
8️⃣ Integrated Alerts
Entry/Exit of Buy Zone
Touch of each TP
Touch of each Stop
RSI entering Oversold
All alerts are separated by timeframe with clear, fixed messages.
📌 Simple Summary:
It’s an intelligent panel that combines multi–timeframe technical analysis, automatic calculation of entries/stops/TPs based on oversold conditions, and ready–to–use alerts — all presented in a visual, compact, and fully configurable format.

Kaizen ColoringIntroduction To Kaizen Coloring
This tool was made for Kaizen, this indicator is to be utilized with a trend trading system.
Most trend systems are lagging, longing a "bullish trend" for most traders will lead to longing the top of ranges, or longing erroneously with poor risk management.
Below are explanations to the settings and are straight forward to understand.
Settings Overview
Existing Settings
Candle Settings
As you can see there a 2 types of candle display logic, one works on the users chart, this will be the default setting as most users will not go into tradingview and tinker with chart settings even if you ask them to.
The benefit of this is that users will have an easy set up process
Below I have included the display of both
Body Coloring
Candle Creation Coloring
Pros of Body Coloring: Using the wicks and borders of the original chart can let users more easily identify if a candle was a positive (close > open) candle or negative (close < open) this may help inform their decision.
Pros of Candle Creation: Trend logic is easier to spot, especially when zooming out as a singular color with no interference of wick/border, less noise, focus on the indicator logic.
Trend Coloring Types
Simple Coloring
Advanced Coloring
The coloring options have fundamentally different logic,
The Simple Coloring is best for capturing trapped momentum (will be explained in how to trade), as its a lot faster to react to trend dynamics,
Advanced is best for the band, as the band primarily serves as a structure, the coloring showing a greater range in the momentum e.g. strong bullish, bullish and bullish exhaustion and vice versa allows the band coloring to act as a filter.
Structure shift, + less likely to be a fakeout and usable for entry.
If the band changed color rapidly it can be a distraction I prefer having the band show the ranges of momentum, and the candle coloring be simple as its pure naked price action shouldn't be overly filtered. Price action is still the most important.
Band Settings
The band has 2 main settings, coloring, and responsiveness. The coloring has 3 modes, Simple, Advanced and Band.
Band coloring is the simplest, its the best for pure scanning multiple coins quickly but I do not recommend it for trading.
Slow Responsiveness
The slow system, works best for a detection into a structure shift, once flipped it should be used as an alert that the direction has changed, a retest in either the band, OR price action is a trading opportunity (coloring will come into this shortly)
Fast Responsiveness
The fast band system, as you can see on the left side is useful for structure shift. However, towards the middle, you can see how it can give more false positives, this is fine, in my opinion using this should be with active trading, being able to scale in and out quickly based on reaction to the band flips is imperative to the trade.
Alerts
Instructions included on image, we can discuss adding one for the main trading use case if you will find it helpful, after testing we can discuss if you want to add some extra alerts.
Trading Logic
This indicator can be used for a hands off approach for trading.
A slow band responsiveness easier to notice potential change in environment. Fast responsiveness is better when managed actively for quick trades.
For the candles, Simple Coloring, is our preference at all times, price action is the best representation of momentum when trading, all indicators are built on price and can only react to price, overly smoothing or slowing trend detection is counter productive to behavior of price action.
Following the former day pump, looking for an entry to long, we noticed the structure shift in the Band portion of this indicator (left side circled in blue), as a result it was inadequate to long.
Looking for shorts is now most optimal, so avoid taking longs and wait for a new shift.
The simple coloring here works perfectly on the candles as its highlighting there was bullish momentum, as you can see the bullish momentum was going into the band, but failed to capture continuation.
The issue with all trend indicators is the lagging nature of any indicator, as a result most new traders see "green = long" this is bad mindset, it reduces your entry from being an ideal entry to more of a fomo based chase. Putting you offside to any correction, additionally no indicator can determine if momentum will continue, so you need to use price action accordingly.
Keeping that in mind, if you study trading liquidity and delta, you can often see traders joining a trend late, in this sense, we look to see the band shift as bearish structure, and the candle coloring highlighting late longers, and failed momentum. These are our trapped traders,
Using this to short, or in my instance, avoid taking any longs, is most optimal as your short entry position is clearly defined, and invalidation is simple - a band shift or price action reclaim of the level that was "trapped momentum/bullish candles".
This provides you with the most optimal usage on how to use Kaizen coloring, or most trend tools if well made should follow this logic (often trend tools fail to do both coloring for momentum, or a band for structure/entry, Kaizen Coloring provides both). Longing GREEN or Shorting Red is an easy way to lose.
Long the trapped bearish Momentum, Short trapped bullish momentum.
On the right hand side we can see the similar play out but on the opposite side, there was in fact a deviation of the band, but following price action principles, you wouldn't set your stops at support
You should scale your limits into support and increasingly so, your invalidation is loss of support, your entry would be closer to the invalidation and your momentum trap, (red tap into support), then the band reclaim is your long thesis.
Band Coloring is set to advanced, the benefit is the ease of seeing the shift from red to green on reclaims, having the band be smooth coloring will strengthen the understanding of the structure shift.
To summarise preferences:
Simple Coloring candles, easy momentum detection,
Slow band when taking trades intermittently
Advanced Coloring band for quick confirmation of structure shifts

MTPI OTHERS.D | JeffreyTimmermansMedium-Term Trend Probability Indicator
The "Medium-Term Trend Probability Indicator" on OTHERS.D is a custom-built model designed to measure the medium-term trend strength of the entire crypto market excluding the Top 10 assets. By focusing on the performance of smaller-cap and emerging cryptocurrencies, this indicator offers a refined view of risk appetite and capital rotation beyond the major players like BTC, ETH, and other top coins.
OTHERS.D (Total Crypto Market Cap Dominance excluding the Top 10) serves as a proxy for altcoin speculation cycles, market breadth, and rotational momentum. The MTPI leverages this by applying 8 carefully selected trend-following indicators to generate a composite probability score that reflects the directional bias of the broader altcoin market.
Key Features
Mid-Term Trend Orientation:
The MTPI focuses on multi-week to multi-month trend phases, filtering out short-term volatility while responding faster than long-term macro models.
8 Input Signals:
Built using 8 trend-following indicators, each measuring trend strength, direction, and persistence within the "OTHERS" segment.
Market Regime Detection:
The MTPI identifies three distinct market states:
Bullish → Clear upward trend in the altcoin market (excluding top 10)
Bearish → Persistent downward movement or weakness in the broader altcoin segment
Neutral → Choppy or indecisive behavior
Background Coloring:
The background dynamically adapts based on the current regime, making it easy to visually identify dominant conditions.
Trend Dashboard:
A dashboard displays:
The current state of all 8 trend signals
The overall MTPI score
The interpreted market regime
How It Works
Trend Signal Evaluation:
Each of the 8 inputs outputs a discrete signal:
+1 → Bullish
-1 → Bearish
0 → Neutral
Composite Score Calculation:
The MTPI score is computed as the average of the 8 inputs:
Score > +0.1 → Bullish regime
Score < -0.1 → Bearish regime
Between -0.1 and +0.1 → Neutral regime
This produces a normalized score from -1 to +1, helping quantify trend confidence and detect early shifts in momentum.
Color-Coded Background:
The score automatically drives the background color:
Green tones for bullish phases
Red tones for bearish phases
Gray/orange tones for sideways conditions
Use Cases
Altcoin Rotation Tracking:
Use MTPI – OTHERS.D to monitor when capital is rotating into or out of smaller-cap cryptocurrencies — a key signal for risk-on or risk-off sentiment.
Medium-Term Positioning:
Perfect for swing traders or trend followers looking to align positions with the dominant trend in the non-top-10 market segment.
Multi-Timeframe Confirmation:
Combine MTPI with other tools like STPI (Short-Term) or LTPI (Long-Term) for enhanced decision-making and better timing across timeframes.
Dynamic Alerts:
Bullish Entry: MTPI score crosses above +0.1
Bearish Entry: MTPI score crosses below -0.1
Neutral Zone: MTPI score moves between -0.1 and +0.1
These alerts help you react quickly to regime shifts in the altcoin market outside the top 10.
Conclusion
The MTPI – OTHERS.D is a focused, probability-based trend tool built for analyzing the non-top-10 segment of the crypto market. By merging 8 independent trend signals into a single composite score and regime model, it provides a clear lens into where capital is flowing and how smaller-cap crypto assets are behaving. An essential tool for anyone active in altcoin trading, rotational strategies, or full-spectrum crypto market analysis.

Mig Trade Model - Kill Zones
Key features:
Liquidity Hunt Detection: Spots aggressive moves that "hunt" stops beyond recent swing highs/lows.
Consolidation Filter: Requires 1-3 small-range candles after a hunt before confirming with a strong candle.
Bias Application: Uses daily open/close to auto-detect bias or allows manual override.
Kill Zone Restriction: Limits signals to London (default: 7-10 AM UTC) and NY (default: 12-3 PM UTC) sessions for better relevance in active markets.
This strategy is inspired by smart money concepts (SMC) and ICT (Inner Circle Trader) methodologies, aiming to capture venom-like "stings" in price action where liquidity is grabbed before reversals.
How It Works
ATR Calculation: Uses a user-defined ATR length (default: 14) to measure volatility, which scales candle body and range thresholds.
Bias Determination:
Auto: Compares daily close to open (bullish if close > open).
Manual: User selects "Bullish" or "Bearish."
Strong Candles:
Bullish: Green candle with body > 2x ATR (configurable).
Bearish: Red candle with body > 2x ATR.
Small Range Candles:
Candles where high-low < 0.5x ATR (configurable).
Liquidity Hunt:
Bullish Hunt: Strong bearish candle making a new low below the past swing low (default: 10 bars).
Bearish Hunt: Strong bullish candle making a new high above the past swing high.
Signal Generation:
After a hunt, counts 1-3 small-range candles.
Confirms with a strong candle in the opposite direction (e.g., strong bullish after bearish hunt).
Resets if >3 small candles or an opposing strong candle appears.
Kill Zone Filter:
Checks if the current bar's time (in UTC) falls within London or NY Kill Zones.
Only allows final "Buy" (bullish entry) or "Sell" (bearish entry) if bias matches and in Kill Zone.
Plots:
Yellow circle (below): Bullish liquidity hunt.
Orange circle (above): Bearish liquidity hunt.
Blue diamond (below): Raw bullish signal.
Purple diamond (above): Raw bearish signal.
Green triangle up ("Buy"): Filtered bullish entry.
Red triangle down ("Sell"): Filtered bearish entry.
Inputs
Bias: "Auto" (default), "Bullish", or "Bearish" – Controls signal direction based on daily trend.
ATR Length: 14 (default) – Period for ATR calculation.
Swing Length for Liquidity Hunt: 10 (default) – Bars to look back for swing highs/lows.
Strong Candle Body Multiplier (x ATR): 2.0 (default) – Threshold for strong candle bodies.
Small Range Multiplier (x ATR): 0.5 (default) – Threshold for small-range candles.
London Kill Zone Start/End Hour (UTC): 7/10 (default) – Customize London session hours.
NY Kill Zone Start/End Hour (UTC): 12/15 (default) – Customize New York session hours.
Usage Tips
Timeframe: Best on lower timeframes (e.g., 5-15 min) for intraday trading, especially forex pairs like EURUSD or GBPUSD.
Timezone Adjustment: Inputs are in UTC. If your chart is in a different timezone (e.g., EST = UTC-5), adjust hours accordingly (e.g., London: 2-5 AM EST → 7-10 UTC).
Risk Management: Use with stop-loss (e.g., beyond the hunt low/high) and take-profit based on ATR multiples. Not financial advice—backtest thoroughly.
Customization: Tweak multipliers for different assets; higher for volatile cryptos, lower for stocks.
Limitations: Relies on historical data; may generate false signals in ranging markets. Combine with other indicators like volume or support/resistance.
This indicator is for educational purposes. Always use discretion and proper risk management in live trading. If you find it useful, feel free to share feedback or suggestions!

LTPI BTC | JeffreyTimmermansLong-Term Trend Probability Indicator
The "Long-Term Trend Probability Indicator" on BTC is a custom-built tool designed to analyze BTC from a long-term perspective. Unlike short-term indicators that react to price volatility, LTPI focuses on major trend shifts on BTC, and therefore across the entire crypto market, helping to identify major trend shifts early.
This version of the LTPI is applied to BTC, making it a BTC specific trend following tool, but very broad (crypto wise), because BTC is the biggest asset.
Key Features
Long-Term Focus:
Designed for macro market analysis with less sensitivity to short-term noise.
8 Input Signals:
Combines 8 carefully selected inputs (trend following indicators) into a single score that reflects the overall market condition.
Market Regimes:
Classifies the BTC trend into:
Bullish: Strong uptrend, expansion phase
Bearish: Strong downtrend, contraction phase
Neutral: Transitional or uncertain
Visual Background:
Background colors clearly display which regime is active.
Comprehensive Dashboard:
The panel at the bottom shows each input’s state, the composite LTPI score, and the resulting market trend.
How It Works
Inputs Analysis:
Each of the 8 inputs outputs one of three states:
+1 (Bullish)
-1 (Bearish)
0 (Neutral)
Score Calculation:
The total score is the sum of all 8 input signals divided by 8.
Score > 0.1 = Bullish
Score < -0.1 = Bearish
Between -0.1 and 0.1 = Neutral
Background Coloring:
Background colors dynamically adjust to reflect the long-term market regime.
Use Cases
Long-Term Positioning:
Identify periods of global expansion or contraction to position yourself accordingly.
Macro Confirmation:
Use LTPI in combination with medium-term (MTPI) and short-term tools for multi-timeframe confirmation.
Market Timing:
Alerts when LTPI crosses key thresholds help highlight the start of major bullish or bearish phases.
Dynamic Alerts:
Bullish Entry: LTPI score crosses above 0.1
Bearish Entry: LTPI score crosses below -0.1
Neutral Zone: Score moves back between -0.1 and 0.1
Conclusion
The Long-Term Trend Probability Indicator (LTPI – BTC) is a powerful tool for identifying long-term market phases across the entire crypto ecosystem. By focusing on long term trends and combining 8 inputs into a single probability score, it provides a clear macro trend perspective for strategic decision-making.
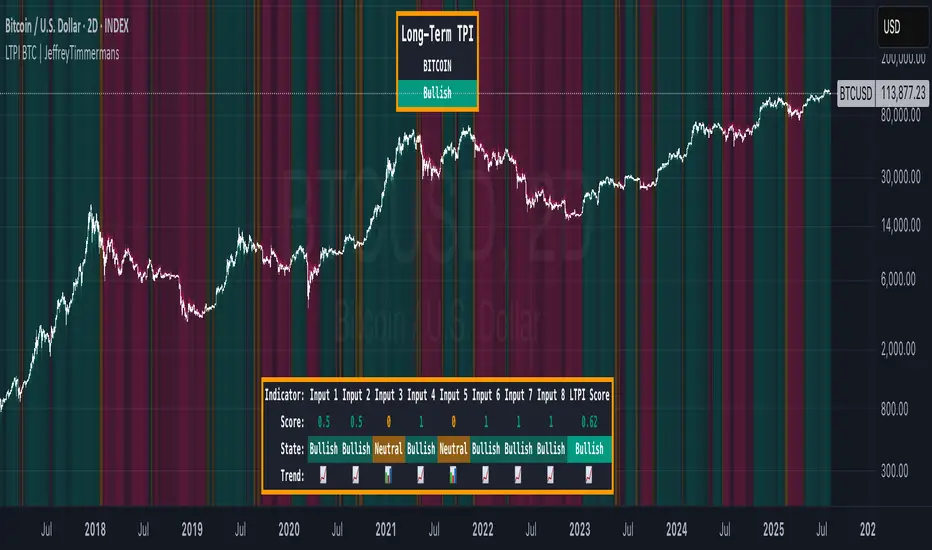
LTPI TOTAL | JeffreyTimmermansLong-Term Trend Probability Indicator
The "Long-Term Trend Probability Indicator" on TOTAL is a custom-built tool designed to analyze the global crypto market (TOTAL) from a long-term perspective. Unlike short-term indicators that react to price volatility, LTPI focuses on major trend shifts across the entire crypto market, helping to identify major trend shifts early.
This version of the LTPI is applied to the TOTAL market cap, making it a broad trend following tool.
Key Features
Long-Term Focus:
Designed for macro market analysis with less sensitivity to short-term noise.
10 Input Signals:
Combines 10 carefully selected inputs (trend following indicators) into a single score that reflects the overall market condition.
Market Regimes:
Classifies the TOTAL market into:
Bullish: Strong uptrend, expansion phase
Bearish: Strong downtrend, contraction phase
Neutral: Transitional or uncertain
Visual Background:
Background colors clearly display which regime is active.
Comprehensive Dashboard:
The panel at the bottom shows each input’s state, the composite LTPI score, and the resulting market trend.
How It Works
Inputs Analysis:
Each of the 10 inputs outputs one of three states:
+1 (Bullish)
-1 (Bearish)
0 (Neutral)
Score Calculation:
The total score is the sum of all 10 input signals divided by 10.
Score > 0.1 = Bullish
Score < -0.1 = Bearish
Between -0.1 and 0.1 = Neutral
Background Coloring:
Background colors dynamically adjust to reflect the long-term market regime.
Use Cases
Long-Term Positioning:
Identify periods of global expansion or contraction to position yourself accordingly.
Macro Confirmation:
Use LTPI in combination with medium-term (MTPI) and short-term tools for multi-timeframe confirmation.
Market Timing:
Alerts when LTPI crosses key thresholds help highlight the start of major bullish or bearish phases.
Dynamic Alerts:
Bullish Entry: LTPI score crosses above 0.1
Bearish Entry: LTPI score crosses below -0.1
Neutral Zone: Score moves back between -0.1 and 0.1
Conclusion
The Long-Term Trend Probability Indicator (LTPI – TOTAL) is a powerful tool for identifying long-term market phases across the entire crypto ecosystem. By focusing on long term trends and combining 10 inputs into a single probability score, it provides a clear macro perspective for strategic decision-making.