Fibonacci Averages Trend OscillatorOverview:
The Fibonacci Averages Trend Oscillator is a unique technical indicator that leverages Fibonacci numbers to analyze market trends. It calculates the average trend sentiment over periods determined by Fibonacci numbers and smooths the result to create an oscillator.
Key Features:
Uses Fibonacci sequences for trend analysis.
Smooths the trend data to create a clear oscillator.
Offers adjustable oversold and overbought levels for customized analysis.
Inputs:
Max Fib Number: Select the highest Fibonacci number for trend calculation.
Smooth: Adjust the smoothness of the oscillator line.
Using the Oscillator:
A rising oscillator indicates a bullish trend, while a falling oscillator suggests bearish sentiment.
Oversold and overbought levels help identify potential reversal points.
Use the oscillator in conjunction with other indicators for comprehensive market analysis.
Tips for Effective Use:
Adjusting Fibonacci Levels: Experiment with different 'Max Fib Number' settings to find the one that best matches your trading style and the asset's characteristics. Higher Fibonacci numbers consider longer periods, which might be more suitable for long-term trend analysis.
Smoothing Level: The 'Smooth' input helps in reducing noise. A higher smooth level results in a less responsive but smoother line, which can be useful for identifying the overall trend direction.
Interpreting Overbought/Oversold: Watch for the oscillator reaching overbought or oversold levels. These points could signal potential trend reversals or consolidation phases.
Combination with Other Tools: For best results, combine the Fibonacci Averages Trend Oscillator with other technical tools like moving averages, RSI, or MACD to validate the signals and develop a robust trading strategy.
Conclusion:
The Fibonacci Averages Trend Oscillator offers a unique approach to trend analysis by incorporating Fibonacci numbers into its calculation. Its adjustable settings allow for customization to fit various trading styles and market conditions, making it a versatile tool for traders seeking to enhance their technical analysis capabilities.
Cari dalam skrip untuk "fib"

Volume Profile - BearJust another Volume Profile but you can fit into your chart better by moving back and forth horizontally. also note you can fix the number of bars to show the volume by that way you can use a fib retracment to line up high/low volume nodes with fib levels... see where price as bad structure. or just play with the colors to make a cool gradient?
Volume Profile is a technical analysis tool used by traders to analyze the distribution of trading volume at different price levels within a specified time frame. It helps traders identify key support and resistance levels, potential areas of price reversals, and areas of high trading interest. Here's how to read Volume Profile on a trading chart:
1. **Choose a Time Frame**: Decide on the time frame you want to analyze. Volume Profile can be applied to various time frames, such as daily, hourly, or even minute charts. The choice depends on your trading style and goals.
2. **Plot the Volume Profile**: Once you have your chart open, add the Volume Profile indicator. Most trading platforms offer this tool. It typically appears as a histogram or a series of horizontal bars alongside the price chart.
3. **Identify Key Elements**:
a. **Value Area**: The Value Area represents the price range where the majority of trading volume occurred. It is often divided into three parts: the Point of Control (POC) and the upper and lower value areas. The POC is the price level where the most trading activity occurred and is considered a significant support or resistance level.
b. **High-Volume Nodes**: High-volume nodes are price levels where there was a significant amount of trading volume. These nodes can act as support or resistance levels because they represent areas where many traders had their positions.
c. **Low-Volume Areas**: Conversely, low-volume areas are price levels with little trading activity. These areas may not provide strong support or resistance because they lack significant trader interest.
4. **Interpretation**:
- If the price is trading above the POC and the upper value area, it suggests bullish sentiment, and these levels may act as support.
- If the price is trading below the POC and the lower value area, it suggests bearish sentiment, and these levels may act as resistance.
- High-volume nodes can also act as support or resistance, depending on the price's current position relative to them.
5. **Confirmation**: Volume Profile should be used in conjunction with other technical analysis tools and indicators to confirm trading decisions. Consider using trendlines, moving averages, or other price patterns to validate your trading strategy.
6. **Adjust for Different Time Frames**: Keep in mind that Volume Profile analysis can yield different results on different time frames. For example, a support level on a daily chart may not hold on a shorter time frame due to intraday volatility.
7. **Practice and Experience**: Like any trading tool, reading Volume Profile requires practice and experience. Analyze historical charts, paper trade, and refine your strategies over time to gain proficiency.
8. **Stay Informed**: Stay updated with market news and events that can impact trading volume. Sudden news can change the significance of volume levels.

Elliott Wave with Supertrend Exit - Strategy [presentTrading]## Introduction and How it is Different
The Elliott Wave with Supertrend Exit provides automated detection and validation of Elliott Wave patterns for algorithmic trading. It is designed to objectively identify high-probability wave formations and signal entries based on confirmed impulsive and corrective patterns.
* The Elliott part is mostly referenced from Elliott Wave by @LuxAlgo
Key advantages compared to discretionary Elliott Wave analysis:
- Wave Labeling and Counting: The strategy programmatically identifies swing pivot highs/lows with the Zigzag indicator and analyzes the waves between them. It labels the potential impulsive and corrective patterns as they form. This removes the subjectivity of manual wave counting.
- Pattern Validation: A rules-based engine confirms valid impulsive and corrective patterns by checking relative size relationships and fib ratios. Only confirmed wave counts are plotted and traded.
- Objective Entry Signals: Trades are entered systematically on the start of new impulsive waves in the direction of the trend. Pattern failures invalidate setups and stop out positions.
- Automated Trade Management: The strategy defines specific rules for profit targets at fib extensions, trailing stops at swing points, and exits on Supertrend reversals. This automates the entire trade lifecycle.
- Adaptability: The waveform recognition engine can be tuned by adjusting parameters like Zigzag depth and Supertrend settings. It adapts to evolving market conditions.
ETH 1hr chart
In summary, the strategy brings automation, objectivity and adaptability to Elliott Wave trading - removing subjective interpretation errors and emotional trading biases. It implements a rules-based, algorithmic approach for systematically trading Elliott Wave patterns across markets and timeframes.
## Trading Logic and Rules
The strategy follows specific trading rules based on the detected and validated Elliott Wave patterns.
Entry Rules
- Long entry when a new impulsive bullish (5-wave) pattern forms
- Short entry when a new impulsive bearish (5-wave) pattern forms
The key is entering on the start of a new potential trend wave rather than chasing.
Exit Rules
- Invalidation of wave pattern stops out the trade
- Close long trades on Supertrend downturn
- Close short trades on Supertrend upturn
- Use a stop loss of 10% of entry price (configurable)
Trade Management
- Scale out partial profits at Fibonacci levels
- Move stop to breakeven when price reaches 1.618 extension
- Trail stops below key swing points
- Target exits at next Fibonacci projection level
Risk Management
- Use stop losses on all trades
- Trade only highest probability setups
- Size positions according to chart timeframe
- Avoid overtrading when no clear patterns emerge
## Strategy - How it Works
The core logic follows these steps:
1. Find swing highs/lows with Zigzag indicator
2. Analyze pivot points to detect impulsive 5-wave patterns:
- Waves 1, 3, and 5 should not overlap
- Waves 3 and 5 must be longer than wave 1
- Confirm relative size relationships between waves
3. Validate corrective 3-wave patterns:
- Look for overlapping, choppy waves that retrace the prior impulsive wave
4. Plot validated waves and Fibonacci retracement levels
5. Signal entries when a new impulsive wave pattern forms
6. Manage exits based on pattern failures and Supertrend reversals
Impulsive Wave Validation
The strategy checks relative size relationships to confirm valid impulsive waves.
For uptrends, it ensures:
```
Copy code- Wave 3 is longer than wave 1
- Wave 5 is longer than wave 2
- Waves do not overlap
```
Corrective Wave Validation
The strategy identifies overlapping corrective patterns that retrace the prior impulsive wave within Fibonacci levels.
Pattern Failure Invalidation
If waves fail validation tests, the strategy invalidates the pattern and stops signaling trades.
## Trade Direction
The strategy detects impulsive and corrective patterns in both uptrends and downtrends. Entries are signaled in the direction of the validated wave pattern.
## Usage
- Use on charts showing clear Elliott Wave patterns
- Start with daily or weekly timeframes to gauge overall trend
- Optimize Zigzag and Supertrend settings as needed
- Consider combining with other indicators for confirmation
## Default Settings
- Zigzag Length: 4 bars
- Supertrend Length: 10 bars
- Supertrend Multiplier: 3
- Stop Loss: 10% of entry price
- Trading Direction: Both

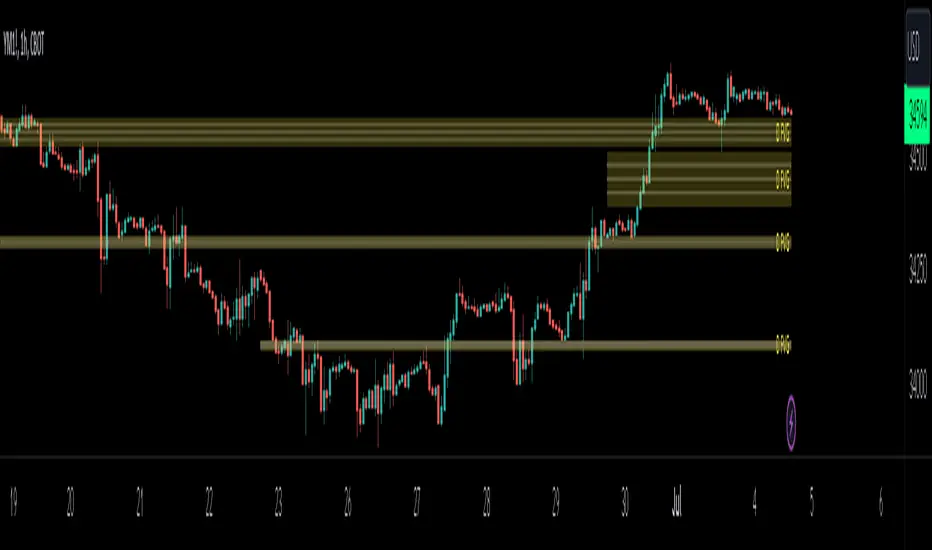
HTF FVG D/W/M 25%/50%/75% [MK]Do you use HTF FVG (fair value gaps) in your trading strategy? Do you monitor price on the 25%/50%/75% levels within the FVG on a lower timeframe?
This script will allow the user to display either Daily, Weekly or Monthly FVGs on a lower timeframe chart. The script will then also show the 25%/50%/75% levels within the HTF FVG so traders can see how price reacts in the FVG.
For example, a Weekly FVG may be chosen by the trader as a possible reversal point, or somewhere to add to an existing position. The trader might want to see the FVG almost fully filled, then watch price climb up/down out of the Weekly FVG
before taking the trade.
Previously traders would draw the FVG to the chart, then use maybe the tradingview fib tool to display the 25%/50%/75% levels. The problem with this is that its easy to accidently move the fib while dragging the chart around.
Chart below shows example of price almost filling a D FVG, then using the 25%/50%/75% levels as it climbs out of the FVG and reverses to the upside.
Planetary Tunings Moving AveragesThe Pine Script "Planetary Tunings Moving Averages" is a unique tool that plots moving averages (MAs) on a chart, representing the wavelengths of different planets as derived from the book Quadrivium. These wavelengths, also referred to as 'planetary tunings', are related to the orbital resonance of each planet.
Each planetary tuning value is first transformed into a whole number by multiplying it by 1000 and removing the decimal. This whole number is then used as the length parameter for a Simple Moving Average (SMA) function. This function calculates the average of the closing prices over the defined number of periods, thereby creating a moving average line on the chart.
The moving average lines are color-coded according to the planet they represent, allowing for quick and easy interpretation. For example, Mercury's moving average line is blue, Venus's line is orange, and so forth. These colors can be adjusted directly in the Pine Script code if desired.
Additionally, the script computes the mean of all these moving averages and plots it on the chart. This line provides an overall trend line, summarizing the collective behavior of all the planetary tuning moving averages.
The drawings in the chart are fib channels and fib circles that I use to capture liquidity in time.
Please note that this script is written for Pine Script Version 4. It's crucial to ensure your TradingView platform is compatible with this version. For any issues or further clarification, consider referring to TradingView's Pine Script documentation or its community forums.

RSI Exponential Smoothing (Expo)█ Background information
The Relative Strength Index (RSI) and the Exponential Moving Average (EMA) are two popular indicators. Traders use these indicators to understand market trends and predict future price changes. However, traders often wonder which indicator is better: RSI or EMA.
What if these indicators give similar results? To find out, we wanted to study the relationship between RSI and EMA. We focused on a hypothesis: when the RSI goes above 50, it might be similar to the price crossing above a certain length of EMA. Similarly, when the RSI goes below 50, it might be similar to the price crossing below a certain length of EMA.
Our goal was simple: to figure out if there is any connection between RSI and EMA.
Conclusion: Yes, it seems that there is a correlation between RSI and EMA, and this indicator clearly displays that relationship. Read more about the study here:
█ Overview of the indicator
The RSI Exponential Smoothing indicator displays RSI levels with clear overbought and oversold zones, shown as easy-to-understand moving averages, and the RSI 50 line as an EMA. Another excellent feature is the added FIB levels. To activate, open the settings and click on "FIB Bands." These levels act as short-term support and resistance levels which can be used for scalping.
█ Benefits of using this indicator instead of regular RSI
The findings about the Relative Strength Index (RSI) and the Exponential Moving Average (EMA) highlight that both indicators are equally accurate (when it comes to crossings), meaning traders can choose either one without compromising accuracy. This empowers traders to pick the indicator that suits their personal preferences and trading style.
█ How it works
Crossings over/under the value of 50
The EMA line in the indicator acts as the corresponding 50 line in the RSI. When the RSI crosses the value 50 equals when Close crosses the EMA line.
Bouncess from the value 50
In this example, we can see that the EMA line on the chart acts as support/resistance equals when RSI rejects the 50 level.
Overbought and Oversold
The indicator comes with overbought and oversold bands equal when RSI becomes overbought or oversold.
█ How to use
This visual representation helps traders to apply RSI strategies directly on the price chart, potentially making RSI trading easier for traders.
-----------------
Disclaimer
The information contained in my Scripts/Indicators/Ideas/Algos/Systems does not constitute financial advice or a solicitation to buy or sell any securities of any type. I will not accept liability for any loss or damage, including without limitation any loss of profit, which may arise directly or indirectly from the use of or reliance on such information.
All investments involve risk, and the past performance of a security, industry, sector, market, financial product, trading strategy, backtest, or individual's trading does not guarantee future results or returns. Investors are fully responsible for any investment decisions they make. Such decisions should be based solely on an evaluation of their financial circumstances, investment objectives, risk tolerance, and liquidity needs.
My Scripts/Indicators/Ideas/Algos/Systems are only for educational purposes!

Donchian Channel Oscillator (DonOsc) Preface
DonOsc stands for Donchian Channel Oscillator. This channel envelopes all prices, so if you set the height of the channel to 100 percent, you can plot the prices as percent in between, creating this sub-pane oscillator. For clarity the example chart shows a Donchian channel in the main-pane with the same look-back as the DonOsc, this way you can see how both are related.
Price River
Not only the close is plotted, but also the high and the low of the bar. Thus you get a structure that can be associated with a river, streaming from left to right, in which the price moves between the left bank (i.e. the plotted highs) and the right bank (i.e. the plotted lows), which meanders between the high border (100%) and the low border (0%) of the oscillator. The surface of the price river is gray. The price line is blue when up and dark red when down. The river has also color patches dark red, light red, blue and aqua. Stochastic patches; up: aqua, down: light red
If you look at the price river, you may notice that the price line is closer to the left bank (highs) when moving up and to the right bank (lows) when moving down. Because this phenomenon is used in the stochastic indicator, I named these stochastic patches. These are depicted on the wide side for visibility, so the aqua patches are to the right of the price line and the light-red patches to the left.
Widening patches; up: blue, down: red
If you look at tops or bottoms in bar charts, you may notice that long bars (wide range) tend to be there. You may say that prices turn with a ‘range bang’. This causes a widening of the price river, depicted as a patch on the wide side.
Channel Features
High (76.4 %) and low (23.6 %) Fibonacci levels.
In the oscillator there is no need to calculate Fibonacci levels, we can just plot them. If the price is above 50% the low level is shown with a green color, when below the high level with a pink color. When the price river crosses a level a ‘near border’ highlighter will flash, lime near the high border and orange near the low one.
New high and new low markers.
A flaw in the oscillator is that is doesn’t show actual new lows and new highs in the Donchian Channel, because everything is made relative. This is ‘repaired’ by adding markers, dark red for new low depicted between the high fib and border, blue for new high depicted between low fib and border. Used are the same colors as in the widening patches, because new highs and lows also lead to widening of the actual Channel.
Uptrend and downtrend highlighters.
If in the actual Channel the bars run in the upper half, an uptrend is happening as long as these remain there, a downtrend when the bars remain in the lower half. In the oscillator a yellow highlighter flashes when the price is higher than 50%, a red highlighter below 50%.
Interpretation of the DonOsc
This sub-pane indicator provides a wealth of useful information about what is going on in the market. First of all you immediately see whether there is an up or down trend and whether these lead to new highs or lows. Second of all you can estimate the importance of price movements in the context of the look-back period. Thirdly the width of the price river reveals the emotions in the market. The higher the emotions run, the more risk is involved in a postilion in the charted instrument.
Settings of the DonOsc
Look-back settings.
By default the script sets the look-back, depending on the time frame. This overrules the standard manual setting. If you switch this off, the manual setting will work. A feed-back label can by shown which informs about the current setting.
Smoothing
This concerns the price river. Default is 2, if you increase this setting, the river will loose its touch with the channel borders. O.t.o.h. the river wil be wider and better visible. Maximum setting is 5.
Colors
The momentum colors set both the river widening patches and new high and low markers.
Take care, Eykpunter.

MyLibraryLibrary "MyLibrary"
TODO: add library description here
isHammer(fib, colorMatch)
TODO: add function description here
Parameters:
fib
colorMatch
Returns: TODO: add what function returns
+ Dynamic Fibo-Donchian ChannelsThis is my second Donchian Channels indicator (and will probably be my last because how many does one really need). This version is different from my other one in that, well, it's 'dynamic' which simply means that it self adjusts based on the same formula that my Ultimate Moving Average does. What does that mean? It just means that the script takes an average of 8 different length, in this case, highest highs and lowest lows. The user doesn't need to pick a lookback/length/period/what-have-you. The indicator does it all itself. This, I think, makes for a very nice baseline or bias indicator to fit within a system that utilizes something like that. I also think it makes for a more accurate gauge of higher highs and lower lows within a timeframe, because honestly what does it mean to make a lower low over 20 periods or 8 periods or 50 periods? I don't know. What I do know is that traditional Donchian Channels never made much sense to me, but this does.
Additionally, I've kept (I guess that's not 'additionally') the fibonacci retracement levels from my other Donchian Channels indicator. These are calculated off the high and the low of the Donchian Channels themselves. You will see that there are only three retracement levels (.786, .705, .382), one of which is not a fib level, but what some people call the 'OTE,' or 'optimal trade entry.'' If you want more info on the OTE just web search it. So, why no .618 or .236? Reason being that the .618 overlaps the .382, and the .236 is extremely close to the .786. This sounds confusing, but the retracement levels I'm using are derived from the high and low, so it was unnecessary to have all five levels from each. I could have just calculated from the high, or just from the low, and used all the levels, but I chose to just calculate three levels from the high and three from the low because that gives a sort of mirror image balance, and that appeals to me, and the utility of the indicator is the same.
The plot lines are all colored, and I've filled certain zones between them. There is a center zone filled between both .382 levels, an upper and lower zon filled between the .786 and either the high or the low, and a zone between the .705 and .785
If you like the colored zones, but don't like the plots because they cause screen compression, turn off the plots under the "style" tab, or much more simply right click on the price scale and click 'scale price chart only.' Voila! No more screen compression due to a moving average or some other annoyance.
Besides that basis being a nice baseline indicator the various fib bands (or just the high and low bands) make for excellent mean reversion extremes in ranging environments.
There are alerts for candle closes across every line.
Below is an image of the indicator at default settings.
Below is an image of the indicator with the center .382 channel turned off.
Below is an image of the indicator with just the .786/.705 channel showing .
God Number Channel V1 (GNC V1)Channel, made of 5 MAs, which a made this way: High of N-period SMA - Low of N-period SMA + X-period SMA (check the code), where N and X are defined by your input.
Main purpose: helps you understand in what range price can move.
WARNING!
HAS TO BE USED WITH OTHER INDICATORS TO HAVE MORE ACCURATE ENTRIES!!!
If the price is above or below the channel, it means that the movement is very strong and you count it as a trend, but be careful then the price returns to the channel, as correction will follow very soon. Use fib correction tool to understand the approximate depth of correction, works pretty good.
Recommendation: consider using the Vortex Indicator( len 21 and 14 are fine; for trend) and "Vumanchu Divergencies + B"(for anything, but calibrate for accuracy, otherwise there will be too much false signals). If you want to see more options where the price might go, just add new MA and add/substract to/from its value avg1*(any of fibonacci correction levels, I personally use 1.618 and 2.618 and for me it is ok): plot(show_ma1 ? ma1+( [ [ ]]]*avg1) : na, color = ma1_color, title="MA №1")
Recommendations and feedback are welcome(!)
Take your wins

Bitcoin Golden Bottom Oscillator (MZ BTC Oscillator)This indicator uses Elliot Wave Oscillator Methodology applied on "BTC Golden Bottom with Adaptive Moving Average" and Relative Strength Index of Resulted EVO to form an Oscillator to detect trend health in Bitcoin price. Ticker is set to "INDEX : BTCUSD" on 1D timeframe.
Methodology
Oscillator uses Adaptive Moving Average with 1 year of length, Minor length of 50 and Major length of 100 to mark AMA as Golden Bottom.
Percentage Elliot Wave Oscillator is calculated between BTC price and AMA.
Relative Strength Index of EVO is calculated to detect trend strength and divergence detection.
Hull Moving Average of resulted RSI is used to smoothen the Oscillator.
Oscillator is hard coded to 'INDEX:BTCUSD' ticker on 1d so it can be used on any other chart and on any other timeframe.
Color Schemes
Bright Red background color indicates that price has left top Fib multiple ATR band and possibly go for top.
Light Red background color indicates that price has left 2nd top Fib multiple ATR band and possibly go for local top.
Lime background color indicates that price has entered lowest band indicating local bottom.
Bright Green background color indicates that price is approximately resting on Golden Bottom i.e. AMA.
Oscillator color is set to gradient for easy directional adaption.
BTC Golden Bottom with Adaptive Moving Average

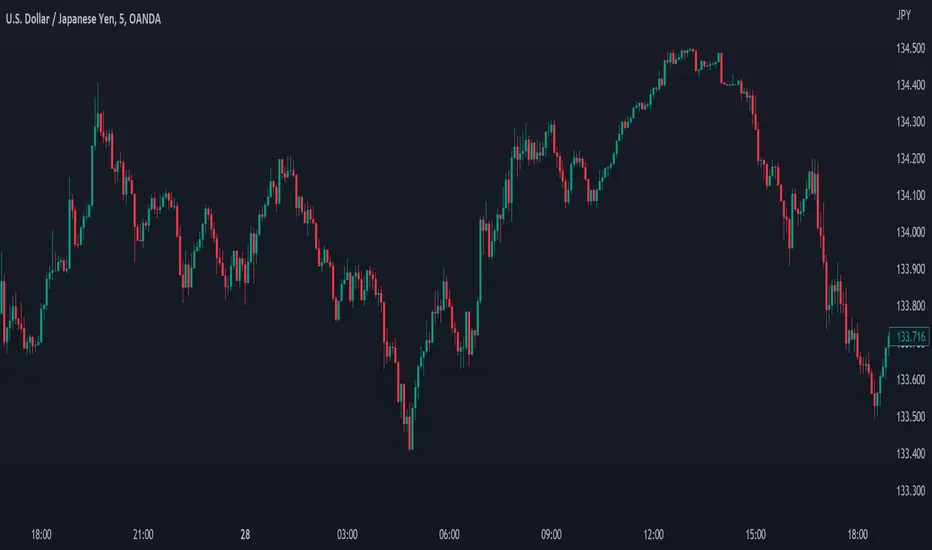
Reversal off EMA-XsEMA-Xs works mostly on Forex due to the small prices and price fluctuations. It does work on Gold, oddly enough, and some others like UKX 100...but mostly on forex. It doesn't work as well on JPY pairs but occasionally does; the JPY pairs give less signals, but when a JPY pair gives a signal, its a high probability setup. Another script EMA-XL works better on the higher priced instruments like S&P, DJI, OIL, BTC etc.
This script will show 3 moving averages: 13, 34, 200 and works on the 5m, 1hr, 4hr, daily charts. Signals "B" or "S" will be on the chart above or below the candles respectively.
When to open:
The script gives buy and sell signals based on a counter-trend move away from the MA's. When the price rises a specific percent above/below the EMA, it'll give a signal. It's best to take a trade when it gives a cluster of consecutive signals near the same price. If using on the 5m, definitely wait for consecutive signals. Also, use this in conjunction with support and resistance areas. Using with fibs for confirmation really makes this a good tool with high probability: IE, when price hits a fib and the script gives a signal, its a high probability setup.
When to close:
1. After a fast move up/down you may use this to counter trade a scalp 10+ pips, but you need to be quick; applies mostly to the 5m chart.
2. If you have the tenacity wait until you see an opposite signal. With this method you may be holding a loosing trade for a while. But what I've noticed is if it trends against you, price usually with come near to the first time it signaled. You may want to stack trades on each cluster of signals. IE first trade is 1000 units, next is 2000 units, etc... then close when prices comes near the first time it signaled. By this time, if you held, you should have profit. This strategy will really test your mental resilience.
3. Wait until it comes back to one of the trendlines; remember this is a counter trend signal so price is moving away from the MA and it always returns to touch one of the MA's...LOL eventually
4. Applying to scalping on the 5m, keep the stops tight because if the instrument trends hard and fast, you'll be upside-down quickly.
If you put a lot of time into using this signal generator, you can really make good profit. But with all tools, you need to master it. There are nuances to the simple logic of this script that can be both fun and frustrating. With all endeavors, if you put the time into it, you will reap the rewards.
Good luck and let me know if you have any questions/comments.

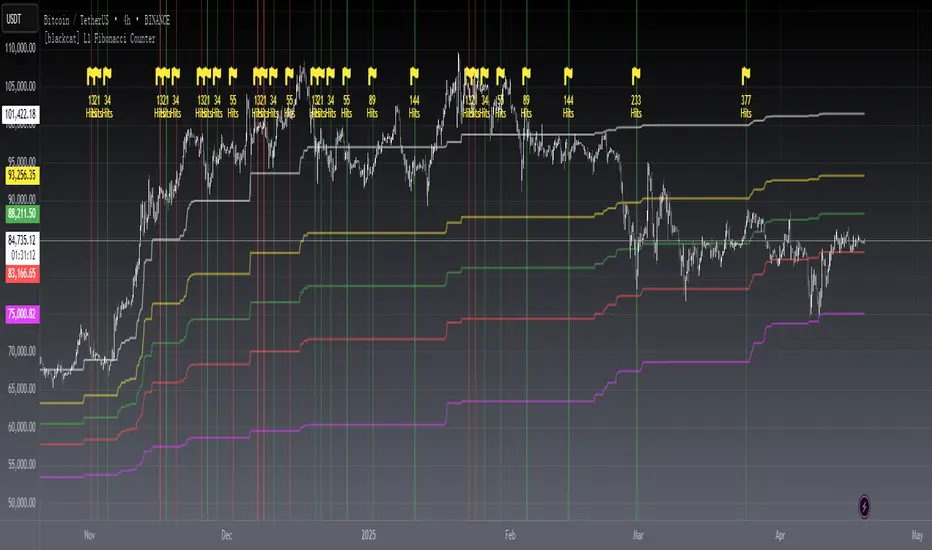
[blackcat] L1 Fibonacci CounterLevel: 1
Background
I believe that many traders must be familiar with the Fibonacci sequence. In live trading, we also use the Fibonacci sequence to predict the probability of a change in direction at an important stage of the market. , In the market analysis method, the Fibonacci sequence appears frequently.
Function
Drawing Fibonacci cycles manually is usually more labor-intensive. Here I tentatively implement a technical indicator that automatically draws Fibonacci time windows. It can automatically locate the high and low points of historical prices, and count them. When the period displayed by the counter is a Fibonacci number, it will be highlighted with a yellow background color and marked with the Fibonacci number. value.
Inputs
Counter Max Lookback --> Default 987.
Key Signal
Red bgcolor --> historical high with Fib hits
Green bgcolor --> historical low with Fib hits
Remarks
This is a Level 1 free and open source indicator.
Feedbacks are appreciated.
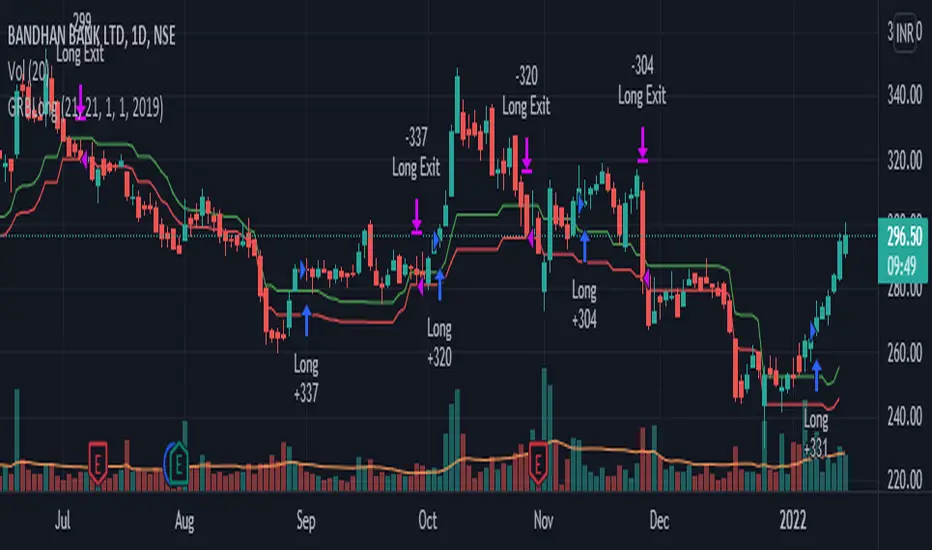
GRB LongThis strategy generates swing trading signals based on the Golden Ratio Breakout. This is a long-only strategy, entry is breakout and retest of 38.2 fib level and SL is 23.6 fib level from last 21 days. These are only suggestions and NOT recommendations. Please do your own due diligence before taking ANY action. No responsibility for any profits/LOSSES.
arrayutilsLibrary "_arrayutils"
Library contains utility functions using arrays.
delete(arr, index)
remove an item from array at specific index. Also deletes the item
Parameters:
arr : - array from which the item needs to be deleted
index : - index of item to be deleted
Returns: void
pop(arr)
remove the last item from array. Also deletes the item
Parameters:
arr : - array from which the last item needs to be removed and deleted
Returns: void
shift(arr)
remove an item from array at index 0. Also deletes the item
Parameters:
arr : - array from which the first item needs to be removed and deleted
Returns: void
unshift(arr, val, maxItems)
add an item to the beginning of an array with max items cap
Parameters:
arr : - array to which the item needs to be added at the beginning
val : - value of item which needs to be added
maxItems : - max items array can hold. After that, items are removed from the other end
Returns: resulting array
clear(arr)
remove and delete all items in an array
Parameters:
arr : - array which needs to be cleared
Returns: void
push(arr, val, maxItems)
add an item to the end of an array with max items cap
Parameters:
arr : - array to which the item needs to be added at the beginning
val : - value of item which needs to be added
maxItems : - max items array can hold. After that, items are removed from the starting index
Returns: resulting array
check_overflow(pivots, barArray, dir)
finds difference between two timestamps
Parameters:
pivots : pivots array
barArray : pivot bar array
dir : direction for which overflow need to be checked
Returns: bool overflow
get_trend_series(pivots, length, highLow, trend)
finds series of pivots in particular trend
Parameters:
pivots : pivots array
length : length for which trend series need to be checked
highLow : filter pivot high or low
trend : Uptrend or Downtrend
Returns: int trendIndexes
get_trend_series(pivots, firstIndex, lastIndex)
finds series of pivots in particular trend
Parameters:
pivots : pivots array
firstIndex : First index of the series
lastIndex : Last index of the series
Returns: int trendIndexes
sma(source)
calculates sma for elements in array
Parameters:
source : source array
Returns: float sma
ema(source, length)
calculates ema for elements in array
Parameters:
source : source array
length : ema length
Returns: float ema
rma(source, length)
calculates rma for elements in array
Parameters:
source : source array
length : rma length
Returns: float rma
wma(source, length)
calculates wma for elements in array
Parameters:
source : source array
length : wma length
Returns: float wma
hma(source, length)
calculates hma for elements in array
Parameters:
source : source array
length : hma length
Returns: float hma
ma(source, matype, length)
wrapper for all moving averages based on array
Parameters:
source : source array
matype : moving average type. Valud values are: sma, ema, rma, wma and hma
length : moving average length length
Returns: float moving average
getFibSeries(numberOfFibs, start)
gets fib series in array
Parameters:
numberOfFibs : number of fibs
start : starting number
Returns: float fibArray

LeoLibraryLibrary "LeoLibrary"
A collection of custom tools & utility functions commonly used with my scripts
getDecimals() Calculates how many decimals are on the quote price of the current market
Returns: The current decimal places on the market quote price
truncate(float, float) Truncates (cuts) excess decimal places
Parameters:
float : _number The number to truncate
float : _decimalPlaces (default=2) The number of decimal places to truncate to
Returns: The given _number truncated to the given _decimalPlaces
toWhole(float) Converts pips into whole numbers
Parameters:
float : _number The pip number to convert into a whole number
Returns: The converted number
toPips(float) Converts whole numbers back into pips
Parameters:
float : _number The whole number to convert into pips
Returns: The converted number
av_getPositionSize(float, float, float, float) Calculates OANDA forex position size for AutoView based on the given parameters
Parameters:
float : _balance The account balance to use
float : _risk The risk percentage amount (as a whole number - eg. 1 = 1% risk)
float : _stopPoints The stop loss distance in POINTS (not pips)
float : _conversionRate The conversion rate of our account balance currency
Returns: The calculated position size (in units - only compatible with OANDA)
getMA(int, string) Gets a Moving Average based on type
Parameters:
int : _length The MA period
string : _maType The type of MA
Returns: A moving average with the given parameters
getEAP(float) Performs EAP stop loss size calculation (eg. ATR >= 20.0 and ATR < 30, returns 20)
Parameters:
float : _atr The given ATR to base the EAP SL calculation on
Returns: The EAP SL converted ATR size
barsAboveMA(int, float) Counts how many candles are above the MA
Parameters:
int : _lookback The lookback period to look back over
float : _ma The moving average to check
Returns: The bar count of how many recent bars are above the MA
barsBelowMA(int, float) Counts how many candles are below the MA
Parameters:
int : _lookback The lookback period to look back over
float : _ma The moving average to reference
Returns: The bar count of how many recent bars are below the EMA
barsCrossedMA(int, float) Counts how many times the EMA was crossed recently
Parameters:
int : _lookback The lookback period to look back over
float : _ma The moving average to reference
Returns: The bar count of how many times price recently crossed the EMA
getPullbackBarCount(int, int) Counts how many green & red bars have printed recently (ie. pullback count)
Parameters:
int : _lookback The lookback period to look back over
int : _direction The color of the bar to count (1 = Green, -1 = Red)
Returns: The bar count of how many candles have retraced over the given lookback & direction
getBodySize() Gets the current candle's body size (in POINTS, divide by 10 to get pips)
Returns: The current candle's body size in POINTS
getTopWickSize() Gets the current candle's top wick size (in POINTS, divide by 10 to get pips)
Returns: The current candle's top wick size in POINTS
getBottomWickSize() Gets the current candle's bottom wick size (in POINTS, divide by 10 to get pips)
Returns: The current candle's bottom wick size in POINTS
getBodyPercent() Gets the current candle's body size as a percentage of its entire size including its wicks
Returns: The current candle's body size percentage
isHammer(float, bool) Checks if the current bar is a hammer candle based on the given parameters
Parameters:
float : _fib (default=0.382) The fib to base candle body on
bool : _colorMatch (default=false) Does the candle need to be green? (true/false)
Returns: A boolean - true if the current bar matches the requirements of a hammer candle
isStar(float, bool) Checks if the current bar is a shooting star candle based on the given parameters
Parameters:
float : _fib (default=0.382) The fib to base candle body on
bool : _colorMatch (default=false) Does the candle need to be red? (true/false)
Returns: A boolean - true if the current bar matches the requirements of a shooting star candle
isDoji(float, bool) Checks if the current bar is a doji candle based on the given parameters
Parameters:
float : _wickSize (default=2) The maximum top wick size compared to the bottom (and vice versa)
bool : _bodySize (default=0.05) The maximum body size as a percentage compared to the entire candle size
Returns: A boolean - true if the current bar matches the requirements of a doji candle
isBullishEC(float, float, bool) Checks if the current bar is a bullish engulfing candle
Parameters:
float : _allowance (default=0) How many POINTS to allow the open to be off by (useful for markets with micro gaps)
float : _rejectionWickSize (default=disabled) The maximum rejection wick size compared to the body as a percentage
bool : _engulfWick (default=false) Does the engulfing candle require the wick to be engulfed as well?
Returns: A boolean - true if the current bar matches the requirements of a bullish engulfing candle
isBearishEC(float, float, bool) Checks if the current bar is a bearish engulfing candle
Parameters:
float : _allowance (default=0) How many POINTS to allow the open to be off by (useful for markets with micro gaps)
float : _rejectionWickSize (default=disabled) The maximum rejection wick size compared to the body as a percentage
bool : _engulfWick (default=false) Does the engulfing candle require the wick to be engulfed as well?
Returns: A boolean - true if the current bar matches the requirements of a bearish engulfing candle
timeFilter(string, bool) Determines if the current price bar falls inside the specified session
Parameters:
string : _sess The session to check
bool : _useFilter (default=false) Whether or not to actually use this filter
Returns: A boolean - true if the current bar falls within the given time session
dateFilter(int, int) Determines if this bar's time falls within date filter range
Parameters:
int : _startTime The UNIX date timestamp to begin searching from
int : _endTime the UNIX date timestamp to stop searching from
Returns: A boolean - true if the current bar falls within the given dates
dayFilter(bool, bool, bool, bool, bool, bool, bool) Checks if the current bar's day is in the list of given days to analyze
Parameters:
bool : _monday Should the script analyze this day? (true/false)
bool : _tuesday Should the script analyze this day? (true/false)
bool : _wednesday Should the script analyze this day? (true/false)
bool : _thursday Should the script analyze this day? (true/false)
bool : _friday Should the script analyze this day? (true/false)
bool : _saturday Should the script analyze this day? (true/false)
bool : _sunday Should the script analyze this day? (true/false)
Returns: A boolean - true if the current bar's day is one of the given days
atrFilter(float, float) Checks the current bar's size against the given ATR and max size
Parameters:
float : _atr (default=ATR 14 period) The given ATR to check
float : _maxSize The maximum ATR multiplier of the current candle
Returns: A boolean - true if the current bar's size is less than or equal to _atr x _maxSize
fillCell(table, int, int, string, string, color, color) This updates the given table's cell with the given values
Parameters:
table : _table The table ID to update
int : _column The column to update
int : _row The row to update
string : _title The title of this cell
string : _value The value of this cell
color : _bgcolor The background color of this cell
color : _txtcolor The text color of this cell
Returns: A boolean - true if the current bar falls within the given dates

ZenLibraryLibrary "ZenLibrary"
A collection of custom tools & utility functions commonly used with my scripts.
getDecimals() Calculates how many decimals are on the quote price of the current market
Returns: The current decimal places on the market quote price
truncate(float, float) Truncates (cuts) excess decimal places
Parameters:
float : _number The number to truncate
float : _decimalPlaces (default=2) The number of decimal places to truncate to
Returns: The given _number truncated to the given _decimalPlaces
toWhole(float) Converts pips into whole numbers
Parameters:
float : _number The pip number to convert into a whole number
Returns: The converted number
toPips(float) Converts whole numbers back into pips
Parameters:
float : _number The whole number to convert into pips
Returns: The converted number
av_getPositionSize(float, float, float, float) Calculates OANDA forex position size for AutoView based on the given parameters
Parameters:
float : _balance The account balance to use
float : _risk The risk percentage amount (as a whole number - eg. 1 = 1% risk)
float : _stopPoints The stop loss distance in POINTS (not pips)
float : _conversionRate The conversion rate of our account balance currency
Returns: The calculated position size (in units - only compatible with OANDA)
getMA(int, string) Gets a Moving Average based on type
Parameters:
int : _length The MA period
string : _maType The type of MA
Returns: A moving average with the given parameters
getEAP(float) Performs EAP stop loss size calculation (eg. ATR >= 20.0 and ATR < 30, returns 20)
Parameters:
float : _atr The given ATR to base the EAP SL calculation on
Returns: The EAP SL converted ATR size
barsAboveMA(int, float) Counts how many candles are above the MA
Parameters:
int : _lookback The lookback period to look back over
float : _ma The moving average to check
Returns: The bar count of how many recent bars are above the MA
barsBelowMA(int, float) Counts how many candles are below the MA
Parameters:
int : _lookback The lookback period to look back over
float : _ma The moving average to reference
Returns: The bar count of how many recent bars are below the EMA
barsCrossedMA(int, float) Counts how many times the EMA was crossed recently
Parameters:
int : _lookback The lookback period to look back over
float : _ma The moving average to reference
Returns: The bar count of how many times price recently crossed the EMA
getPullbackBarCount(int, int) Counts how many green & red bars have printed recently (ie. pullback count)
Parameters:
int : _lookback The lookback period to look back over
int : _direction The color of the bar to count (1 = Green, -1 = Red)
Returns: The bar count of how many candles have retraced over the given lookback & direction
getBodySize() Gets the current candle's body size (in POINTS, divide by 10 to get pips)
Returns: The current candle's body size in POINTS
getTopWickSize() Gets the current candle's top wick size (in POINTS, divide by 10 to get pips)
Returns: The current candle's top wick size in POINTS
getBottomWickSize() Gets the current candle's bottom wick size (in POINTS, divide by 10 to get pips)
Returns: The current candle's bottom wick size in POINTS
getBodyPercent() Gets the current candle's body size as a percentage of its entire size including its wicks
Returns: The current candle's body size percentage
isHammer(float, bool) Checks if the current bar is a hammer candle based on the given parameters
Parameters:
float : _fib (default=0.382) The fib to base candle body on
bool : _colorMatch (default=false) Does the candle need to be green? (true/false)
Returns: A boolean - true if the current bar matches the requirements of a hammer candle
isStar(float, bool) Checks if the current bar is a shooting star candle based on the given parameters
Parameters:
float : _fib (default=0.382) The fib to base candle body on
bool : _colorMatch (default=false) Does the candle need to be red? (true/false)
Returns: A boolean - true if the current bar matches the requirements of a shooting star candle
isDoji(float, bool) Checks if the current bar is a doji candle based on the given parameters
Parameters:
float : _wickSize (default=2) The maximum top wick size compared to the bottom (and vice versa)
bool : _bodySize (default=0.05) The maximum body size as a percentage compared to the entire candle size
Returns: A boolean - true if the current bar matches the requirements of a doji candle
isBullishEC(float, float, bool) Checks if the current bar is a bullish engulfing candle
Parameters:
float : _allowance (default=0) How many POINTS to allow the open to be off by (useful for markets with micro gaps)
float : _rejectionWickSize (default=disabled) The maximum rejection wick size compared to the body as a percentage
bool : _engulfWick (default=false) Does the engulfing candle require the wick to be engulfed as well?
Returns: A boolean - true if the current bar matches the requirements of a bullish engulfing candle
isBearishEC(float, float, bool) Checks if the current bar is a bearish engulfing candle
Parameters:
float : _allowance (default=0) How many POINTS to allow the open to be off by (useful for markets with micro gaps)
float : _rejectionWickSize (default=disabled) The maximum rejection wick size compared to the body as a percentage
bool : _engulfWick (default=false) Does the engulfing candle require the wick to be engulfed as well?
Returns: A boolean - true if the current bar matches the requirements of a bearish engulfing candle
timeFilter(string, bool) Determines if the current price bar falls inside the specified session
Parameters:
string : _sess The session to check
bool : _useFilter (default=false) Whether or not to actually use this filter
Returns: A boolean - true if the current bar falls within the given time session
dateFilter(int, int) Determines if this bar's time falls within date filter range
Parameters:
int : _startTime The UNIX date timestamp to begin searching from
int : _endTime the UNIX date timestamp to stop searching from
Returns: A boolean - true if the current bar falls within the given dates
dayFilter(bool, bool, bool, bool, bool, bool, bool) Checks if the current bar's day is in the list of given days to analyze
Parameters:
bool : _monday Should the script analyze this day? (true/false)
bool : _tuesday Should the script analyze this day? (true/false)
bool : _wednesday Should the script analyze this day? (true/false)
bool : _thursday Should the script analyze this day? (true/false)
bool : _friday Should the script analyze this day? (true/false)
bool : _saturday Should the script analyze this day? (true/false)
bool : _sunday Should the script analyze this day? (true/false)
Returns: A boolean - true if the current bar's day is one of the given days
atrFilter(float, float) Checks the current bar's size against the given ATR and max size
Parameters:
float : _atr (default=ATR 14 period) The given ATR to check
float : _maxSize The maximum ATR multiplier of the current candle
Returns: A boolean - true if the current bar's size is less than or equal to _atr x _maxSize
fillCell(table, int, int, string, string, color, color) This updates the given table's cell with the given values
Parameters:
table : _table The table ID to update
int : _column The column to update
int : _row The row to update
string : _title The title of this cell
string : _value The value of this cell
color : _bgcolor The background color of this cell
color : _txtcolor The text color of this cell
Returns: A boolean - true if the current bar falls within the given dates
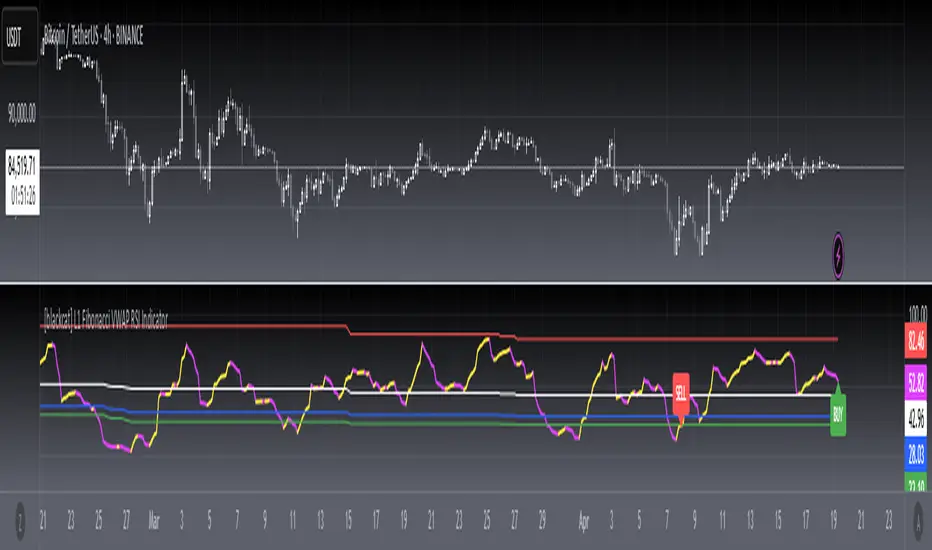
[blackcat] L1 Fibonacci VWAP RSI IndicatorLevel: 1
Background
Ingo Bucher proposed "Fibonacci RSI" in March,2003. It describes the advantages of considering Fibonacci retracement levels for use with the classic RSI indicator. Bucher reviews six charts, each displaying Fibonacci retracement levels for the RSI associated with each chart. The pine code given here will allow you to automatically recreate these charts for any security available in Tradingview. BTW, i enhanced it by changing RSI into VWAP RSI with hl2.
Function
For this Fib VWAP RSI indicator, it also applicable for original Bucher's fib concept. Bucher calculated his retracement levels by picking the RSI high and low for a given time window. In his examples, these were generally six months to a year's worth of data. Once the high and low were picked, he calculated retracement levels based on the well-known Fibonacci numbers (23.6%, 38.2%, 50%, 61.8%). This script here does the same thing. I use a "LookbackLength" (default: 400 bars), which represents a sliding data window that is used to determine the VWAP RSI high and low. The second input value controls the VWAP RSI period (default: 14 bars). The next three inputs select the retracement levels.
A total of eight different lines need to be drawn: the RSI itself, the 50% line, two retracements above the 50% point, two retracements below, and the zero and 100% lines. Pine script will create four plotlines per indicator, so I advise inserting the Fibonacci RSI twice. The first time it is inserted, leave the PlotRSI input with its default value, true. True tells pine script to plot the VWAP RSI itself. The second copy should have the input "Plot RSI" set to false. This will put the 50% line on your chart.
Inputs
LookbackLength --> Look Back Length.
RSILength --> RSI Length.
Fib1 and Fib2 --> Fibonacci lengths.
Key Signal
RawVWAPRSI --> Raw VWAP RSI output signal
Remarks
This is a Level 1 free and open source indicator.
Feedbacks are appreciated.
MA Strategy Emperor insiliconotThe Script offers 9 different EMAs with 14 different MA types.
The make use of the script is to find the entry on the 1-4 hour altcoins while using the in-built 13/21 crossover strategy to be used in sync with Heikin Ashi cross-over with Fib levels of 0.236 Fib level.
How to use it.
Entry is to be made when the
1. Cross over gives a P(Positive Sign) and the candle completely closes above the cross-over
2. When the Heikin Ashi turns green and the next green HA candle goes above the previous green HA candle.
3. The price should be at-least above the 0.236 Level from the Swing high.
All the Best.
EmperorBTC

Fibonacci Extension / Retracement / Pivot Points by DGTFɪʙᴏɴᴀᴄᴄɪ Exᴛᴇɴᴛɪᴏɴ / Rᴇᴛʀᴀᴄᴍᴇɴᴛ / Pɪᴠᴏᴛ Pᴏɪɴᴛꜱ
This study combines various Fibonacci concepts into one, and some basic volume and volatility indications
█ Pɪᴠᴏᴛ Pᴏɪɴᴛꜱ — is a technical indicator that is used to determine the levels at which price may face support or resistance. The Pivot Points indicator consists of a pivot point (PP) level and several support (S) and resistance (R) levels. PP, resistance and support values are calculated in different ways, depending on the type of the indicator, this study implements Fibonacci Pivot Points
The indicator resolution is set by the input of the Pivot Points TF (Timeframe). If the Pivot Points TF is set to AUTO (the default value), then the increased resolution is determined by the following algorithm:
for intraday resolutions up to and including 5 min, 4HOURS (4H) is used
for intraday resolutions more than 5 min and up to and including 45 min, DAY (1D) is used
for intraday resolutions more than 45 min and up to and including 4 hour, WEEK (1W) is used
for daily resolutions MONTH is used (1M)
for weekly resolutions, 3-MONTH (3M) is used
for monthly resolutions, 12-MONTH (12M) is used
If the Pivot Points TF is set to User Defined, users may choose any higher timeframe of their preference
█ Fɪʙ Rᴇᴛʀᴀᴄᴇᴍᴇɴᴛ — Fibonacci retracements is a popular instrument used by technical analysts to determine support and resistance areas. In technical analysis, this tool is created by taking two extreme points (usually a peak and a trough) on the chart and dividing the vertical distance by the key Fibonacci coefficients equal to 23.6%, 38.2%, 50%, 61.8%, and 100%. This study implements an automated method of identifying the pivot lows/highs and automatically draws horizontal lines that are used to determine possible support and resistance levels
█ Fɪʙᴏɴᴀᴄᴄɪ Exᴛᴇɴꜱɪᴏɴꜱ — Fibonacci extensions are a tool that traders can use to establish profit targets or estimate how far a price may travel AFTER a retracement/pullback is finished. Extension levels are also possible areas where the price may reverse. This study implements an automated method of identifying the pivot lows/highs and automatically draws horizontal lines that are used to determine possible support and resistance levels.
IMPORTANT NOTE: Fibonacci extensions option may require to do further adjustment of the study parameters for proper usage. Extensions are aimed to be used when a trend is present and they aim to measure how far a price may travel AFTER a retracement/pullback. I will strongly suggest users of this study to check the education post for further details, where to use extensions and where to use retracements
Important input options for both Fibonacci Extensions and Retracements
Deviation, is a multiplier that affects how much the price should deviate from the previous pivot in order for the bar to become a new pivot. Increasing its value is one way to get higher timeframe Fib Retracement Levels
Depth, affects the minimum number of bars that will be taken into account when building
█ Volume / Volatility Add-Ons
High Volatile Bar Indication
Volume Spike Bar Indication
Volume Weighted Colored Bars
This study benefits from build-in auto fib retracement tv study and modifications applied to get extentions and also to fit this combo
Disclaimer:
Trading success is all about following your trading strategy and the indicators should fit within your trading strategy, and not to be traded upon solely
The script is for informational and educational purposes only. Use of the script does not constitute professional and/or financial advice. You alone have the sole responsibility of evaluating the script output and risks associated with the use of the script. In exchange for using the script, you agree not to hold dgtrd TradingView user liable for any possible claim for damages arising from any decision you make based on use of the script

Fibonacci levels alerted as Support and Resistance lvlsThis script is another Fibonacci script however this script gives select signals indicating when a resistance level is hit aswell as a support level.
A resistance level is calculated by price action failing to close or open above a fib level yet its high crossing the level. This essentially means price action was too weak to break this level.
The same goes for support levels where the price open and closes above the fib level yet the price low was below. This means the bears where unable to break the support level and may potentially rebound.
This script uses the 0.764, 0.618, 0.5, 0.382 and 0.236 levels. More can be added to script if asked.
From personal use I use the script to help guide the entry and exit for potential trades aswell as helping mark price targets and exit levels. However i never use this script alone and actively ensure it is used alongside other technical indicators.
Within the script there is also a plotted Fibonacci retracement chart which can help visually aid the trader.

(Custom)Bollingers Bands Fibonacci ratiosThis is a modified Bollinger bands that uses EMA,with ATH to get a main average and then takes Standard Deviations by Fib ratios outwards. It is very useful for Entries and exits. I Typically use it to exit longs or shorts, entries are a bit harder. Generally the price will wick just barely or briefly into the end of one of the bands and then leave, it PINGs it and that is your exit. It is a little hard to predict in real time and set a Take profit at any exact point because it is always moving, but because it constantly adjust it is pretty damn accurate at nailing it. They sorta work at any timeframe, so its up to you, though for Crypto it doesnt do so well above 4hr because it can pump really hard or dump hard and super stretch the bands. Best numbers for the Average are Fib numbers. Stick to using 13, 21, and 34. 34 is my favorite and works best for me, But its up to you. Sometimes its benificial to use 34 on lower timeframes and maybe a smaller number on larger ones IE 21 or 2 or 4hr charts.
Once again it is up to you how to use it. I dont have credit for the original version of it. It is someone else's who I think modified another person's version lol. Ill try and find their name and post a comment though for who I took the original code from.

Padovan RetracementsAlternative to Fibonacci levels. There are actually many such ratios besides the golden ratio and the Fib sequence. This is based on the plastic ratio or the Padovan sequence.
If you wish to use the ratios in the fib tool, the following are the corresponding alternate values :
0.245
0.325
0.430
0.570
0.755
1.000
1.325
1.755
2.325
3.080
4.080
