Cuban's Reversion BandsThere are quite a few band indicators out there, ATR, VWAP, Bollinger, Fib, etc. however, I could never find anything that could scale accurately during periods of high volatility. That brought me to writing this indicator.
These bands use my Volume-Weighted Anchored Trend (VWAT) for the basis and highlight the standard deviation that you might expect high probability reversals to occur from.
I use these bands in my own trading system. The default settings are quite effective but you're able to modify the std multiplier within the settings as you see fit.
Generally, I would only play reversals during a ranging environment, however even if the market is trending, these bands will assist in spotting a weakening trend.
An ideal trend reversal would be a wick into the outer band, followed shortly by a weaker sweep of the previous move and wicking the inner band.
Hopefully you'll find this useful in your trading!
Cari dalam skrip untuk "fib"

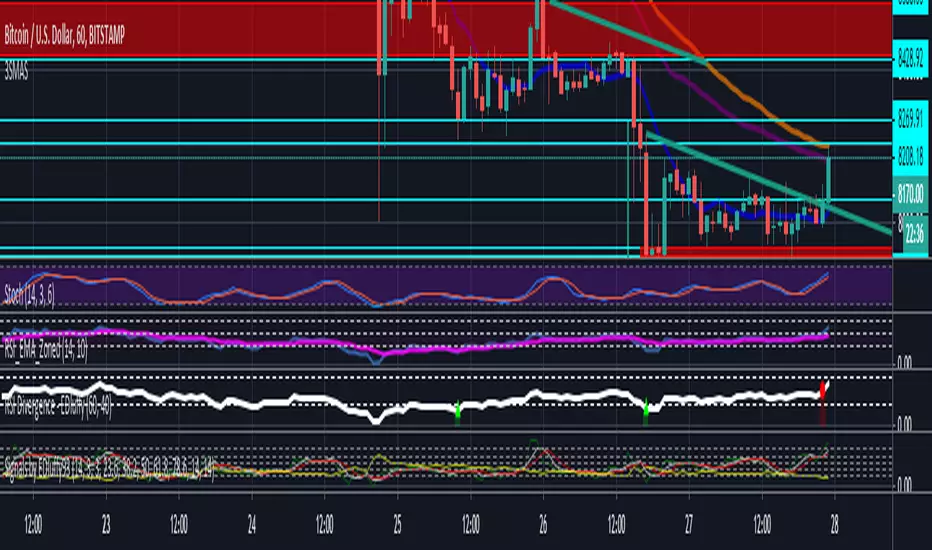
(JS) Ultimate RSISo my goal here was to combine all of my RSI ideas into a single indicator in order to make kind of a "Swiss Army Knife" version of the Relative Strength Index ...
------------------------------------------------------------------------------------------------------------------------------------------------------------------------------------------------------------------------------------------------------------------
So, let's begin with the first RSI indicator I made, which is the RSIDVW (Divergence/Volume Weighted);
To rephrase my original post, the "divergence/volume weighted" portion is meant to expand upon the current RSI format by adding more variables into the equation.
The standard RSI is based off one value that you select (open, close, OHLC4, HLC3, etc.) while this version takes three variables into account.
The default setting is to have RSI normal without anything added to it (Divergence Weight = 0)
1st - it takes the standard variable that RSI normally uses.
2nd - it factors RSI divergence by taking the RSI change % and price change % to form a ratio. Using this ratio, I duplicated the RSI formula and created a divergence RS to be factored in with the standard price RS .
3rd - it takes Relative Volume and amplifies/weakens the move based upon volume confirmation. (So if Relative Volume for a price bar is 1.0, the RSI plot would be the same as it normally would)
So to explain the parameters
- Relative Volume Length: This uses the RV length you specify to determine spikes in volume (or lack of volume ), which then is added into the formula to influence the strength of the RSI move
- RV x Divergence: This is how I calculated the original formula, but you can leave this unchecked to turn Relative Volume off, or apply elsewhere.
- RV x RS: There's two sides, Divergence RS and Standard RS - these check marks allow you to select which part you prefer to be multiplied by Relative Volume .
Checking neither turns off Relative Volume , while checking both amplifies its effects by placing it on both sides of the equation.
-Divergence Weight: This controls how much the DVW portion of the formula influences the RSI plot. As I referred to earlier, default is 0 making RSI normal. The Scale is 0-2, so 1.0 would be the same as 50%.
When I do have DVW on, I generally set it to 0.5
-SMA Divergence: To smooth, or not to smooth, that is the question. UJsing an SMA here is much smoother in my opinon, but leaving it unchecked runs it through an RMA the same way standard RSI is calculated.
-Show Fractal Channel: This allows you to see the whole fractal channel around the RSI (This portion of the code, compliments of the original Ricardo Santos fractal script)
------------------------------------------------------------------------------------------------------------------------------------------------------------------------------------------------------------------------------------------------------------------
The next portion of the script is adding a "Slow RSI"...
This is rather simple really, it allows you to add a second RSI plot so that you can watch for crossovers between fast and slow lines.
-Slow RSI: This turns on the second RSI Plot.
-Slow RSI Length: This determines the length of the second RSI Plot.
------------------------------------------------------------------------------------------------------------------------------------------------------------------------------------------------------------------------------------------------------------------
Pivot Point RSI was something a friend of mine requested I make which turned out pretty cool, I thought... It is also available in this indicator.
-Pivot Points: Selecting this enables the rest of the pivot point related parts of the script
If Pivot Points isn't selected, none of the following things will work
-Plot Pivot: Plots the pivot point .
-Plot S1/R1: Plots S1/R1.
-Plot S2/R2: Plots S2/R2.
-Plot S3/R3: Plots S3/R3.
-Plot S4/R4: Plots S4/R4.
-Plot S5/R5: Plots S5/R5.
-Plot Halfway Points: Plots a line between each pivot .
-Show Pivot Labels: Shows the proper label for each pivot .
When using intraday charts, from a 15 minute interval or less the pivots are calculated based on a single days worth of price action, above that the distance expands.
Here are the current resolutions Pivot Points will work with:
Minutes - 1 , 2, 3, 5, 10, 13, 15, 20, 30, 39, 78, 130, 195
Hours - 1, 2, 3, 4, 5, 6
Daily
Weekly
Currently not available on seconds or monthly
------------------------------------------------------------------------------------------------------------------------------------------------------------------------------------------------------------------------------------------------------------------
Background Colors
Background Colors: I have six color schemes I created for this which can be toggled here (they can be edited).
Gray Background for Dark Mode: Having this on looks much better when using dark mode on your charts.
------------------------------------------------------------------------------------------------------------------------------------------------------------------------------------------------------------------------------------------------------------------
Now finally the last portion, Fibonacci Levels
-Fibonacci Levels: This is off, by default, which then uses the standard levels on RSI (30-50-70). When turned on, it removes these and marks fib levels from 0.146 through 0.886.
------------------------------------------------------------------------------------------------------------------------------------------------------------------------------------------------------------------------------------------------------------------
So the quick rundown:
Ultimate RSI contains "divergence/volume weighted" modifications, a slow RSI plot, pivot points , and Fibonacci levels all while auto-plotting divergence and having the trend illustrated in the background colors.
RSI has always been my "go to" indicator, so I hope you all enjoy this as much as I do!

Ori Auto Fibonacci RetracementDraws last -input- bars fibonacci retracement levels.
Change Styles
Change Colors
Switch Placements
Change Line Width
Reverse Levels
Extend Rigt, Left or Both
Change Fib Levels
Hide info labels

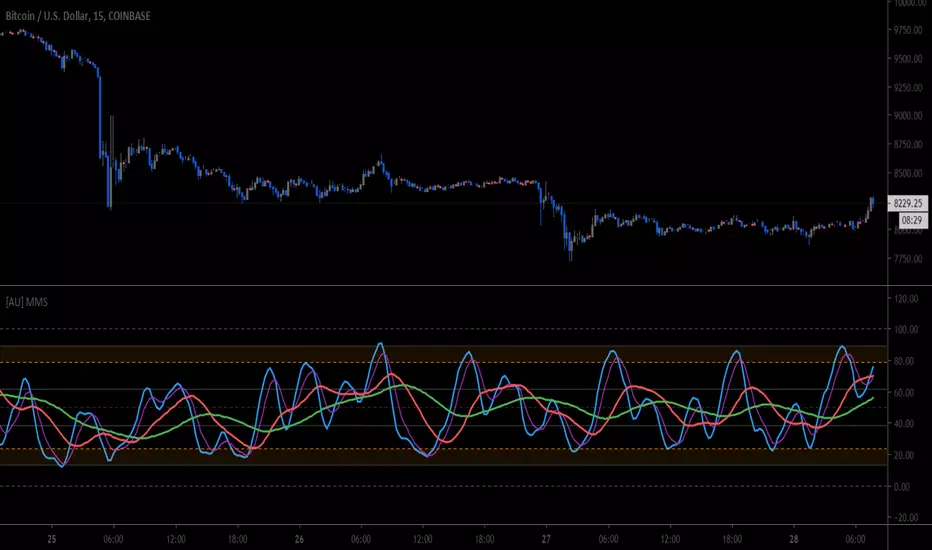
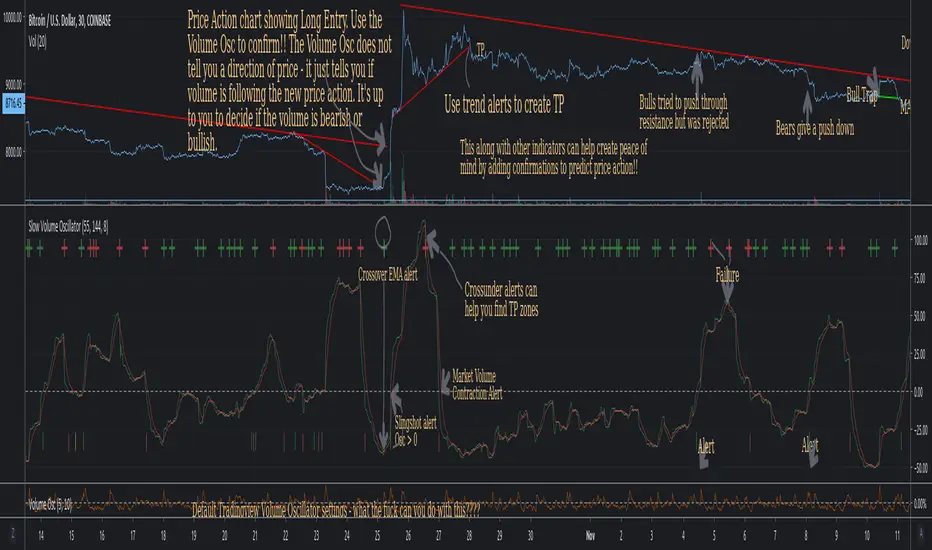
Slow Volume Oscillator Indicator - Just a Better Way To TradeThis script is nothing new. However, I feel that traders do not know the full potential it can provide if they just increase the lookback periods.
Tradingview's default Vol Osc uses a fast setting of 5 and a slow setting of 10. It just paints pointless scribbling. Slow all your indicators down and wake up to a whole new world of Technical Analysis.
To create consistency with variables I typically use Fib numbers for lookback periods. (3,5,8,13,21,34,55,89,144,233,377,610,987)
As noted in chart. An increase in volume can be either bullish or bearish. It's up to you to decide which way price action will move.
If you use with other indicators you can create more confirmations.
More confirmations = peace of mind
My favorite indicators are (Detrended Price Oscillator, Momentum, MACD, Chaikin Money Flow, Ultimate Oscillator, and this Volume Oscillator)
Here is just one example of MACD strategy indicator that can be used with this Vol Oscillator
Cucumber FibsCucumber Bot Fibonacci tool, automatically generates fibonacci resistance and support levels.
You can configure the number of days.

XABCD ScannerXABCD Scanner for TradingView
These bullish and bearish 5-point patterns are based on various Fibonacci retracement levels and signify potential reversal zones (PRZ).
As they become 80% complete, the dashed-line pattern will appear, displaying the PRZ and giving you time to prepare for a reversal.
Different combinations of specific fib retracements and extensions result in different patterns, and each is named for identification.
Bullish patterns signify a potential turn to the upside are colored green.
Bearish patterns signify a potential turn to the downside are colored red.
9 popular patterns are currently recognized.
XABCDs can be applied to all markets: crypto, forex, commodities, indices, etc.
For access, please visit the link in our Signature below, or shoot us a PM.

IMR DAILY FIBGREETINGS TRADERS !!!
TRADE in trend
with support & resistence of fibonachi pivot of daily
usefull for each & every script
built in ema crossovers for safe traders
specialy used for intraday (1-2-3-5 min timeframe )& swing trades SIMPEL & HANDY INDICATOR
tried to kept the function of indicatoer very easy & user freindly
plz use & share your feedback
ENJOY LIKE & SHARE TO OTHERS !!!!

VBF Trader PRO for BTC and altcoins with LONG and SHORT alertsThis script allows you to catch trend moves between BB critical levels (red and green zones on the chart) and very good for daily scalping ether for bitcoin or any altcoins to USDT or BTC trading pairs. Probability is very HIGH.

FibboGattoFibboGatto
Up = crossover(FG,ema(FG,period)) , color=blue
Down = crossunder(FG,ema(FG,period)) , color=orange
Uptrend = (FG>ema(FG,period)) ,color=lime
Downtrend = (FG

Swing Trade Pros - Auto Fibonacci IndicatorThe Swing Trade Pros Auto Fibonacci indicator automatically plots a fibonacci retracement based on the swing high and swing low of the weekly price action. The fibonacci is automatically updated in real time as new highest and lowest values appears amongst the selected bars. The indicator accurately predicts the high and low points of the overall trend.

[C] SMA multi TimeFrame with Ext. Fib PPThis script adds multi time frame Simple moving Average on a single time frame. It enables you to judge the moving average of a larger period on a small time frame. The added bonus of Fibonacci levels with additional support and resistance points works well with most NSE equity items on a intraday 5 min time frame.
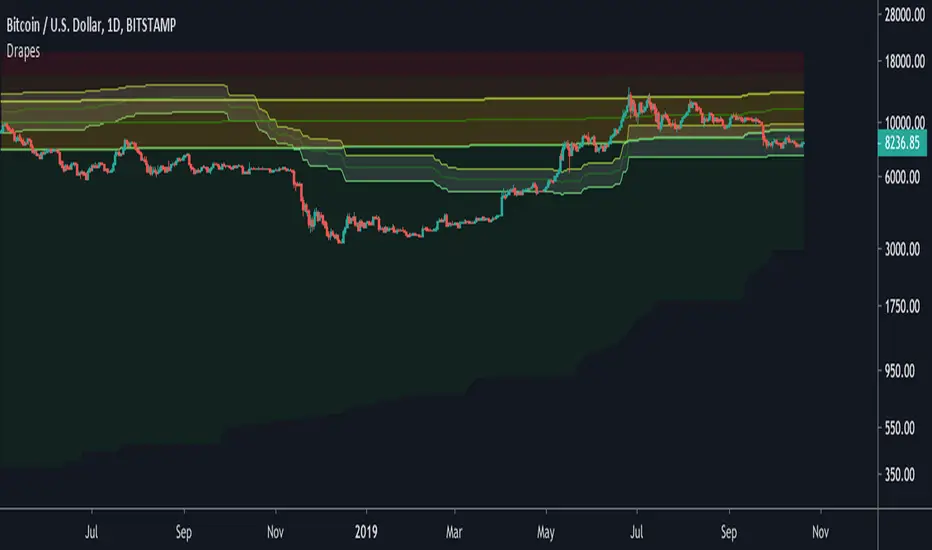
Fibonacci Drapes (Auto / Dynamic Fib Tool)Adjustable Look-back Periods
Adjustable Appearance
Adjustable Ratios
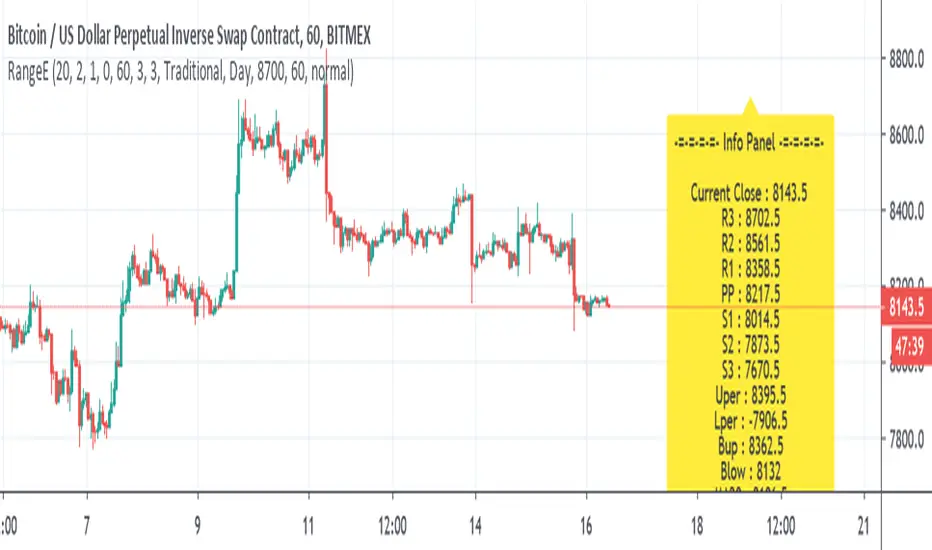
Range EstimateAs a trader I need to know what are the best ranges to get in or out
So this tool try to help a little bit .
First we have Pivot points (all forms with fib ,traditional etc)
next is percentage channel (uper=upper % from close and Lper=lower % from close) , in btc I use 3% up or low for 1 hour candles as it give me good range of lower and upper bound . This you need to change for different TF or different assets
next we have Bollinger upper and lower (Bup= Bollinger upper and Blow=Bollinger lower) it has also MTF function
last we MA =,20,50,100,200
in total the aim of this indicator is to give fast glance on the numbers that important to you as trader fast with a clean graph so you can add your indicator to it to see better how they work
The info panel you can change the font size, you can change distance by offset
and the position on the graph , you need to adjust with position -in this case since it btc I put number of 8700
let say it ETH then I put a number 5% above the close number
if it XRP = then the same trick , lets say 0.3 etc
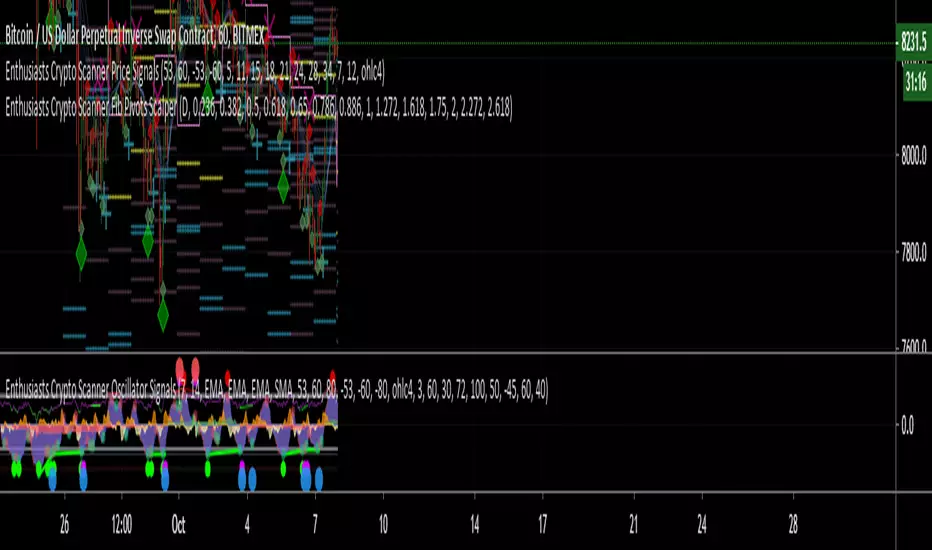
Enthusiasts Crypto Scanner Fib Pivots NanoScalperThis indicator prints Fibonnaci Pivots directly derived from price action, it only prints in the hourly timeframe which makes it the perfect tool scalp long or short orders in the 1m to 5min chart.

Ifish KAMA Kaufman’s Adaptive Moving Average (KAMA) was developed by American quantitative financial theorist, Perry J. Kaufman, in 1998. The technique began in 1972 but Kaufman officially presented it to the public much later, through his book, “Trading Systems and Methods.” Unlike other moving averages, Kaufman’s Adaptive Moving Average accounts not only for price action but also for Market Volatility.
When market volatility is low, Kaufman’s Adaptive Moving Average remains near the current market price, but when volatility increases, it will lag behind. What the KAMA indicator aims to do is filter out “market noise” – insignificant, temporary surges in price action. One of the primary weaknesses of traditional moving averages is that when used for trading signals, they tend to generate many false signals. The KAMA indicator seeks to lessen this tendency – generate fewer false signals – by not responding to short-term, insignificant price movements.
Traders generally use the moving average indicator to identify market trend and reversals.
When calculating Kaufman’s Adaptive Moving Average, the following standard settings are used:
10 – Number of periods for the Efficiency Ratio
2 – Number of periods for the fastest exponential moving average
30 – Number of periods for the slowest exponential moving average
One of the uses of Kaufman’s Adaptive Moving Average is to identify the general trend of current market price action. Basically, when the KAMA indicator line is moving lower, it indicates the existence of a downtrend. On the other hand, when the KAMA line is moving higher, it shows an uptrend. As compared to the regular MA.
the KAMA indicator is less likely to generate false signals that may cause a trader to incur losses.
Kaufman’s Adaptive Moving Average can also be used to spot the beginning of new trends and pinpoint trend reversal points. One way to do this is by plotting two KAMA lines on a chart – one with a more short-term moving average and another with a longer-term moving average. When a faster KAMA line crosses above a slower KAMA line, this indicates a change from a downtrend to an uptrend. The trader can take a long position and close the trade when the faster MA line crosses back to beneath the slower MA line. Trading signals can also be derived by the movement of market price in relation to Kaufman’s Adaptive Moving Average. If price crosses from below to above the KAMA line, that is a bullish (buy) signal. Conversely, price falling from above the KAMA line to below it is a bearish (sell) signal.
Kama will color flip automatically when cross happens.
green = bullish flip
red = bearish flip
Ma line by its self just great to find s/r levels.
the periods that I like to use as input, I prefer fib sequence numbers
ea: 3,13, 21, 34 etc.
For more info or trading concept check my profile.

Medic Pulse Indicator EMA/SMASimple 10 EMA / 10 SMA script.
I change the values all the time, use what you like. I love Fib numbers.
I like to keep the EMA's as thick lines, and SMA's as thin lines.
Makes them easily visually distinguishable.
Enthusiasts Crypto Scanner Fib Pivots SwingerThis indicator prints Fibonnaci Pivots directly derived from price action, it works in the weekly and monthly timeframe which makes it ideal to preemptively enter long or short positions in specific support and resistence fibbonaci levels.

Enthusiasts Crypto Scanner Fib Pivots ScalperThis indicator prints Fibonnaci Pivots directly derived from price action, it only prints in the daily timeframe which makes it the perfect tool scalp long or short orders in support or resistence levels.
PIP Assassins Monday Candles Support & ResistanceRules Checklist
Before anything:
Check News for your pair.
Absolute Number 1* Use Monday Candles Support & Resistance rules below before proceeding
1. Find a fake Breakout (Head of the head and shoulder. A left shoulder should be always to the left)
2. Draw Fibs after you see retracement forming
3. Plot Support and resistance lines on 50% and 61.8%
4. Check past to see if these areas are strong support and resistance.
5. If Support & Resistance land on 50% or 61.8% on a Monday High or Low and on the left shoulder then go to step 6.
6. Determine Order Type based on direction
7. Place Limit order on your MT4 app
**How to use Monday Candles as Support & Resistance**
1. Check the Monday Highs and Lows
2. Wait for a candle to break and close outside of a Monday High or Low.
3. Set an alert for a the crossing of a candle at a Monday High or Low depending on the direction
of the market you want to see.
Look for imbalances in the market. its a missing right shoulder on a head and shoulder pattern

finding the lowEasy script that give you to find low points in much more effective way ,so it very good to find entry
exit can be by fibs , pivot or take profit system etc
but the hardest thing in a trade is to locate where the low is found
so using this special rsi +mtf system of no repaint it more easy to detect it