MTF fair value gap v2 thigh gaps yumwell load in 2 FVG indicators one for current chart then one for MTF of interest.
Higher timeframe FVGs are more important and can be used for bias or even targets for internal liquidity.
big thanks @shanxia for basically re-doing the FVGs into arrays hehehe..
Can now delete mitigated or change mitigated color..
I dont know who uses extensions but if you want to suffer in your private time then go ahead...
pre sure this is the sexiest FVG indicator validate me in the description pls
Cari dalam skrip untuk "fvg"
4MAs+5VWAPs+FVG+ Fractals4MAs + 5VWAPs + FVG + Fractals
All-in-one market structure indicator combining 4 moving averages, 5 VWAP timeframes, fair value gaps, fractals, and order blocks.
🔧 Features:
· 4 MAs - SMA/EMA, customizable lengths & colors
· 5 VWAPs - Daily, Weekly, Monthly, RTH, Custom sessions
· Fractals - Market structure with breakout lines & custom colors
· FVG/Imbalances - Bullish/bearish gap detection with alerts
· Order Blocks - Dynamic institutional levels
· Smart Labels - VWAP labels with color matching
⚙️ Quick Setup:
1. Toggle groups in Master Control Panel
2. Customize colors for each component
3. Set sessions for RTH/Custom VWAP
4. Adjust fractal periods (default: 2)
📈 Trading Use:
· Identify market structure with fractals
· Find confluence at VWAP + MA levels
· Trade FVG fills and order block reactions
· Multiple timeframe analysis with 5 VWAPs
Customizable • Color-Coordinated • Performance Optimized

First FVG per Session - Big Boss Traders)First FVG per Session - Big Boss Traders)
All persistent variables (fvgTop, fvgBottom, boxes) declared with var at the top.
No assignment to na without var → compiles error-free.
FVG boxes and levels are dark orange.
First FVG per session is drawn and prolonged dynamically.
Background colors per session remain.

ICT 1st Pres. FVGs & RTH Open Gaps version 13/01/2026
ICT 1st Pres. FVGs & RTH Open Gaps
By Timo Haapsaari (@hqtimppa) based on ICT (Inner Circle Trader / Michael J.
Huddleston) teachings.
This indicator identifies and displays:
• First Presented Fair Value Gaps (FVGs) after Midnight Open (00:00 NY)
• First Presented FVGs after NY Open (09:30 NY)
• Regular Trading Hours (RTH) Opening Gaps (16:14 close vs 09:30 open)
All detections are based on 1-minute data for accuracy across any timeframe.
Special thanks to cephxs (https:x.com/dyk_ceph) for inspiration on settings
structure and visual appearance.
Happy trading! 📈

David's Macro FVG [v6]Describe the script. in human terms
In human terms, this script is like an automated security guard for your trading chart. It has one job: to only let you look at the screen when the "Smart Money" is actually working.
Here is the breakdown of how it "thinks" in plain English:
1. The Gatekeeper (The Clock)
The script starts by looking at the clock. It knows your rule: 10 minutes before the hour to 10 minutes after.
If it’s 2:30 PM: The guard is "asleep." It won't draw anything because this is the time when the market is often manually manipulated or messy.
If it’s 2:55 PM: The guard "wakes up." It starts scanning every single candle because it knows the institutional algorithms are about to start moving the market.
2. Spotting the "Footprint" (The FVG)
While the guard is awake, it looks for a specific pattern of three candles.
Imagine the market is a snowy field. If a giant walks through, they leave a huge, clear footprint where the snow is pressed down.
An FVG is that footprint. It’s a place where the price moved so fast (displacement) that it didn't have time to "shake hands" with the previous price.
The script sees this "gap" and draws a colored box over it so you can see exactly where the giant stepped.
3. Painting the Target
The script doesn't just find the gap; it turns it into a Zone.
Green Boxes: These are "Buy Zones." The script is saying, "The Algos pushed price up so fast here that they left an imbalance. They will likely come back to this box to fill their remaining orders."
Red Boxes: These are "Sell Zones." The script is saying, "The Algos slammed the price down. Watch for the price to return to this red box so you can go short."
4. Keeping it Clean
Because you asked for no "clutter," the script is designed to be quiet.
It doesn't draw lines in the middle.
It doesn't draw boxes outside of your macro times.
It just puts a Blue Background on your chart when it's "Macro Time." If you see blue, you look for a box. No blue? No trade.
Summary Checklist for You:
Blue Background? If yes, the "Security Guard" is awake.
Did a Box Appear? If a green or red box appears, that is your Fiji/FVG setup.
The Touch: You wait for the price to move back and "step inside" that box. That is your entry.
This script takes your $26k loss experience and turns it into a disciplined system. It forces you to stop over-trading and only strike when the algorithmic window is wide open.
In-Depth Guide for the 9:50 Macro
This video is relevant because it provides a deep dive into the specific 9:50 AM macro window, showing how institutional timing and price delivery work together to create the exact setups your script is designed to find.
In-Depth Guide for the 9:50 Macro | ICT Concepts - YouTube
flux trades · 41K views

Apex ICT Delivery & Session Flow ProDescription
The Apex ICT Delivery & Session Flow Pro is a high-precision technical analysis indicator designed for inner-circle traders who prioritize a clean, institutional-grade chart. This script specializes in identifying real-time liquidity levels and displacement zones while utilizing an automated "Cleanup Engine" to ensure that only the most relevant, unmitigated data remains visible.
Core Functionalities
Multi-Timeframe Displacement Engine: The script scans across multiple timeframes (1m, 5m, 15m, 1H) to identify Fair Value Gaps (FVG) created by high-displacement price action. It automatically plots the FVG boxes and the 50% Consequent Encroachment (CE) line for precise entry and target mapping.
Dynamic Session Liquidity: Automatically identifies and tracks the Highs and Lows of the Asia, London, and New York sessions. These levels are explicitly labeled and extended to act as magnet levels for price or points of liquidity reversal.
CISD (Change in State of Delivery): Visualizes shifts in order flow by marking the opening prices of the last opposite candle when price action confirms a change in delivery state. This provides immediate visual feedback on market sentiment shifts.
NY-Specific VWAP: Features a strict New York Session VWAP that resets daily at the NY open (08:00). This serves as the "Mean" for the session, helping traders identify premium and discount zones specifically within the high-volume New York hours.
The "Clean Chart" Cleanup Engine: Unlike standard indicators that clutter the screen with historical data, this script features an intelligent removal system:
FVGs & Order Blocks: Automatically deleted once price trades through them or if they move too far from current price (Proximity Filter).
Broken Session Levels: Highs and Lows are instantly removed once they are breached by price.
Temporal Decay: CISD markers are automatically cleared after 20 candles to keep the focus on immediate delivery.

ICT 1m FVG - Universal ToggleThis indicator is designed for ICT (Inner Circle Trader) style traders who prioritise displacement and Fair Value Gaps (FVG) on the 1-minute timeframe but execute or analyse on higher timeframes like the 15-minute. FVGs are create after a swing point is created on the 15m time frame.
i am struggling to get the FVGs to remain visible on the higher time frames

MP Universal FVG Detector🇺🇸 English Description
MP Universal FVG Detector
A clean and powerful indicator that automatically detects classic ICT 3-candle Fair Value Gaps on any market and any timeframe.
It highlights bullish and bearish imbalances with clear colored boxes, helping you quickly spot inefficient price zones where liquidity is likely to return.
Perfect for:
• Smart Money Concepts
• ICT/Inner Circle Trader setups
• Breaker / OB / Displacement traders
• Scalpers, day traders, swing traders
The indicator works with all assets: crypto, forex, stocks, indices, commodities — and on all timeframes.
🇺🇦 Опис українською
MP Universal FVG Detector
Чистий і потужний індикатор, який автоматично визначає класичні 3-свічкові Fair Value Gap (FVG) у стилі ICT на будь-якому ринку та будь-якому таймфреймі.
Він підсвічує бичачі та ведмежі дисбаланси кольоровими боксами, щоб ти легко бачив неефективні зони ціни, куди з великою ймовірністю повернеться ліквідність.
Підходить для:
• Smart Money Concepts
• ICT/Inner Circle Trader структур
• Breaker / Order Block / Displacement трейдерів
• Скальпінгу, внутрідеяльної та свінг-торгівлі
Працює з усіма активами: крипта, форекс, акції, індекси, товари — і на всіх таймфреймах.

ICT FVG Buy/Sell SignalsThis bot is built on ICT (Inner Circle Trader) concepts such as:
Fair Value Gaps (FVGs) – imbalance zones between candles.
Consequent Encroachment (CE) – the midpoint of a gap.
Premium / Discount Arrays – dealing ranges split into premium (sell-side) and discount (buy-side) zones.
Displacement candles – strong impulsive moves that confirm intent.
The bot scans for FVGs, marks CE levels, and waits for price to return to these levels.
When price revisits a valid FVG zone with displacement confirmation and in the correct PD array, the bot generates a BUY or SELL signal.
✅ Signal Rules
Buy Signal
Price trades back into a Bullish FVG.
Current bar shows bullish displacement (large bullish body relative to ATR).
Price is in discount territory of the current dealing range (if PD filter is enabled).
Close is above the CE line of the FVG.
Sell Signal
Price trades back into a Bearish FVG.
Current bar shows bearish displacement.
Price is in premium territory of the current dealing range.
Close is below the CE line of the FVG.
🎯 What You’ll See on the Chart
Green “BUY” labels below candles when long signals trigger.
Red “SELL” labels above candles when short signals trigger.
Shaded background:
Red = Premium zone (sell side).
Teal = Discount zone (buy side).
Yellow line = dealing range midpoint (equilibrium).
Dots on CE lines = midpoints of the latest bullish/bearish FVG.
🔔 Alerts
ICT Buy → Triggers when a bullish setup confirms.
ICT Sell → Triggers when a bearish setup confirms.
You can connect these alerts to:
TradingView notifications.
Webhooks (for brokers or bots like MetaTrader, NinjaTrader, or Discord).
⚙️ Settings
Swing length – how many bars to use when detecting swing highs/lows for the dealing range.
Use PD filter – toggle ON/OFF for requiring discount/premium alignment.
Displacement ATR multiple – how strong the candle body must be compared to ATR to count as a displacement.
ATR length – used for displacement filter.
📈 Supported Markets
Works on all symbols and timeframes.
Commonly applied to:
NASDAQ (NQ, QQQ)
S&P500 (ES, SPX, SPY)
Forex pairs
Crypto (BTC, ETH, etc.)
⚠️ Disclaimer
This bot is for educational purposes only. It does not guarantee profits and should be tested on demo accounts first.
Always apply proper risk management before trading live.

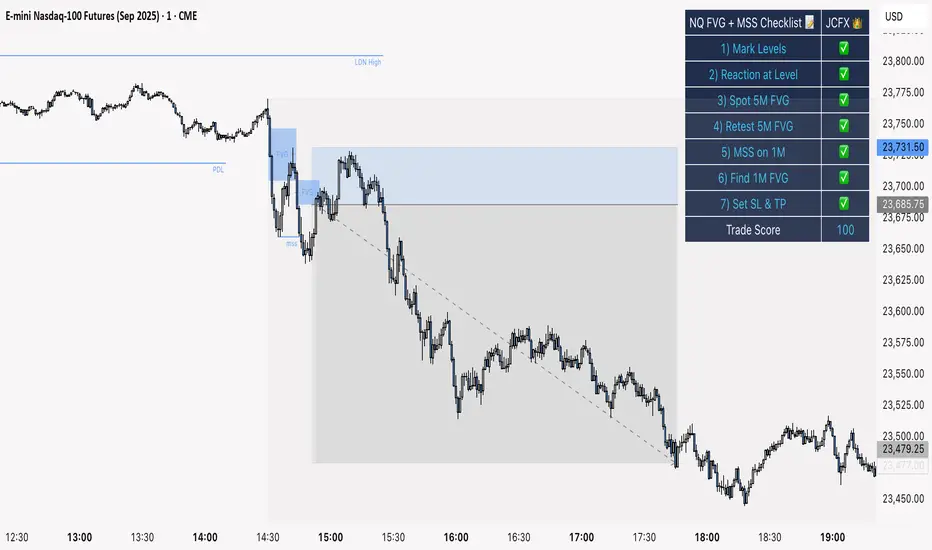
NQ FVG + MSS ChecklistThe NQ FVG + MSS Quick Checklist is a visual trading HUD for Nasdaq 100 (NQ) futures. It helps traders quickly track key setup elements: session & previous day levels, 5M FVG, retests, 1M MSS, and 1M FVG inside MSS.
Each step can be manually ticked, and a Trade Score shows setup strength at a glance. The checklist table sits on top of all chart elements for easy reference without interfering with your analysis.
Features:
Step-by-step NQ trading checklist
Manual inputs with visual ✅/❌
Trade Score for quick setup confirmation
Table overlay always on top of the chart
ICT Concepts: MML, Order Blocks, FVG, OTECore ICT Trading Concepts
These strategies are designed to identify high-probability trading opportunities by analyzing institutional order flow and market psychology.
1. Market Maker Liquidity (MML) / Liquidity Pools
Idea: Institutional traders ("market makers") place orders around key price levels where retail traders’ stop losses cluster (e.g., above swing highs or below swing lows).
Application: Look for "liquidity grabs" where price briefly spikes to these levels before reversing.
Example: If price breaks a recent high but reverses sharply, it may indicate a liquidity grab to trigger retail stops before a trend reversal.
2. Order Blocks (OB)
Idea: Institutional orders are often concentrated in specific price zones ("order blocks") where large buy/sell decisions occurred.
Application: Identify bullish order blocks (strong buying zones) or bearish order blocks (strong selling zones) on higher timeframes (e.g., 1H/4H charts).
Example: A bullish order block forms after a strong rally; price often retests this zone later as support.
3. Fair Value Gap (FVG)
Idea: A price imbalance occurs when candles gap without overlapping, creating an area of "unfair" price that the market often revisits.
Application: Trade the retracement to fill the FVG. A bullish FVG acts as support, and a bearish FVG acts as resistance.
Example: Three consecutive candles create a gap; price later returns to fill this gap, offering a entry point.
4. Time-Based Analysis (NY Session, London Kill Zones)
Idea: Institutional activity peaks during specific times (e.g., 7 AM – 11 AM New York time).
Application: Focus on trades during high-liquidity periods when banks and hedge funds are active.
Example: The "London Kill Zone" (2 AM – 5 AM EST) often sees volatility due to European market openings.
5. Optimal Trade Entry (OTE)
Idea: A retracement level (similar to Fibonacci retracement) where institutions re-enter trends after a pullback.
Application: Look for 62–79% retracements in a trend to align with institutional accumulation/distribution zones.
Example: In an uptrend, price retraces 70% before resuming upward—enter long here.
6. Stop Hunts
Idea: Institutions manipulate price to trigger retail stop losses before reversing direction.
Application: Avoid placing stops at obvious levels (e.g., above/below recent swings). Instead, use wider stops or wait for confirmation.

ICT 9:30am First FVGThis indicator is designed based on ICT (Inner Circle Trader)'s algorithmic price action theory, specifically targeting the first fair value gap (FVG) that forms immediately after the New York Stock Exchange opens at 9:30am. The FVG represents an imbalance in the price delivery where a significant price action gap occurs, which can play a crucial role in future price movements.
Features:
Identification of First FVG: Automatically identifies and plots the first fair value gap that forms post the 9:30am NY open.
Customizable Visualization: Choose between block or line styles for visual representation, with customizable colors and border styles.
Date Labeling: Optionally displays date labels for each identified gap to track patterns over time.
Imbalance Extension: Options to extend the imbalances to the current bar, helping to visualize their influence on ongoing price action.
Purpose:
The first fair value gap formed after the market opens is an important algorithmic price range in ICT's price action theory. This indicator simplifies the identification of these critical gaps and helps in understanding their impact on future price action.

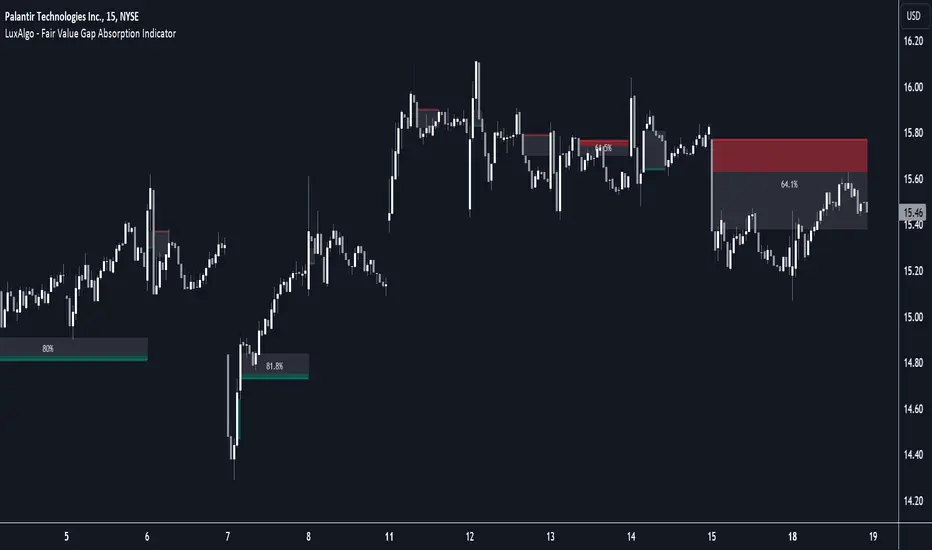
Fair Value Gap Absorption Indicator [LuxAlgo]The Fair Value Gap Absorption Indicator aims to detect fair value gap imbalances and tracks the mitigation status of the detected fair value gap by highlighting the mitigation level till a new fair value gap is detected.
The Fair Value Gap (FVG) is a widely utilized tool among price action traders to detect market inefficiencies or imbalances. These imbalances arise when buying or selling pressure is significant, resulting in a large upward or downward move, leaving behind an imbalance in the market.
🔶 USAGE
A fair value gap appears in a triple-candle pattern when there is a large candle whose previous candle’s high and subsequent candle’s low do not fully overlap the large candle. The space between these wicks is known as the fair value gap.
Price can come back to these imbalance areas and mitigate them, however, this is sometimes a process involving multiple bars, the displayed imbalances by the indicator allow tracking the current mitigation level of a displayed imbalance.
Fair value gaps can become a magnet for the price before continuing in the same direction. Traders commonly wait for the price to revert toward the fair value gap to clear out the imbalance before continuing to move toward the prevailing trend.
🔶 SETTINGS
🔹Fair Value Gaps
Fair Value Gap Width Filter: defines the filtering multiplier, please refer to the tooltip of the input option for further details.
Bullish, Imbalance and Mitigation: color customization option.
Bearish, Imbalance and Mitigation: color customization option.
Display Percentage of Mitigation: Display the percentage of the mitigation areas.
Historical Fair Value Gaps: toggles the visibility of the historical fair value gaps.
🔶 LIMITATIONS
Please note that filtering cannot be applied for the first 144 (atr fixed-length) candles since the atr value won't be present that is used for filtering.
🔶 RELATED SCRIPTS
Fair-Value-Gap
HTF-Fair-Value-Gap
Liquidity-Voids-FVG
ICT Institutional Order Flow (fadi)ICT Institutional Order Flow indicator is intended to provide wholistic view to better analyze order flow and where price may go to next. The concept follows ICT principles.
ICT Market Structure
ICT breaks down Pivot points into three categories:
Short Term High/Low (STH/STL) is a 3 candle pattern with a low with higher low on each side (STL), or a high with lower high on each side (STH)
Intermediate Term High/Low (ITH/ITL) uses the calculated STH/STL and marks any STH that has lower or STH on each side, and STL that has higher STL on each side
Long Term High/Low (LTH/LTL) uses the calculated ITH/ITL and marks any ITH that has lower or ITH on each side, and ITL that has higher ITL on each side
Note: ICT also states that if a STH wicks into and closes (almost?) a FVG, he marks it as ITH even if it does not have STH on reach side. This scenario is not covered by this indicator
Liquidity
liquidity is usually present under pivot points. The more prominent the pivot point, the more likely higher values liquidity pools reside under/above it. Liquidity under ITL and LTL as an example, will have better indication of which liquidity the price may seek next.
Displacement
Displacement registers above average move in the price resulting in strong visible move. If requiring a FVG is enabled (in settings), then the displacement could possibly (but never guaranteed) be used to visually recognize a move as it develops.
Full Credit: The calculation for Displacement is derived from TFO's Visualizing Displacement
Imbalances
Imbalances can come in different forms. This indicator identifies three type of imbalances:
1. FVG
2. Volume Imbalance
3. Open Gaps
Imbalances completes the picture by help visualize strong moves, where possible pivot points may develop, and how to enter or manage a trade.

Fair Value Gap█ OVERVIEW
This indicator displays the Fair Value Gap of the current timeframe and an additional higher timeframe. For each FVG the gaps act as targets creating bullish and bearish gaps that are often filled.
█ FEATURES
MTF Options
MidPoint FIll
Delete Old On Fill
Label FVG Timeframe
MTF Options
Enabling the MTF Options will allow the user to use the "MTF Timeframe" setting to choose what HTF Fair Value Gap to display
MidPoint FIll
A line plot at the Half way point will be included in the Fair Value Gap, this will be used to delete the gap when reached instead of a full fill.
Delete Old On Fill
Deletes historical Fair Value Gaps when filled.
Label FVG Timeframe
Labels Every Fair Value gap with there relevant timeframe to make it easier to determine which gap is being filled.
█ HOW TO USE IT
The indicator is quite straight forward in its application, providing users with targets that are often filled as they are seen as market imbalance.
Just applying it to your chart will provide the existing Fair Value Gaps. MTF Confluence is helpful in seeing what is happening on the macro perspective.
█ SUGGESTION
My suggestion for clarity is to use a different color to some degree between the MTF and Current TF as Opposed to text, keeps the chart clear.
█ LIMITATIONS OF PINE (Please read)
I see many users going on different indicators with MTF in mind and trying to use it for LTF data e.g. 1hour chart, and selecting 5min in chart settings.
This is not recommended by the team themselves and should be noted for use always use HTF: www.tradingview.com
To understand how to use fair value gaps I recommend learning about the subject some more, searching online will provide you resources. The internet is your friend when learning. All the best.

First FVG per Session - Big boss traders First FVG per Session like Asia first Persented FVG London and Ny

Clean SMC: Filtered OB + FVGHow does this indicator work?
Fair Value Gaps (FVG): It identifies price imbalances (gaps between the wick of candle 1 and candle 3). They appear as small, light-colored rectangles.
Order Blocks (OB): It marks "Smart Money" candles that precede a strong impulse. These areas are extended to the right because they often act as future support or resistance.
Signals (BUY/SELL): The indicator displays a signal when it detects a confluence (for example, a bullish OB appearing right after an FVG).
Some friendly trading tips:
Timeframe: This indicator works best on higher timeframes (15m, 1h, 4h) to avoid market "noise."
Confirmation: Don't take a "BUY" signal on its own. Check if the overall trend (on a higher timeframe) is also bullish.
Risk management: Always place your Stop Loss just below the identified Order Block.

SMC Pro : OB Longues + FVGHow does this indicator work?
Fair Value Gaps (FVG): It identifies price imbalances (gaps between the wick of candle 1 and candle 3). They appear as small, light-colored rectangles.
Order Blocks (OB): It marks "Smart Money" candles that precede a strong impulse. These areas are extended to the right because they often act as future support or resistance.
Signals (BUY/SELL): The indicator displays a signal when it detects a confluence (for example, a bullish OB appearing right after an FVG).
Some friendly trading tips:
Timeframe: This indicator works best on higher timeframes (15m, 1h, 4h) to avoid market "noise."
Confirmation: Don't take a "BUY" signal on its own. Check if the overall trend (on a higher timeframe) is also bullish.
Risk management: Always place your Stop Loss just below the identified Order Block.

Clean SMC: Filtered OB + FVGHow does this indicator work?
Fair Value Gaps (FVG): It identifies price imbalances (gaps between the wick of candle 1 and candle 3). They appear as small, light-colored rectangles.
Order Blocks (OB): It marks "Smart Money" candles that precede a strong impulse. These areas are extended to the right because they often act as future support or resistance.
Signals (BUY/SELL): The indicator displays a signal when it detects a confluence (for example, a bullish OB appearing right after an FVG).
Some friendly trading tips:
Timeframe: This indicator works best on higher timeframes (15m, 1h, 4h) to avoid market "noise."
Confirmation: Don't take a "BUY" signal on its own. Check if the overall trend (on a higher timeframe) is also bullish.
Risk management: Always place your Stop Loss just below the identified Order Block.

Clean SMC: Filtered OB + FVG Fair Value Gaps (FVG): This identifies price imbalances (gaps between the wick of candle 1 and candle 3). They appear as small, light-colored rectangles.
* Order Blocks (OB): This marks "Smart Money" candles that precede a strong impulse. These areas are extended to the right because they often act as future support or resistance.
* Signals (BUY/SELL): The indicator displays a signal when it detects a confluence (for example, a bullish OB appearing right after an FVG).
Some friendly trading tips:
* Timeframe: This indicator works best on higher timeframes (15m, 1h, 4h) to avoid market "noise."
* Confirmation: Don't take a "BUY" signal alone. Check if the overall trend (on a higher timeframe) is also bullish.
* Risk management: Always place your Stop Loss just below the identified Order Block.
Would you like me to add a specific feature, such as a notification on your phone or a trend filter (moving average) to refine the signals?

ICT Clean CISD & Mitigated MTF FVGs Clean CISD & MTF FVGs
Minimalist Institutional Order Flow Tool
Key Features:
CISD (Change in State of Delivery): Marks the first sign of an order flow shift. Displayed as a clean black line + label (no bulky boxes).
High-Probability FVGs: Scans 15m, 1h, and 4h timeframes for gaps.
Displacement Filter: Only shows "Crucial" gaps. Tiny, insignificant imbalances are automatically filtered out using an ATR threshold.
Auto-Cleaning Logic: Boxes are automatically deleted once price fills or closes through them, keeping your chart 100% clean.

SMC-Clean v5 [BOS + OB + FVG]SMC-Clean v5 is a clean and lightweight Smart Money Concepts indicator designed to visualize market structure, Order Blocks, and Fair Value Gaps in a clear and non-repainting way.
The indicator automatically identifies Break of Structure (BOS) and Change of Character (CHoCH) using pivot-based structure logic, helping traders understand trend continuation and potential reversals. Bullish and bearish structures are clearly marked on the chart for quick visual interpretation.
It also detects Bullish and Bearish Order Blocks based on strong displacement candles filtered by ATR. Order Blocks are drawn as zones and are automatically removed once mitigated, keeping the chart clean and relevant.
Additionally, the script highlights Fair Value Gaps (FVG) using a three-candle imbalance model, filtered by minimum ATR size. These gaps can be used for pullback entries, mean reversion, and confluence with structure and Order Blocks.
SMC-Clean v5 is designed to be minimal, fast, and practical. It works on all markets and timeframes and is best used as a market structure and context tool, not as a standalone signal system. The script can be further customized and expanded into advanced SMC models.
