RTH Levels: VWAP + PDH/PDL + ONH/ONL + IBAlgo Index — Levels Pro (ONH/ONL • PDH/PDL • VWAP±Bands • IB • Gaps)
Purpose. A session-aware, non-repainting levels tool for intraday decision-making. Designed for futures and indices, with clean visuals, alerts, and a one-click Minimal Mode for screenshot-ready charts.
What it plots
• PDH/PDL (RTH-only) – Prior Regular Trading Hours high/low, computed intraday and frozen at the RTH close (no 24h mix-ups, no repainting).
• ONH/ONL – Prior Overnight high/low, held throughout RTH.
• RTH VWAP with ±σ bands – Volume-weighted variance, reset each RTH.
• Initial Balance (IB) – First N minutes of RTH, plus 1.5× / 2.0× extensions after IB completes.
• Today’s RTH Open & Prior RTH Close – With gap detection and “gap filled” alert.
• Killzone shading – NY Open (09:30–10:30 ET) and Lunch (11:15–13:30 ET).
• Values panel (top-right) – Each level with live distance in points & ticks.
• Right-edge level tags – With anti-overlap (stagger + vertical jitter).
• Price-scale tags – Native trackprice markers that always “stick” to the axis.
⸻
New in v6.4
• Minimal Mode: one click for a clean look (thinner lines, VWAP bands/IB extensions hidden, on-chart right-edge labels off; price-scale tags remain).
• Theme presets: Dark Hi-Contrast / Light Minimal / Futures Classic / Muted Dark.
• Anti-overlap controls: horizontal staggering, vertical jitter, and baseline offset to keep tags readable even when levels cluster.
⸻
Quick start (2 minutes)
1. Add to chart → keep defaults.
2. Sessions (ET):
• RTH Session default: 09:30–16:00 (US equities cash hours).
• Overnight Session default: 18:00–09:29.
Adjust for your market if you use different “day” hours (e.g., many use 08:20–13:30 ET for COMEX Gold).
3. Theme & Minimal Mode: pick a Theme Preset; enable Minimal Mode for screenshots.
4. Visibility: toggle PD/ON/VWAP/IB/References/Panel to taste.
5. Right-edge labels: turn Show Right-Edge Labels on. If they crowd, tune:
• Anti-overlap: min separation (ticks)
• Horizontal offset per tag (bars)
• Vertical jitter per step (ticks)
• Right-edge baseline offset (bars)
6. Alerts: open Add alert → Condition: and pick the events you want.
⸻
How levels are computed (no repainting)
• PDH/PDL: Intraday H/L are accumulated only while in RTH and saved at RTH close for “yesterday’s” values.
• ONH/ONL: Accumulated across the defined Overnight window and then held during RTH.
• RTH VWAP & ±σ: Volume-weighted mean and standard deviation, reset at the RTH open.
• IB: First N minutes of RTH (default 60). Extensions (1.5×/2.0×) appear after IB completes.
• Gaps: Today’s RTH open vs prior RTH close; “Gap Filled” triggers when price trades back to prior close.
⸻
Practical playbooks (how to trade around the levels)
1) PDH/PDL interactions
• Rejection: Price taps PDH/PDL then closes back inside → mean-reversion toward VWAP/IB.
• Acceptance: Close/hold beyond PDH/PDL with momentum → continuation to next HTF/IB target.
• Alert: PD Touch/Break.
2) ONH/ONL “taken”
• Often one ON extreme is taken during RTH. ONH Taken / ONL Taken → check if it’s a clean break or sweep & reclaim.
• Sweep + reclaim near VWAP can fuel rotations through the ON range.
3) VWAP ±σ framework
• Balanced: First tag of ±1σ often reverts toward VWAP.
• Trend: Persistent trade beyond ±1σ + IB break → target ±2σ/±3σ.
• Alerts: VWAP Cross and VWAP Reject (cross then immediate fail back).
4) IB breaks
• After IB completes, a clean IB break commonly targets 1.5× and sometimes 2.0×.
• Quick return inside IB = possible fade back to the opposite IB edge/VWAP.
• Alerts: IB Break Up / Down.
5) Gaps
• Gap-and-go: Opening drive away from prior close + VWAP support → trend until IB completion.
• Gap-fill: Weak open and VWAP overhead/underfoot → trade toward prior close; manage on Gap Filled alert.
Pro tip: Stack confluences (e.g., ONL sweep + VWAP reclaim + IB hold) and respect your execution rules (e.g., require a 5-minute close in direction, or your order-flow confirmation).
⸻
Inputs you’ll actually touch
• Sessions (ET): Session Timezone, RTH Session, Overnight Session.
• Visibility: toggles for PD/ON/VWAP/IB/Ref/Panel.
• VWAP bands: set σ multipliers (±1/±2/±3).
• IB: duration (minutes) and extension multipliers (1.5× / 2.0×).
• Style & Theme: Theme Preset, Main Line Width, Trackprice, Minimal Mode, and anti-overlap controls.
⸻
Alerts included
• PD Touch/Break — High ≥ PDH or Low ≤ PDL
• ONH Taken / ONL Taken — First in-RTH take of ONH/ONL
• VWAP Cross — Close crosses VWAP
• VWAP Reject — Cross then immediate fail back
• IB Break Up / Down — Break of IB High/Low after IB completes
• Gap Filled — Price trades back to prior RTH close
Setup: Add alert → Condition: Algo Index — Levels Pro → choose event → message → Notify on app/email.
⸻
Panel guide
The top-right panel shows each level plus live distance from last price:
LevelValue (Δpoints | Δticks)
Coloring: green if level is below current price, red if above.
⸻
Styling & screenshot tips
• Use Theme Preset that matches your chart.
• For dark charts, “Dark Hi-Contrast” with Main Line Width = 3 works well.
• Enable Trackprice for crisp axis tags that always stick to the right edge.
• Turn on Minimal Mode for cleaner screenshots (no VWAP bands or IB extensions, on-chart tags off; price-scale tags remain).
• If tags crowd, increase min separation (ticks) to 30–60 and horizontal offset to 3–5; add vertical jitter (4–12 ticks) and/or push tags farther right with baseline offset (bars).
⸻
Behavior & limitations
• Levels are computed incrementally; tables refresh on the last bar for efficiency.
• Right-edge labels are placed at bar_index + offset and do not track extra right-margin scrolling (TradingView limitation). The price-scale tags (from trackprice) do track the axis.
• “RTH” is what you define in inputs. If your market uses different day hours, change the session strings so PDH/PDL reflect your definition of “yesterday’s session.”
⸻
FAQ
Q: My PDH/PDL don’t match the daily chart.
A: By design this uses RTH-only highs/lows, not 24h daily bars. Adjust sessions if you want a different definition.
Q: Right-edge tags overlap or don’t sit at the far right.
A: Increase min separation / horizontal offset / vertical jitter and/or push tags farther with baseline offset. If you want markers that always hug the axis, rely on Trackprice.
Q: Can I change killzones?
A: Yes—edit the session strings in settings or request a version with user inputs for custom windows.
⸻
Disclaimer
Educational use only. This is not financial advice. Always apply your own risk management and confirmation rules.
⸻
Enjoy it? Please ⭐ the script and share screenshots using Minimal Mode + a Theme Preset that fits your style.
Cari dalam skrip untuk "gaps"

Breaker Blocks & Unicorns (with Deviations) by RiseBreaker Block and Unicorns (with Deviations) - The Highest Probability ICT Pattern
This advanced indicator identifies and tracks ICT Breaker Blocks, while incorporating powerful supplementary features including Unicorn patterns and customizable deviation levels.
These patterns develop through a precise market structure sequence culminating in structural breaks. Following Breaker Block confirmation, users can optionally enable highly customizable deviation levels. Additionally, the indicator can scan active Breaker Blocks for overlapping Fair Value Gaps (FVGs) and Inverted Fair Value Gaps (IFVGs)-(also known as "Unicorns") that represent high-probability trading opportunities, highly regarded in the ICT community.
This comprehensive tool provides unmatched functionality for traders and analysts seeking to track, backtest, and execute Breaker Block strategies. With its extensive feature set and granular customization options, it delivers capabilities that surpass existing alternatives in the market.
What is an ICT Breaker Block?
To explain this, we must understand the ABC sequence that form this pattern. It consists of:
Initial range (from A -> B)
First break point, commonly called "Manipulation" (C)
Second break, which is when the pattern is formed.
Each of these "points" consist of pivot levels, with an adjustable strength.
Breaker Blocks are invalidated and made inactive if price breaks the "C point", or manipulation.
Unicorns
Unicorns are Fair Value Gaps or Inverted Fair Value Gaps that overlap a Breaker Block. Breakers have their associated Unicorn, which is updated until price retraces into said gap.
Standard Deviations
This indicator has options to display deviations based on Breaker Blocks:
Breaker Deviations -> using the initial range (A -> B).
Manipulation Deviations -> using the manipulation (B -> C).
Input Settings:
This tool offers a lot of customizable options, which could be overwhelming to some users. Below you will find an in-depth definition of every input's purpose, to complement the tooltips that can be found directly in the indicator's settings.
Mode ⚙️
Default -> Displays every Breaker Block pattern found.
Bullish -> Displays every Bullish Breaker Block found.
Bearish -> Displays every Bearish Breaker Block found.
Reversals -> Displays alternate Breaker Blocks (Bearish -> Bullish -> Bearish and so on).
This is paired with a Historical input, to select the amount of previous Breakers to display.
Extend 📏
Last -> This option will extend the most recent Breaker's drawings.
Specified -> Extend Breakers a preset amount of bars.
All -> Extend all active Breakers to the current bar.
None -> Never extend Breaker Blocks.
Each object has it's specific " offset " parameter, which defines the amount of bars to extend drawings past the current bar.
Parameters
This section defines the main parameters used to define the Breaker Block pattern.
Time Filter -> Optional session to filter Breakers based on time of day.
Pivot Strength -> Determines how many consecutive bars to the left of a pivot must be lower (for highs) or higher (for lows) to confirm it as a point.
Range Lookback -> Amount of ranges that the indicator will keep track for each direction.
Breaker Type -> Defines how a Breaker Block is displayed:
Range -> Entire initial range.
Consecutive -> Last consecutive onside candles (upclose for bullish, downclose for bearish).
Last -> Last onside candle.
Breaker Offset -> Amount of bars to extend Breaker Blocks past the current bar.
Use Candle Bodies? -> Use bar open to close rather than high to low.
Require Candle Close? -> Use bar close to form Breaker Blocks.
Remove After Invalidation? -> Remove drawings for invalidated Breakers.
Style
Breaker Block boxes styling based on directions.
Optional Middle Line and styling.
Optional Signals for Breaker Block formation:
Triangle label with adjustable sizing on the formation bar.
Line with custom styling at breakout point to the formation bar.
Unicorn Fair Value Gaps
Checkbox to display Unicorns with adjustable "FVGs", "IFVGs", or "Both" types.
Overlap Threshold -> Distance away from Breaker to still consider an "overlap".
Unicorn Offset -> Amount of bars to extend unicorn gaps past the current bar.
Lines styling.
Optional Middle Line and styling.
Include Volume Imbalances? -> Include adjacent VIs as part of Fair Value Gaps.
Extend until Reached? -> Extend Unicorn drawings until price reaches them.
Deviations
Checkbox to display Standard Deviations with adjustable types and levels.
Lines styling.
Text size and positioning.
Extend until Reached? -> Extend deviation lines until price reaches them.
Text
Label contents:
Default -> "+/- Breaker".
Abbreviation -> "+/- BB".
None -> No text.
Size .
Font (Default or Monospace) and Format (None, Italic or Bold).
Align -> vertical and horizontal positioning.
This indicator is for educational and informational purposes only. Past performance and historical patterns do not guarantee future results. Trading involves substantial risk of loss and is not suitable for all investors. Always conduct your own analysis and consider your financial situation before making any trading decisions. The identification of patterns does not constitute trading advice.
For any additional questions and/or feedback related to this indicator, users can comment below!

FVG Breakout Lite by tradingbauhausExplanation of "FVG Breakout Lite by tradingbauhaus"
This script is a trading strategy built for TradingView that helps you spot and trade "Fair Value Gaps" (FVGs)—price areas where the market moved quickly, leaving a gap that might act as support or resistance later. It’s designed to catch breakout opportunities when the price moves strongly in one direction, with extra filters to make trades more reliable. Here’s how it works and how you can use it:
What It Does
1. Finds Fair Value Gaps (FVGs):
A "Bullish FVG" happens when the price jumps up quickly, leaving a gap below where it didn’t trade much (e.g., today’s low is higher than the high from two bars ago).
A "Bearish FVG" is the opposite: the price drops fast, leaving a gap above (e.g., today’s high is lower than the low from two bars ago).
The script draws colored boxes on your chart to show these gaps: green for bullish, red for bearish.
2. Spots Breakouts:
It looks for "strong" FVGs by comparing them to a trend (based on the highest highs and lowest lows over a set period).
If a bullish gap forms above the recent highs, or a bearish gap below the recent lows, it’s marked as a breakout opportunity.
3. Adds a Volume Check:
Trades only happen if the market’s volume is higher than usual (e.g., 1.2x the average volume over the last 20 bars). This helps ensure the breakout has real momentum behind it.
4. Trades Automatically:
Long Trades (Buy): If a bullish breakout FVG forms and volume is high, it buys at the current price.
Short Trades (Sell): If a bearish breakout FVG forms with high volume, it sells short.
Each trade comes with a stop loss (to limit losses) and a take profit (to lock in gains), both adjustable by you.
5. Shows Mitigation Lines (Optional):
If you turn on "Display Mitigation Zones," it draws lines at the edge of each breakout FVG. These lines show where the price might return to "fill" the gap later, helping you see key levels.
6. Includes Webull Costs:
The script factors in real trading fees from Webull, like tiny SEC and FINRA fees for selling, and a daily margin cost if you’re borrowing money to trade. These don’t show up on the chart but affect the strategy’s performance in backtesting.
How to Use It
1. Add to Your Chart:
Copy the script into TradingView’s Pine Editor, click "Add to Chart," and it’ll start drawing FVGs and running the strategy.
2. Customize Settings:
Trend Period (Default: 25): How many bars it looks back to define the trend. Longer periods mean fewer but stronger signals.
Volume Lookback (Default: 20) & Volume Threshold (Default: 1.2): Adjust how it measures "high volume." Increase the threshold for stricter trades.
Stop Loss % (Default: 1.5%) & Take Profit % (Default: 3%): Set how much you’re willing to lose or aim to gain per trade.
Margin Rate % (Default: 8.74%): Webull’s rate for borrowing money—lower it if your account qualifies for a better rate.
Display Mitigation Zones (Default: On): Toggle this to see or hide the gap lines.
Colors: Change the green (bullish) and red (bearish) shades to suit your chart.
3. Backtest It:
Go to the "Strategy Tester" tab in TradingView to see how it performs on past data. It’ll show trades, profits, losses, and Webull fees included.
4. Watch It Work:
Green boxes mean bullish FVGs; red boxes mean bearish FVGs. If volume spikes and the price breaks out, you’ll see trades happen automatically.
What to Expect
Visuals: You’ll see colored boxes for FVGs and optional lines showing where they start. These help you spot key price zones even if you’re not trading.
Trades: It’s selective—only trades when FVGs align with a breakout and volume confirms it. Expect fewer trades but with higher potential.
Risk: The stop loss keeps losses in check, while the take profit aims for a 2:1 reward-to-risk ratio by default (3% gain vs. 1.5% loss).
Costs: Webull’s fees are small but baked into the results, so you’re seeing a realistic picture of profits.
Tips for Users
Test it on a small timeframe (like 5-minute charts) for day trading or a larger one (like daily) for swing trading.
Play with the volume threshold—if you get too few trades, lower it (e.g., 1.1); if too many, raise it (e.g., 1.5).
Watch how price reacts to the mitigation lines—they’re often support or resistance zones traders target.
This strategy is lightweight, focused, and built for traders who like breakouts with a bit of confirmation. It’s not foolproof (no strategy is!), but it gives you a clear way to trade FVGs with some smart filters.

Gap Symbolized on ChartIndicator Description: Gap Analysis with Text Symbols
This indicator analyzes the relationship between the current candle's open price, the previous candle's close price, and the current candle's close price to provide visual insights into price gaps and momentum. It displays text symbols (▼, ▲, ━) above each candle, color-coded to reflect the strength and direction of the gap.
Key Features:
Gap Analysis:
Compares the current candle's open price with the previous candle's close price.
Evaluates the current candle's close price relative to its open price.
Text Symbols:
▼ (Down Arrow): Indicates a bearish movement.
▲ (Up Arrow): Indicates a bullish movement.
━ (Dash): Indicates a neutral or sideways movement.
Color Coding:
Red: Bearish conditions (e.g., price opening lower than the previous close and closing lower than the open).
Orange: Mild bearish or bullish conditions.
Blue: Bullish conditions (e.g., price opening higher than the previous close and closing higher than the open).
Navy: Strong bullish conditions.
Transparent Background:
The text symbols are displayed without any background shape, ensuring they do not obstruct the chart.
Use Cases:
Identify Gaps: Quickly spot gaps between the previous close and the current open.
Momentum Analysis: Assess the strength and direction of price movements.
Visual Clarity: The minimalist design (text symbols only) keeps the chart clean and easy to interpret.
How to Use:
Add the indicator to your chart.
Observe the text symbols above each candle:
Red ▼: Strong bearish momentum.
Blue ▲: Strong bullish momentum.
━: Neutral or consolidation phase.
Use the insights to confirm trends, spot reversals, or identify potential entry/exit points.
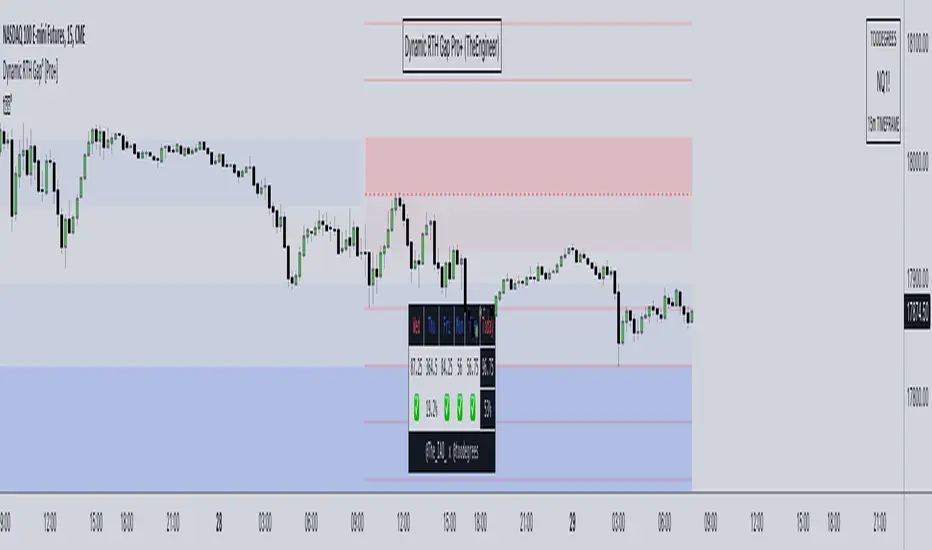
Dynamic RTH Gap [Pro+] (TheEngineer)Description:
Elevate your trading expertise with the Dynamic RTH Gap , specifically designed for day traders and intraday analysts. Built to serve functionality, it enables traders to dissect and leverage Regular Trading Hour gaps with unparalleled precision and customization. This tool is built based on the methods and experience of TheEngineer who has refined these concepts over Time, creating a stronger framework for intraday analysis.
The difference between the price at market close and the open price at market open defines the RTH gap. These Times vary across different markets and countries, for example for US markets, the gap is defined between 16:15 and 9:30 of the following day.
In futures contracts, traders can use Electronic Trading Hours (ETH), or Regular Trading Hours (RTH). ETH includes the overnight session and pre-market, where majority of market participants are inactive.
When the new day RTH Opens, the Inner Circle Trader teaches how influential the gap created from the previous day's close and the next day's open is to futures contract analysis. Using RTH gap midpoints and projections can aid day traders in interpreting price action with higher context, contributing to higher probability ideas.
Key Features:
Selective Day Analysis: Optimize your trading strategy and templates by focusing on specific days of the week. This tool provides checkboxes for Monday through Friday, allowing for granular analysis on the days that matter most to your trading regimen.
Tuesday Gap extended throughout the week serves as a compass and, in this case, supports price:
RTH Gap Visualization: Engage with the markets through a dynamic visual display of RTH gaps. Benefit from our 'Show RTH Gap' option with an 'Auto Color' feature that automatically adjusts to reflect the bullish or bearish significance of the gap, enhancing your chart analysis with an intuitive color scheme.
Historical CE: This feature is a dedicated component of the Dynamic RTH Gap that integrates the concept of Consequent Encroachment (CE) from the ICT Inner Circle Trader methodology. CE is noted as the 50% of the RTH Gap. Historical CEs may act as key market pivots and or display imbalances away from such level.
Gap Grades Flexibility: Choose from various styles such as 'Dashed', 'Solid', or 'Dotted' to categorize gap grades. An additional option to 'Show Quarters' divides the Regular Trading Hours Gap into quarters for more detailed analysis.
Proactive Gap Projections: Activate 'Show Projections' to display standard deviations of the Regular Trading Hours Gap with an 'Auto' or manual setting. This is complimented with a a visual selection for projection style, providing clearer lines per Tradingview layouts.
Projection Gap Threshold: The 'Proj. Gap Threshold' slider is an innovative feature within the Dynamic RTH Gap , designed to empower traders’ control for gap projections. This feature allows one to display larger or smaller gaps to their back tested values.
Smaller RTH Gaps are less insightful, notice this small gap's projections being hit in the first few candles after the gap is established:
Data Table Integration: With the 'Show Data Table' toggle, access a neatly organized table that compiles and presents relevant gap data. Enhance your data analysis with 'Color Coding', distinguishing data points for quick identification and comparison. Lastly, monitor the % fill of the RTH gaps, up to five gaps in the past.
Automated Gap and Deviation Alerts: This tool is equipped with real-time alerts for immediate notification when gaps fill or when specific deviation levels are reached. Tailor your alerts to your strategy, and stay informed with minimizing chart time. With this feature, traders can maintain a competitive edge on multiple instruments by setting alerts, providing additional trading opportunities.
These tools are available ONLY on the TradingView platform.
Terms and Conditions
Our charting tools are products provided for informational and educational purposes only and do not constitute financial, investment, or trading advice. Our charting tools are not designed to predict market movements or provide specific recommendations. Users should be aware that past performance is not indicative of future results and should not be relied upon for making financial decisions. By using our charting tools, the purchaser agrees that the seller and the creator are not responsible for any decisions made based on the information provided by these charting tools. The purchaser assumes full responsibility and liability for any actions taken and the consequences thereof, including any loss of money or investments that may occur as a result of using these products. Hence, by purchasing these charting tools, the customer accepts and acknowledges that the seller and the creator are not liable nor responsible for any unwanted outcome that arises from the development, the sale, or the use of these products. Finally, the purchaser indemnifies the seller from any and all liability. If the purchaser was invited through the Friends and Family Program, they acknowledge that the provided discount code only applies to the first initial purchase of the Toodegrees Premium Suite subscription. The purchaser is therefore responsible for cancelling – or requesting to cancel – their subscription in the event that they do not wish to continue using the product at full retail price. If the purchaser no longer wishes to use the products, they must unsubscribe from the membership service, if applicable. We hold no reimbursement, refund, or chargeback policy. Once these Terms and Conditions are accepted by the Customer, before purchase, no reimbursements, refunds or chargebacks will be provided under any circumstances.
By continuing to use these charting tools, the user acknowledges and agrees to the Terms and Conditions outlined in this legal disclaimer.
Skrip berbayar
BigBeluga - Smart Money ConceptsSmart Money Concepts (SMC) is a comprehensive toolkit built around the around the principles of "smart money" behavior, which refers to the actions and strategies of institutional investors.
SMC transcends traditional technical analysis by delving deeper into this framework. This approach allows users to decipher the actions of these influential players, anticipate their potential impact on market dynamics, and gain insights beyond just price movements.
This all-in-one toolkit provide the user with a unique experience by automating most of the basic and advanced concepts on the chart, saving them time and improving their trading ideas.
🔹Real-time market structure analysis simplifies complex trends by pinpointing key support, resistance, and breakout levels.
🔹Advanced order block analysis leverages detailed volume data to pinpoint high-demand zones, revealing internal market sentiment and predicting potential reversals. This analysis utilizes bid/ask zones to provide supply/demand insights, empowering informed trading decisions.
🔹Imbalance Concepts (FVG and Breakers) allows traders to identify potential market weaknesses and areas where price might be attracted to fill the gap, creating opportunities for entry and exit
🔹Swing failure patterns help traders identify potential entry points and rejection zones based on price swings
🔹Liquidity Concepts, our advanced liquidity algorithm, pinpoints high-impact events, allowing you to predict market shifts, strong price reactions, and potential stop-loss hunting zones. This gives traders an edger to make informed trading decisions based on multi-timeframe liquidity dynamics
🔶 FEATURES
The indicator has quite a lot of features that are provided below:
Swing market structure
Internal market structure
Mapping structure
Discount/Premium zone
Adjustable market structure
Strong/Weak H&L
Sweep
Volumetric Order block / Breakers
Fair Value Gaps / Breakers (multi-timeframe)
Swing Failure Patterns (multi-timeframe)
Deviation area
Equal H&L
Liquidity Prints
Buyside & Sellside
Sweep Area
Highs and Lows (multi-timeframe)
🔶 BASIC DEMONSTRATION
The preceding image illustrates the market structure functionality within the Smart Money Concepts indicator.
Solid lines: These represent the core indicator's internal structure, forming the foundation for most other components. They visually depict the overall market direction and identify major reversal points marked by significant price movements (denoted as 'x').
Dotted lines: These represent an alternative internal structure with the potential to drive more rapid market shifts. This is particularly relevant when a significant gap exists in the established swing structure, specifically between the Break of Structure (BOS) and the most recent Change of High/Low (CHoCH). Identifying these formations can offer opportunities for quicker entries and potential short-term reversals.
Sweeps (x): These signify potential turning points in the market where liquidity is removed from the structure. This suggests a possible trend reversal and presents crucial entry opportunities. Sweeps are identified within both swing and internal structures, providing valuable insights for informed trading decisions.
🔶 USAGE & EXAMPLES
The image above showcases a detailed example of several features from our toolkit that can be used in conjunction for a comprehensive analysis.
Price rejecting from the bullish order block (POC), while printing inside a bullish SFP and internal structure turning bullish (Internal CHoCH).
The image further demonstrates how two bearish order blocks could potentially act as resistance zones when prices approach those levels. These areas might also offer attractive locations to place take-profit orders.
The price has reached our first take-profit level, but is exhibiting some signs of weakness, suggesting a potential pullback which could put the trade at higher risk.
On the other hand, the price action currently exhibits strong bullish sentiment, suggesting favorable entry points and a potential upward trend.
The price has now fully reached our take-profit zone and is also exhibiting bearish confluence, indicating a potential price reversal or trend shift.
🔶 USING CONFLUENCE
The core principle behind the success of this toolkit lies in identifying "confluence." This refers to the convergence of multiple trading indicators all signaling the same information at a specific point or area. By seeking such alignment, traders can significantly enhance the likelihood of successful trades.
In the image above we can see a few examples of the indicator used in confluence with other metrics included in the toolkit.
Liquidity Prints within order blocks
SFP close to the POC
Sweep in liquidity close to a fair value gaps
These are just a few examples of what applying confluence can look like.
🔶 SETTINGS
Window: limit calculation period
Swing: limit drawing function
Internal: a period of the beginning of the internal structure
Mapping structure: show structural points
Algorithmic Logic: (Extreme-Adjusted) Use max high/low or pivot point calculation
Algorithmic loopback: pivot point look back
Premium / Discount: Lookback period of the pivot point calculation
Show Last: Amount of Order block to display
Hide Overlap: hide overlapping order blocks
Construction: Size of the order blocks
Fair value gaps: Choose between normal FVG or Breaker FVG
Mitigation: (close - wick- avg) point to mitigate the order block/imbalance
SFP lookback: find a higher / lower point to improve accuracy
Threshold: remove less relevant SFP
Equal h&L: (short-mid-long term) display longer term
Any Alert(): Trigger alerts based on the selected inputs
Skrip berbayar

Market Dynamics Pro [ChartPrime]ChartPrime Market Dynamics Pro is designed to cater to those traders who are more interested in market structures, price action and fundermentals. Analysing volume, key levels in the market, market phases and multi-timeframe can help a trader build a clearer and more actionable view of the market. ChartPrime performs analysis on data in a unique way therefore attempting to give insights into the market otherwise unseen.
Major Features:
Order blocks: The ChartPrime order blocks provide sleek and clear levels in the market where the price might find support and resistance. It is important to note this data isn't availible currently therefore these are derived from data outside of order books. Order blocks are segmented into 4 sections reflecting the volume at a given levels. Low, Medium, High and very high based on relevant and dynamic averages. This allows a trader to identify how significant a level is in the market in a simpler method. Bearish order blocks have a red color bias and bullish order blocks have a green color bias allowing a trader to identify what type of order block it is. The order blocks also dynamically show the remaining volume at that given level.
Pattern Detection: ChartPrime leverages unique pattern identification methods providing earlier and cleaner chart formations. Patterns are commonly used in trading to assess whether bulls or bears are performing optimally in a market or losing strength. ChartPrime identifies; Ascending wedges, descending wedges, symmetrical Triangles, H&S, iH&S, broadening wedges and double tops/bottoms. Patterns often have associated theory behind them for entries and targets that we suggest a trader covers before using this feature. ChartPrime also allow for the user to adjust where a pattern is drawn from. In pattern theory there are 2 main approaches to drawing a formation; from candle body and candle wick. ChartPrime allows for this to be adjusted by a user and also allow for alerts to be set on these patterns.
MTF SR: Taking into account multi timeframes when trading is a key idea. Having ideas of the larger market moves can provide deeper context when trading. ChartPrime Market Dynamics Pro allows for 3 varying SR plots from 3 varying user desired timeframes. These are graded via pivot analysis and grid analysis. This rank is on a 1-10 scale with 1 being the highest rank and 10 is the lowest.
Market Stucutures : These labels are commonly found and used by the Smart Money community. They denote a break of stucture and a chance of character. BOS are labelled when the price breaks a lower low or higher high (in the trending markets) and a CoC occurs when price breaks a trending market pivot. These break a market into clearer breakouts of price action and can help a trader deduce relevant moves. The indicator allows for the user to adjust the detection length of these structures.
Premium and Discount Zones: Premium and Discount zones are underpinned by a simple piece of logic. A premium zone is taken from a higher swing point and the discount from a lower swing point. Although a very generic approach this can show areas in the market that could see a reaction. An asset being in a discount zone implies the price is undervalued. An asset being in a premium zone implies the asset is overpriced or overextended. These are excellent when used in confluence with other SR methods. These naturally will have a delay as they are derived from swing points in a market but still are extremely relevant levels.
Fair Value Gaps: These are gaps in the market where price has seen a highly volatile move and they are assumed to act as magnets in the market. The price may come back and visit these 'gaps' after the move has occured. These are a common technique now used by traders and added to this toolkit for convinience.
Settings:
Order Blocks: Select the scale of the order blocks displayed
BoS/CoC: Toggle these on/off and adjust the lookback on these market structures
Premium/Discount Zones: Toggle on/off and adjust lookback
Enable FVG: Toggle on/off FVGs
Swing Levels: Enable basic swing levels in market
MTF Support/Resistance: Enable and select the relevant timeframe to obtain MTF SR levels on your chart. Up to 3 timeframes at a time.
Predictive Ranges: Toggle on/off
Trend Lines Detection: Toggle on/off trendlines
Wedge Detection: Adjust how patterns are detected; whether from wick or candle body
Toggles provided for relevant patterns.
Example usecases:
ChartPrime order blocks give a deeper insight into market support and resistance levels. Looking for order blocks labelled with High can indicate this level being a significant support or resistance in the market. Adding in further confluences here can assist further in deciding where the price may see a reaction. Take the screenshot below:
Adding in confluences from other timeframes can also help give a broader view. Using the multi time frame graded frame support and resistance levels we can use these to further assist us in finding significant levels in the market.
ChartPrime also provides breaker blocks. These are still significant levels in the market despite being "broken" prior. These too can be used in a classical manor and act as relevant areas in the market. These are particularly effective when used in confluence with Premium and discount zones. We can see in the example below price sees a strong reaction and bounces at these levels.
Market Dynamics Pro provides a comprehensive toolkit of unique features and mixes in the classical concepts allowing for a cleaner charting experience.
All content and indicators provided by ChartPrime are purely for informational & educational purposes only. Past performance does not guarantee future results.
Skrip berbayar

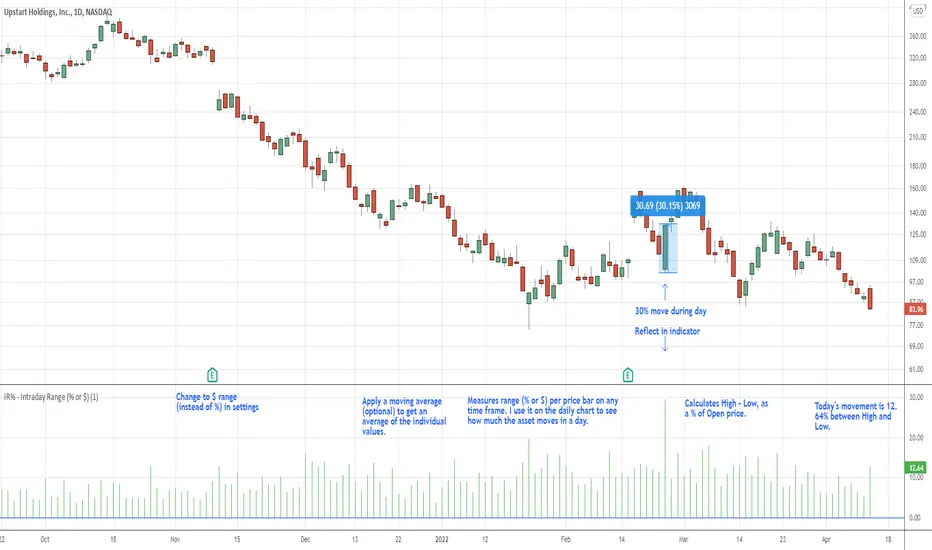
IR% - Intraday Range (% or $)Shows the percentage difference between the High and Low of the price bar expressed as a percent of the Open of that bar. In the settings, you can change to Price Change instead of percent change. This will show the price change between the High and Low for each price bar.
It can be used on any time frame.
I use it on the daily chart . I note the daily figure, and that lets me know how far the price tends to move during a typical day (no gaps included).
If using on another time frame other than the daily, then it is an intrabar calculation, not intraday.
Apply a moving average to it to see the average intraday movement after the open when using a daily chart .
The IR% of a 1-minute chart tells you the price range of that one-minute price bar, and a weekly chart will show the price range of each weekly price bar.
It only measures high to low versus the candle's open price. It does not include gaps between candles, which makes it different than the ATR. ATR is more useful for swing trading, where the trader may be holding through gaps in price, and thus wants to factor them in.
The IR% is useful for day traders because it shows how much a stock tends to move during the day (intraday range), when using a daily chart . ATR is not as effective for this because it includes gaps, which day traders can't generally capitalize on.
If the IR% is fluctuating between 5% and 10% over the last 50 days or so (on the daily chart ), day traders know that AFTER the open, the price is likely to move 5% to 10% from high point to low point. This can help with establishing profit targets, seeking out stocks that tend to move a lot within the day, or avoid these types of stocks if they are undesirable to you. Seek out low IR% stocks if you prefer lower movement during your selected time frame.
A stock may have an ATR% of 5% but ATR doesn't tell us if that movement occurred after the open or includes a gap. Some stocks are prone to gaps. They may gap 4% most days, and then only move 1% during the day. This will still be a 5% ATR%, but most of that movement ISN'T capturable each day. The IR% for this stock would only be 1%, not 5% like the ATR suggests.
I developed this because I like day trading volatile stocks, and I wanted a measure that ONLY includes movement during the day, and doesn't include price gaps in the calculation. Because as a day trader, gaps don't matter to me. I can only make money on what happens during the day, after the open.
It is similar to another indicator called Average Day Range (ADR). Although most ADR calculations are already calculated as an average (so I don't see each individual value) or plots things on the chart. This may be useful for some people, but I wanted to see the data on each price bar, have the option to add a moving average or not, and not have anything plotted on the price chart. It also nice to be able to flip from % to $ dollar movement if desired.
LVN Smart Liquidity📊 LVN SMART LIQUIDITY
═════════════════════════════════════════════════════════════
─────────────────────────────────────────────────────────────
🎯 OVERVIEW
LVN Smart Liquidity is an advanced Market Profile-based indicator that automatically identifies Low Volume Nodes (LVN) across multiple timeframes. Unlike traditional volume-based indicators, this tool uses TPO (Time Price Opportunity) calculations to detect price levels where minimal trading activity occurred, revealing potential breakout zones and rapid price movement areas.
These LVN zones often behave similarly to Fair Value Gaps (FVG) in Smart Money Concepts, representing "thin air" areas where price tends to move quickly with minimal resistance. The indicator provides dynamic zone management with an immunity period system to prevent premature zone closure.
─────────────────────────────────────────────────────────────
🔬 HOW IT WORKS
MARKET PROFILE TPO METHODOLOGY:
The indicator analyzes each higher timeframe period by:
1. Dividing the price range into 20 equal levels
2. Counting how many bars touched each level (TPO count)
3. Identifying levels with TPO counts below the threshold (default 30% of maximum)
4. Creating horizontal zones that extend until price touches them
MULTI-TIMEFRAME ANALYSIS:
• Supports up to 5 independent timeframes simultaneously
• Each timeframe generates its own LVN zones with unique colors
• Auto-timeframe mode adapts to your chart period
• Zones project from historical sessions onto current price action
SMART ZONE MANAGEMENT:
• Immunity Period: New zones are protected for N bars after creation (default 20)
• This prevents zones from disappearing immediately when price is already within them
• Zones extend right until price touches them, then stop extending
• Historical zones remain visible for reference (optional)
─────────────────────────────────────────────────────────────
💡 WHY LVN ZONES MATTER
Low Volume Nodes represent price levels where:
✓ Price spent minimal time (rejection zones)
✓ Few market participants were active
✓ Inefficient price discovery occurred
✓ Similar to Fair Value Gaps in ICT/SMC methodology
TRADING APPLICATIONS:
• Breakout Acceleration: Price moves rapidly through LVN zones
• Profit Targets: Place targets beyond LVN zones where momentum slows
• Stop Loss Placement: Avoid placing stops inside LVN zones (price likely to continue)
• Confluence with FVG: LVN zones often align with Fair Value Gaps
• Retest Opportunities: When price revisits LVN, expect quick moves
─────────────────────────────────────────────────────────────
⚙️ KEY FEATURES
TIMEFRAME FLEXIBILITY:
• 5 independent timeframe slots with enable/disable toggles
• Auto-mode intelligently selects higher timeframes
• Preset options: 5m, 15m, 30m, 1H, 2H, 4H, D, W, 2W, M, 3M, 6M, 12M
VISUAL CUSTOMIZATION:
• Individual color settings for each timeframe
• Adjustable box transparency and border width
• Toggle timeframe labels and period dates on/off
• Four text size options: tiny, small, normal, large
ADVANCED CONTROLS:
• LVN Threshold: 0-50% (default 30%) - lower = fewer, stronger zones
• Immunity Period: 0-50 bars (default 20) - prevents premature closure
• Show/Hide old boxes for clean chart appearance
• Maximum 500 boxes supported per timeframe
PROFESSIONAL DISPLAY:
• Zones show timeframe label (5m, 1H, D, etc.)
• Optional period dates (dd.MM-dd.MM format)
• Boxes extend right dynamically until price touch
• Clean visual hierarchy with bordered zones
─────────────────────────────────────────────────────────────
📈 HOW TO USE
SETUP:
1. Add indicator to chart
2. Enable desired timeframes (TF1, TF2, etc.)
3. Adjust LVN threshold based on your trading style:
• 20-25% = Very selective (only thinnest zones)
• 30-35% = Balanced (recommended for most markets)
• 40-50% = More zones (higher sensitivity)
INTERPRETATION:
• RED/DARK ZONES = Low trading activity occurred here
• Price tends to move THROUGH these zones quickly
• Similar behavior to Fair Value Gaps (FVG) in Smart Money theory
• Expect acceleration when price enters LVN zones
TRADING STRATEGIES:
1. BREAKOUT TRADING:
- Wait for price to approach LVN zone
- Enter when price breaks into the zone
- Expect rapid movement through the zone
- Target next support/resistance beyond LVN
2. CONFLUENCE ANALYSIS:
- Combine with other SMC concepts (Order Blocks, FVG, Liquidity)
- LVN + FVG overlap = high-probability acceleration zone
- Use higher timeframe LVN as directional bias
3. MULTI-TIMEFRAME:
- Daily LVN = major breakout zones
- 4H LVN = intraday momentum areas
- 15m LVN = scalping opportunities
─────────────────────────────────────────────────────────────
⚠️ IMPORTANT NOTES
WHAT THIS INDICATOR IS:
✓ Market Profile TPO-based LVN detector
✓ Multi-timeframe zone identification tool
✓ Visual representation of low trading activity areas
✓ Complementary to Smart Money Concepts (SMC/ICT)
WHAT THIS INDICATOR IS NOT:
✗ Not a standalone trading system
✗ Not a guaranteed profit generator
✗ Not financial advice
✗ Requires confirmation from price action and other tools
LIMITATIONS:
• Works best on liquid markets with reliable data
• Lower timeframes may produce excessive zones
• Requires understanding of Market Profile concepts
• Performance depends on proper threshold calibration
BEST PRACTICES:
• Start with 1-2 timeframes, add more as needed
• Use higher timeframes for swing trading
• Combine with support/resistance, trendlines, order blocks
• Backtest on your specific instrument before live trading
• Adjust immunity period based on market volatility
─────────────────────────────────────────────────────────────
🔧 SETTINGS GUIDE
TIMEFRAME GROUPS (1-5):
Each group contains:
• Enable toggle - Turn timeframe on/off
• Timeframe selector - Choose period or Auto
• Box color - Zone fill color
• Border color - Zone outline color
GENERAL SETTINGS:
• LVN Threshold (%) - Percentage of max TPO to qualify as LVN
• Show Old LVN Boxes - Keep historical zones visible
• Box Border Width - Visual thickness (1-4)
• Immunity Period - Protection bars for new zones
• Show Timeframe - Display TF label in boxes
• Show Period - Display date range in boxes
• Text Size - Label size adjustment
─────────────────────────────────────────────────────────────
📊 ORIGINALITY & UNIQUENESS
This indicator is original because:
1. TPO-BASED CALCULATION: Uses Market Profile Time-Price-Opportunity methodology instead of traditional volume analysis, making it work on all markets including those without real volume data (Forex, some indices).
2. IMMUNITY SYSTEM: Unique protection mechanism prevents zones from disappearing immediately when price is already within zone boundaries at creation time.
3. TRUE MULTI-TIMEFRAME: Independent calculation for each timeframe with separate zone management, not simple higher timeframe projection.
4. SMART ZONE LIFECYCLE: Zones dynamically extend until price touch, then become static historical references.
5. FVG-LIKE BEHAVIOR: Bridges traditional Market Profile analysis with modern Smart Money Concepts by identifying zones that behave similarly to Fair Value Gaps.
Unlike existing LVN indicators that rely on volume data, this tool uses time-based analysis, making it universal across all market types and compatible with brokers that don't provide accurate volume information.
─────────────────────────────────────────────────────────────
📚 TECHNICAL BACKGROUND
MARKET PROFILE THEORY:
Developed by J. Peter Steidlmayer in the 1980s, Market Profile analyzes market behavior by examining price and time relationships. Low Volume Nodes in traditional profile represent areas where market participants showed minimal interest.
TPO (TIME PRICE OPPORTUNITY):
Instead of counting volume, TPO counts how many time periods (bars) touched each price level. This approach:
• Works on all markets regardless of volume data quality
• Reflects actual time-based market acceptance/rejection
• Reveals psychological price levels through time distribution
CONNECTION TO SMART MONEY CONCEPTS:
Fair Value Gaps (FVG) in ICT methodology represent similar inefficiencies:
• Areas where price moved too quickly
• Imbalances in buying/selling pressure
• Zones that price may revisit or accelerate through
• LVN zones often overlap with FVG locations
─────────────────────────────────────────────────────────────
🎓 RECOMMENDED RESOURCES
To maximize this indicator's effectiveness, study:
• Market Profile fundamentals (TPO, POC, Value Area)
• Smart Money Concepts (FVG, Order Blocks, Liquidity)
• Multi-timeframe analysis techniques
• Volume Profile comparison (understand the difference)
COMPANION INDICATOR:
Consider using "HVN Smart Liquidity" (opposite concept) to identify both high and low volume zones for complete Market Profile analysis.
─────────────────────────────────────────────────────────────
💬 SUPPORT & FEEDBACK
Questions or suggestions? Feel free to comment below or send a private message.
If you find this indicator useful, please boost and share with other traders!
⚠️ DISCLAIMER: This indicator is for educational purposes only. Trading involves risk. Always do your own research and use proper risk management.

Volumetric Inverse Fair Value Gap (IFVG) [Kodexius]The Volumetric Inverse Fair Value Gap (IFVG) indicator detects and visualizes inverse fair value gaps (IFVGs) zones where previous inefficiencies in price (fair value gaps) are later invalidated or “inverted.”
Unlike traditional FVG indicators, this tool integrates volume-based analysis to quantify the bullish, bearish, and overall strength of each inversion. It visually represents these metrics within a dynamically updating box on the chart, giving traders deeper insight into market reactions when liquidity imbalances are filled and reversed.
Features
Inverse fair value gap detection
The script identifies bullish and bearish fair value gaps, stores them as pending zones, and turns them into inverse fair value gaps when price trades back through the gap in the opposite direction. Each valid inversion becomes an active IFVG zone on the chart.
Sensitivity control with ATR filter and strict mode
A minimum gap size based on ATR is used to filter out small and noisy gaps. Strict mode can be enabled so that any wick contact between the relevant candles prevents the gap from being accepted as a fair value gap. This lets you decide how clean and selective the zones should be.
Show Last N Boxes control
The indicator can keep only the most recent N IFVG zones visible. Older zones are removed from the chart once the number of active objects exceeds the user setting. This prevents clutter on higher timeframes or long histories and keeps attention on the most relevant recent zones.
Ghost box for the original gap
When the ghost option is enabled, the script draws a faint box that marks the original fair value gap from which the inverse zone came. This makes it easy to see where the initial imbalance appeared and how price later inverted that area.
Volumetric bull, bear and strength metrics
For each IFVG, the script estimates how much of the bar volume is associated with buying and how much with selling, then computes bull percentage, bear percentage and a strength score that uses a percentile rank of volume. These values are stored with the IFVG object and drive the visualization inside the zone.
Three band visual layout inside each IFVG
Each active IFVG is drawn as a container with three horizontal sections. The top band represents the bull percentage, the middle band the bear percentage and the bottom band the strength metric. The width of each bar reflects its respective value so you can read the structure of the zone at a glance.
Customizable colors and label text
Colors for bull, bear, strength, the empty background area, the ghost box and label text can be adjusted in the inputs. This allows you to match the indicator to different chart themes or highlight specific aspects such as strength or direction.
Automatic invalidation and cleanup
When price clearly closes beyond the IFVG in a way that breaks the logic of that zone, the script marks it as inactive and deletes all boxes and labels linked to it. Only valid and active IFVGs remain on the chart, which keeps the display clean and focused.
Calculations
1. Detecting Fair Value Gaps (FVGs)
A fair value gap is identified when price action leaves an imbalance between candle wicks. Depending on the mode:
Bullish FVG: When low > high
Bearish FVG: When high < low
Optionally, the strict mode ensures wicks do not touch.
The gap’s significance is filtered using the ATR multiplier input to exclude minor noise.
Once detected, FVGs are stored as pending zones until inverted by opposite movement (price crossing through).
bool bull_cond = strict_mode ? (low > high ) : (close > high )
bool bear_cond = strict_mode ? (high < low ) : (close < low )
float gap_size = 0.0
if bull_cond and close > open
gap_size := low - high
if bear_cond and close < open
gap_size := low - high
2. Creating IFVGs (Inversions)
When price later moves through a previous FVG in the opposite direction, an Inverse FVG (IFVG) is created.
For example:
A previous bearish FVG becomes bullish IFVG if price moves upward through it.
A previous bullish FVG becomes bearish IFVG if price moves downward through it.
The IFVG is initialized with structural boundaries (top, bottom) and timestamp metadata to anchor visualization.
if not p.is_bull_gap and close > p.top
inverted := true
to_bull := true
if p.is_bull_gap and close < p.btm
inverted := true
to_bull := false
3. Volume Metrics (Bull, Bear, Strength)
Each IFVG calculates buy and sell volumes from the current bar’s price spread and total volume.
Bull % = proportion of upward (buy) volume
Bear % = proportion of downward (sell) volume
Strength % = normalized percentile rank of total volume
These are obtained through a custom function that estimates directional volume contribution:
calc_metrics(float o, float h, float l, float c, float v) =>
float rng = h - l
float buy_v = 0.0
if rng == 0
buy_v := v * 0.5
else
if c >= o
buy_v := v * ((math.abs(c - o) + (math.min(o, c) - l)) / rng)
else
buy_v := v * ((h - math.max(o, c)) / rng)
float sell_v = v - buy_v
float total = buy_v + sell_v
float p_bull = total > 0 ? buy_v / total : 0
float p_bear = total > 0 ? sell_v / total : 0
float p_str = ta.percentrank(v, 100) / 100.0

Consolidation Value Zones (Recio)Consolidation Value Zones introduces an original algorithm to identify consolidation ranges and locate areas of importance within them. This new method "looks" at the chart and draws zones based on price with the goal of producing actionable zones which appear natural, as if they were found through a human analysis.
> Consider the following...
The chart image above displays Bitcoin, at no specific date, for no specific reason. What I have done here is simply glanced at the chart for about 5 seconds, and circled a few areas which stood out as "obvious" consolidation. It does not take a savant to look at a chart and circle ranging price. However, what we have just done defies many common systems for identifying consolidation. We have located ranges of various zone lengths, as small as roughly 25 bars to as large as roughly 100 bars. Regardless of this, we still determined these zones with our eyes and brain in a few seconds, for some it's practically instant. The issue with us humans doing this, is that we are subjective. We did not really use any concrete rules to determine these areas with our eyes. So the problem becomes "How do we identify these zones in a way which seems natural to us with a repeatable system?" Because of this, my approach is simply a logical attempt to reverse engineer our human intuition.
> Consolidation Value Zones
The name of this indicator is generic. To dissect it, we are identifying consolidation ranges, then using a volume profile to determine the value zone within that range. The specific method used to identify these consolidation zones is something I've personally been referring to as the "skewer" method. Another name that may fit better is "Linear Range Alignment/Overlap".
Ultimately, the goal is to locate a single price level or range that overlaps many adjacent bars.
This should, in theory, return areas of visually obvious consolidation.
> The Skewer Method (Identification Method & Bar Gap Allowances)
One consistent concept across the different identification methods for determining consolidation is time. How long do we chop around before calling it consolidation? This is the "Identification Threshold". Once we have located a consolidation zone "this" wide, we will then consider it as consolidation.
In the chart image above, we are considering a six-bar consolidation formation. The figure on the left shows an example of a perfect raw bar overlap, we can see that the six bars all overlap at one price range. This is a perfect example of what we are looking to identify as consolidation. Unfortunately, if this was all we looked at, we would have a very scarce identification method.
For that reason, we have the example on the right, which shows the additional allowances for the identification of these ranges. At most, the example on the right shows a gapless three-bar overlap. However, if we allow the identification to bridge across the gaps, we are able to draw a zone directly through the center and still be within our parameters. This allowance is the "Bar Gap Allowance" and will determine the leniency of the identification.
Between our identification threshold and bar gap allowance, we can start to piece together how the script is "looking" at our chart.
> Detecting Consolidation (Live Detection)
To aid in transparency and user understanding, the live detection calculation can be seen on the chart as a box, skewering the recent historical bars with a number next to it, indicating the number of bars found as potential consolidation.
As we can see in the chart image above, the script, by default, is looking for a 15-bar consolidation, with a 5-bar gap allowance. In the image, the specific gap count is labeled, we can see the script scan backwards as far as it can before counting five gaps in the data. Once that occurs, the detection stops.
Notice how the zone found is a range, consisting of all price levels which meet the parameters. The lower level of the range only had two gaps, but the upper level reached five.
> Consolidation Range and Value Zones (Volume Profiles)
Once the script has identified the consolidation formation, it calculates a volume profile across the identified consolidation range. From this it calculates and draws the Point of Control (POC) and Value Area in addition to the full consolidation range.
Once we have our zones drawn, and understand what they identify, we can go one step further and apply concepts from volume profile trading.
Range High/Low: Displays the current extent of the identified consolidation.
Value High/Low: Shows the specific area within the consolidation where buyers and sellers found the most value.
POC: The single point, where the most volume was transacted during consolidation.
In a balanced market, we would anticipate price to rotate around POC, oscillating from Value High (VAH) to Value Low (VAL). In contrast, a market in motion moves directionally, building volume at new price levels as value, naturally the POC shifts with it.
> Zone Extensions
Unlike many other scripts, there is no mitigation logic at play here, since crossing a zone simply tells us "buyers and sellers are not currently active here", but it does not guarantee that value cannot return or react from previous areas of value.
Obviously the current zone will always be most relevant, but historical zones can retain relevance depending on the context of the market.
Remember: Each area of consolidation is an area where buyers and sellers were once facing off, resulting in price's consolidation. Amidst this, the value zone was the area of greatest agreement between the participants at that time. When moving outside of a range, we would typically look at historical value areas and price's interaction with them for further context.
Due to the ever changing market, there is no fixed extension lookback that will cover every scenario. By default, the Extension Lookback is "1", meaning the script will extend the most recent zone forward until a new zone is detected.
Note: For clarity, zone extensions are colored differently from core zones.
The following chart image shows a few examples of these unique interactions.
As seen in the chart image, looking to previous areas of value as well as POC can provide context in the form of acceptance or rejection at these levels, providing further insight into the auction for us to respond to.
The zones do contain logic to maintain a clean display. By default, the zones extend conditionally when price returns to the previous consolidation range. If desired, the zones can be extended regardless of price action; this can be toggled with the option "Regardless Extension Mode", as seen below.
> Hollow Candles & Zone Merging
When consolidation is identified, a hollow candle is drawn; these can be used to see exactly when each zone is identified. It is important to understand that consolidation zones stemming from the same origin are merged into one zone. This is a frequent occurrence when the consolidation threshold is passed, but the consolidation continues. For this reason you will often see multiple hollow candles in the later areas of the zones.
Similarly, zones from different origin points that overlap are also merged into one consolidation zone. This ensures that no core zones overlap.
Additionally, every time a zone is merged, a new volume profile for the area is calculated.
> Bar Gap Allowance Type (Technical Explanation)
The specific bar gap allowance value can be altered, but so can the type of allowance being used. While some analyses may benefit from counting the total amount of bar gaps within the consolidation, others may benefit from detecting based on consecutive bar gaps.
The chart image above displays the gap counts for each gap allowance type.
The total bar gap allowance type will count until the gap amount is reached, then terminate detection once the allowed number of gaps has been exceeded.
The consecutive bar gap allowance type resets its count once it finds a valid bar within range, by doing so, it only counts the bars that separate each island of in-range bars.
Both methods have merit.
> Implementation
This identification method has proven effective to identify consolidation across market types. As a result, there cannot be one configuration of settings to fit every application. Adapting the detection type and method for each trader's specific market conditions is highly recommended.
When determining parameters, it is helpful to consider time, as it plays a major role in the identification method.
On a 1D chart, the default threshold of 15 corresponds to 15 days, or about 3 weeks depending on the ticker. To identify periods of one-week consolidation, a threshold of 5 would be suitable. To detect perfect gapless weeks, a bar gap allowance of 0 could be used, as seen in the chart image below.
Additional Example:
In the chart image above, we see a 15-second forex chart over the span of a few hours. The detection parameters are set up to detect 15-minute consolidation with a 2-minute max dead zone (consecutive bar gap).
> Detection Source
By default, the script detects consolidation ranges using the full extent of candle wicks. While this is traditional, detection can also be done using only the candle bodies. These identifications are much more nuanced, detecting only from confirmed candle price action; they do not trigger at the same frequency as wick detection.
Optionally, a "Wick/Body Average" can be chosen as the source for detection; as the name implies, this uses the average value between the candle body and its respective wick.
> Additional Settings
The settings mentioned thus far serve as core parameters for identifying consolidation. The following parameters are simply included for the benefit of the advanced user. It is not recommended to adjust these settings under normal circumstances.
- Value Area Percent: Default = 68.26, while traditionally 70 for volume profiles, 68.26 is accurate to the values of a standard bell-curve distribution. The differences are minimal in application.
- VP Rows: Default = 99, Sets the number of rows to be used when calculating the Volume Profiles (VP); note that higher values will lead to a slower calculation. Max value: 999
> Final Notes
If you have made it this far, thank you for reading.
I hope you find value in this new consolidation identification system and understand the logic behind it.
That's it.
Skrip berbayar

Earnings Gap UpsBased on research conducted by John Pocorobba and Jason Thompson, the Earnings Gap Ups Indicator is designed to identify three types of earnings gaps, key levels, and the "alpha window"—a period when stocks often outperform following a gap. These gaps are frequently observed in high-performing stocks.
What is an Earnings Gap?
An earnings gap occurs when a stock's price makes a significant jump, after the company reports earnings signifying the street (institutions) were caught off guard.
The three different types of gaps are as follows: [/b
PEG (Power Earnings Gap)
Price gain of 10% or more
Volume is greater than 200% above the 50-day average
EPS surprise of at least 20%
Monster Gap
Price gain of 20% or more
Volume is greater than 300% above the 50-day average
No fundamental requirement
Monster Peg
Price Gain of 20% or more
Volume is greater than 300% above the 50-day average
EPS surprise of at least 20%
Key Levels and the Alpha Window
In addition to spotting these gaps, the indicator marks key levels on the chart and extends them through the alpha window, which represents the time period when the stock tends to outperform after the gap.
Key levels include:
High volume close: The closing price on a day with unusually high trading volume
High volume close minus 5%: A potential support level below the high volume close
Gap day high: The highest price reached on the gap day
Gap day low: The lowest price reached on the gap day
By understanding and tracking these gaps and levels, traders can map out a playbook for trading earnings gaps.

ShuffleOverview
This TV script is designed to assist traders by visually marking key price levels and identifying potential trading opportunities on their charts. The script highlights the previous day's, week's, and month's highs and lows, as well as hourly fair value gaps. By providing clear visual indicators, traders can make more informed decisions based on significant price movements and gaps in the market.
Features
1. Previous Day Highs and Lows
Highs and Lows: Automatically plots the highest and lowest price points from the previous trading day.
Visual Indicators: Uses distinct colors and lines to differentiate between highs and lows for easy identification.
Alerts: Optional alerts when current price approaches these levels.
2. Weekly Highs and Lows
Weekly Range: Marks the highest and lowest prices of the current week.
Trend Analysis: Helps in identifying the overall trend direction based on weekly extremes.
Support and Resistance: Acts as dynamic support and resistance levels for potential trade setups.
3. Monthly Highs and Lows
Monthly Extremes: Highlights the highest and lowest prices recorded in the current month.
Long-Term Perspective: Provides insights into long-term market sentiment and potential major support/resistance zones.
Investment Decisions: Aids in making strategic investment decisions based on significant monthly price movements.
4. Hourly Fair Value Gaps
Fair Value Gaps (FVG): Identifies gaps between the high of one hour and the low of the next hour where no trading has occurred.
Price Retracement: Marks areas where price is likely to retrace to fill these gaps, offering potential entry points.
Gap Analysis: Assists in understanding market inefficiencies and potential price corrections.

[F][IND] FVG IdentifierMastering Market Imbalances with Ease
The FVG Identifier stands as a groundbreaking TradingView indicator, crafted to illuminate the often-overlooked Fair Value Gaps (FVG) in the dynamic world of price action trading. Let’s dive into how this tool is transforming the approach to identifying market inefficiencies.
Decoding Fair Value Gaps
Central to the concept of FVGs is the identification of market imbalances — moments where the equilibrium between buying and selling pressures is disrupted. These gaps are typically seen in a sequence of three candles, where a dominant candle is surrounded by others whose wicks fail to fully overlap it. These formations are critical as they often influence future price directions, acting as potential magnets.
Simplifying the Detection of FVGs
The FVG Identifier is engineered to enhance the visibility of Fair Value Gaps, making them starkly apparent even in complex market charts. Its algorithms ensure that these vital market indicators are easily and promptly recognized, allowing traders to spot valuable trading opportunities with minimal effort.
Features of the FVG Identifier
1. Intuitive Interface: The indicator is designed for ease of use, accommodating both beginners and experienced traders.
2. Customizable Settings: It offers flexible configuration options, allowing for adaptation to various trading styles and strategies.
3. Strategic Trading Insight: By highlighting FVGs, the tool provides traders with actionable insights for strategic entry and exit points based on potential price movements.
Elevating Your Trading Strategy
Incorporating the FVG Identifier into your trading arsenal equips you with a nuanced perspective on market analysis. It not only assists in identifying significant market imbalances but also enriches your technical analysis with powerful, data-backed insights.
Revolutionizing Price Action Trading
The FVG Identifier transcends the role of a mere indicator; it represents a significant leap in trading methodology. Compatible with various trading platforms, this tool is ready to enhance your market understanding and application of Fair Value Gaps.
Embrace the FVG Identifier to uncover the hidden dynamics of market gaps and translate these insights into efficient and profitable trading strategies.
Disclaimer:
This indicator is provided for educational purposes only. Trading involves risk, and users should consult with a financial professional before making any trading decisions.
Your Feedback Matters!
Please feel free to comment or reach out if you have any improvement suggestions or if you would like to request the development of a specific indicator. Your feedback is invaluable!

Auto Support & Resistance From Option Strike Price + PercentagesAUTO SUPPORT AND RESISTANCE FROM OPTIONS STRIKE PRICES WITH PERCENTAGE GAPS
This is an auto support and resistance level indicator that uses options strike prices or psychological numbers as the relevant levels. Set your starting level or strike price and input the options strike price gaps for that ticker and 15 lines in either direction will automatically populate on the chart. It also has a table in the bottom right corner that tells you how far the current price is from the next closest support and resistance levels.
Everything is easily customizable in the indicator input settings including turning the lines on/off, turning the percentage gaps table on/off, setting the options strike price gaps, setting the starting level, setting the position of the percentage gaps table, changing support and resistance line colors all at once and updating the linewidth of all of the support and resistance lines at once.
***HOW TO USE***
First, go into the indicator settings and set the starting level to use. If you are trading SPY and it is near 450, then set your starting level at 450. If you are trading SQQQ and it is near 38, set your starting level to 38. If you are trading crypto, set your levels to the nearest psychological or round number such as 40,000 for BTC or 2,500 for ETH or 16.50 for LINK.
Second, set your options strike price gaps. If you are trading SPY, this will be 2.5. If you are trading SQQQ this number would be 1. If you are trading crypto, try using psychological price levels instead of strike prices, such as 500, 1000 or 5000 for BTC and 100, 250 or 500 for ETH. For small priced cryptos, use decimals such as .25, .50, etc.
Once these inputs are filled in, 15 levels in each direction will automatically populate on the chart for you.
If price is above a level, it will paint green. If price is below a level it will paint red. These colors represent support and resistance visually for you on the chart and will change dynamically as price moves above or below these levels. These colors can be customized in the indicator input settings to change all lines by only updating one color.
There is a table of percentage gap updates that will tell you in real time how far away the price is from the nearest support and resistance lines so you always know your risk to reward ratios. Each label will also be colored the same as the corresponding support or resistance line as a visual aid.
***MARKETS***
This indicator can be used as a signal on all markets, including stocks, crypto, futures and forex.
***TIMEFRAMES***
This support and resistance indicator can be used on all timeframes.
***TIPS***
Try using numerous indicators of ours on your chart so you can instantly see the bullish or bearish trend of multiple indicators in real time without having to analyze the data. Some of our favorites are our Auto Fibonacci, Directional Movement Index, Volume Profile, Momentum and Money Flow Index in combination with this auto support and resistance indicator. They all have real time Bullish and Bearish labels as well so you can immediately understand each indicator's trend.

Gap-Up Momentum Screener (S.S)
ENGLISH-VERSION
1) TradingView Gap Screener (for US stocks)
➤ Conditions
Gap-Up ≥ +3% (large gaps indicate institutional pressure)
Pre-market volume ≥ 150% of the 20-day average
RS line > 50
Price > 50 SMA
Market cap ≥ 1 billion USD
No penny stocks
2) Minervini Gap-Entry Strategy (Swing Trading)
This is a variant specifically optimized for gaps + momentum.
A) Setup Criteria
The stock must meet the following conditions:
Gap-Up ≥ +3%
First retracement ≤ 30% of the gap
High relative strength (RS line rising)
Volume on the gap day > 2× average
Price above 20 EMA, 50 SMA, 150 SMA, 200 SMA
No immediate resistance within 2–5%
B) Entry Setups
Entry 1: First Pullback Entry (FPE)
Wait for the first 1–3 day consolidation.
Entry → Breakout of the small range.
Stop → Below the low of the pullback.
Rule: No entry on the gap day itself.
Entry 2: High Tight Flag above the Gap
Stock rises > 10% after the gap
Then forms a 3–8 day sideways phase
Entry → Break above the flag’s high
Stop → Below the flag base
Entry 3: ORB Entry (Opening Range Breakout, 30 minutes)
Very effective for strong gaps.
Wait 30 minutes after the market opens
Entry → Break above the high of these first 30 minutes
Stop → Below the 30-minute low
C) Stop Levels
For FPE: 4–8%
For ORB: 1–2 × ATR(14)
For flags: 3–5%
D) Add Rules
Only if the stock continues showing strong volume:
Add on every new 3–5 day high
Add only above half-range levels
Maximum 3 adds
3) Early-Warning Module (Setup forming but not ready for entry)
This module marks stocks that are forming a setup but are not yet buyable.
➤ Criteria
Gap-Up ≥ 3%
Strong volume
Stock pulls back and consolidates (1–5 bars)
BUT no breakout yet
4) Exact Entry Checklist (Minervini-style, optimized for gaps)
Checklist before entry:
Gap ≥ +3%
20 EMA rising
Volume > 2× average
RS line rising
Price > 50 SMA
Pullback not deeper than 30% of the gap
3+ green signals from the Early-Warning diamonds
If all 7 are fulfilled → green light.
5) How to apply the strategy in daily practice
Morning (08:00–09:00)
Check the screener
Build your watchlist
Identify gaps
US Market Open (15:30)
Monitor the Early-Warning module
Sort gap momentum opportunities
16:00–17:00
Enter: First Pullback / ORB / Flag
Set stops
Determine position size based on risk
After 20:00
Check volume strength
If momentum fades → no more adds

FVG Visual Super Clean (ticks)This is a robust and highly visual indicator designed for traders utilizing Smart Money Concepts (SMC) or Inner Circle Trader (ICT) methodologies.
Its core function is to automatically identify, visualize, and manage Fair Value Gaps (FVGs) or price inefficiencies, offering deep insight into institutional order flow.
Key Features & Capabilities
Advanced FVG Detection: Accurately identifies bullish and bearish Fair Value Gaps (FVGs) based on the 3-bar pattern.
Wick vs. Body Logic: Configurable option to use candle wicks (high/low) or bodies (open/close) for FVG calculation.
Displacement Confirmation: Includes an optional filter to require price displacement (a strong close) for higher conviction setups.
Mitigation Tracking & Management: The script actively tracks how much the price has filled or "mitigated" the FVG.
Threshold Auto-Removal: FVGs that reach a user-defined mitigation percentage (mitigation_pct) are automatically removed to keep the chart clean.
Mitigated Visibility: An optional setting allows mitigated FVGs to remain visible, repainting them with a distinct "Mitigated" color (blue by default) to show the exact point of rebalance.
Visual Efficiency:
Automatic Extension: Active, unmitigated FVGs are automatically extended forward in time until they are filled or pruned.
Equilibrium Line: Draws a dotted line at the 50% level (Equilibrium) of each FVG, a key reference point in SMC/ICT trading.
Tick-Based Filtering: Allows filtering gaps by a minimum size in ticks, reducing noise from insignificant micro-gaps.
Trend Context: Integrates a configurable Moving Average (EMA or SMA) for contextual trend analysis. The MA line changes color dynamically (green/red) to quickly signal momentum.
Optimized Performance: Implements a lookback window (lookback_days) and a cleanup routine to manage the number of drawing objects, ensuring smooth performance even on low timeframes.
Ideal For:
Traders focused on SMC/ICT Order Blocks, Imbalances, and Price Delivery.
Backtesting price action strategies around institutional liquidity.
Identifying high-probability entries (e.g., at the 50% line) and targets (e.g., unmitigated gaps).

FVG MagicFVG Magic — Fair Value Gaps with Smart Mitigation, Inversion & Auto-Clean-up
FVG Magic finds every tradable Fair Value Gap (FVG), shows who powered it, and then manages each gap intelligently as price interacts with it—so your chart stays actionable and clean.
Attribution
This tool is inspired by the idea popularized in “Volumatic Fair Value Gaps ” by BigBeluga (licensed CC BY-NC-SA 4.0). Credit to BigBeluga for advancing FVG visualization in the community.
Important: This is a from-scratch implementation—no code was copied from the original. I expanded the concept substantially with a different detection stack, a gap state machine (ACTIVE → 50% SQ → MITIGATED → INVERSED), auto-clean up rules, lookback/nearest-per-side pruning, zoom-proof volume meters, and timeframe auto-tuning for 15m/H1/H4.
What makes this version more accurate
Full-coverage detection (no “missed” gaps)
Default ICT-minimal rule (Bullish: low > high , Bearish: high < low ) catches all valid 3-candle FVGs.
Optional Strict filter (stricter structure checks) for traders who prefer only “clean” gaps.
Optional size percentile filter—off by default so nothing is hidden unless you choose to filter.
Correct handling of confirmations (wick vs close)
Mitigation Source is user-selectable: high/low (wick-based) or close (strict).
This avoids false “misses” when you expect wick confirmations (50% or full fill) but your logic required closes.
State-aware labelling to prevent misleading data
The Bull%/Bear% meter is shown only while a gap is ACTIVE.
As soon as a gap is 50% SQ, MITIGATED, or INVERSED, the meter is hidden and replaced with a clear tag—so you never read stale participation stats.
Robust zoom behaviour
The meter uses a fixed bar-width (not pixels), so it stays proportional and readable at any zoom level.
Deterministic lifecycle (no stale boxes)
Remove on 50% SQ (instant or delayed).
Inversion window after first entry: if price enters but doesn’t invert within N bars, the box auto-removes once fully filled.
Inversion clean up: after a confirmed flip, keep for N bars (context) then delete (or 0 = immediate).
Result: charts auto-maintain themselves and never “lie” about relevance.
Clarity near current price
Nearest-per-side (keep N closest bullish & bearish gaps by distance to the midpoint) focuses attention where it matters without altering detection accuracy.
Lookback (bars) ensures reproducible behaviour across accounts with different data history.
Timeframe-aware defaults
Sensible auto-tuning for 15m / H1 / H4 (right-extension length, meter width, inversion windows, clean up bars) to reduce setup friction and improve consistency.
What it does (under the hood)
Detects FVGs using ICT-minimal (default) or a stricter rule.
Samples volume from a 10× lower timeframe to split participation into Bull % / Bear % (sum = 100%).
Manages each gap through a state machine:
ACTIVE → 50% SQ (midline) → MITIGATED (full) → INVERSED (SR flip after fill).
Auto-clean up keeps only relevant levels, per your rules.
Dashboard (top-right) displays counts by side and the active state tags.
How to use it
First run (show everything)
Use Strict FVG Filter: OFF
Enable Size Filter (percentile): OFF
Mitigation Source: high/low (wick-based) or close (stricter), as you prefer.
Remove on 50% SQ: ON, Delay: 0
Read the context
While ACTIVE, use the Bull%/Bear% meter to gauge demand/supply behind the impulse that created the gap.
Confluence with your HTF structure, sessions, VWAP, OB/FVG, RSI/MACD, etc.
Trade interactions
50% SQ: often the highest-quality interaction; if removal is ON, the box clears = “job done.”
Full mitigation then rejection through the other side → tag changes to INVERSED (acts like SR). Keep for N bars, then auto-remove.
Keep the chart tidy (optional)
If too busy, enable Size Filter or set Nearest per side to 2–4.
Use Lookback (bars) to make behaviour consistent across symbols and histories.
Inputs (key ones)
Use Strict FVG Filter: OFF(default)/ON
Enable Size Filter (percentile): OFF(default)/ON + threshold
Mitigation Source: high/low or close
Remove on 50% SQ + Delay
Inversion window after entry (bars)
Remove inversed after (bars)
Lookback (bars), Nearest per side (N)
Right Extension Bars, Max FVGs, Meter width (bars)
Colours: Bullish, Bearish, Inversed fill
Suggested defaults (per TF)
15m: Extension 50, Max 12, Inversion window 8, Clean up 8, Meter width 20
H1: Extension 25, Max 10, Inversion window 6, Clean up 6, Meter width 15
H4: Extension 15, Max 8, Inversion window 5, Clean up 5, Meter width 10
Notes & edge cases
If a wick hits 50% or the far edge but state doesn’t change, you’re likely on close mode—switch to high/low for wick-based behaviour.
If a gap disappears, it likely met a clean up condition (50% removal, inversion window, inversion clean up, nearest-per-side, lookback, or max-cap).
Meters are hidden after ACTIVE to avoid stale percentages.

FVG & IFVG Box Detector
The "FVG & IFVG Box Detector" is a custom Pine Script v6 indicator for TradingView that identifies and highlights Fair Value Gaps (FVGs) and their subsequent mitigation as Imbalance Fair Value Gaps (IFVGs) on a price chart. Tailored for use on a 5-minute timeframe (though it must be manually set by the user due to script limitations), this indicator provides a visual representation of market imbalances using colored boxes, which automatically disappear when the gaps are filled by price action. The script is designed to be clean and minimalistic, omitting text labels or annotations as per your preference.Key FeaturesFVG Detection:A Bullish FVG is detected when the low of the current candle is higher than the high of the candle two bars ago, indicating a potential upward imbalance, visualized with a green-bordered box filled with a semi-transparent green background.
A Bearish FVG is detected when the high of the current candle is lower than the low of the candle two bars ago, indicating a potential downward imbalance, visualized with a red-bordered box filled with a semi-transparent red background.
A minimum gap size filter (default 0%) can be adjusted to exclude small gaps, ensuring only significant imbalances are highlighted.
IFVG Transition:When a Bearish FVG is filled (price closes below its lower boundary), the red box disappears, and a blue-bordered box with a semi-transparent blue background briefly appears to mark the Bullish IFVG, indicating the zone may now act as support. This box then vanishes.
When a Bullish FVG is filled (price closes above its upper boundary), the green box disappears, and an orange-bordered box with a semi-transparent orange background briefly appears to mark the Bearish IFVG, indicating the zone may now act as resistance. This box then vanishes.
The disappearance of boxes reflects the resolution of the imbalance, keeping the chart uncluttered.
Customization:Users can toggle the display of Bullish FVGs, Bearish FVGs, Bullish IFVGs, and Bearish IFVGs via input settings.
The extendBars parameter (default 50) controls how far to the right the boxes extend, allowing adjustment of their visibility duration.
Colors for Bullish FVG, Bearish FVG, Bullish IFVG, and Bearish IFVG can be customized using TradingView’s color picker, with defaults set to semi-transparent green, red, blue, and orange, respectively.
Performance:The script includes a cleanup mechanism to limit the number of active boxes to 50 per type, preventing performance issues by deleting the oldest boxes when the limit is exceeded.
It uses static variable assignments to ensure compatibility with Pine Script v6’s strict type requirements for drawing functions.
FunctionalityThe indicator scans each bar on the 5-minute chart to detect FVGs based on the defined conditions.
Upon detection, it creates a box extending from the starting bar (two bars ago) to the current bar plus the extendBars value, using the high and low prices to define the box’s vertical range.
When price action fills an FVG, the original box is deleted, and a brief IFVG box is created at the same price levels, which also disappears, signaling the imbalance has been neutralized.
No text or labels are displayed, ensuring a clean visual experience focused solely on the boxes.
Intended UseTraders: This tool is ideal for traders using FVG and IFVG concepts (common in Smart Money or ICT trading strategies) to identify potential support and resistance zones. The blue boxes (Bullish IFVGs) may indicate areas to buy or expect a bounce, while orange boxes (Bearish IFVGs) may indicate areas to sell or expect a pullback.
Chart Analysis: By observing when and where boxes appear and disappear, traders can track market structure shifts without cluttering the chart with annotations.
LimitationsThe script must be applied to a 5-minute chart manually, as the timeframe argument is not supported due to the use of drawing functions.
The brief appearance of IFVG boxes means historical levels must be tracked manually (e.g., via screenshots) or by adjusting the script to retain them if desired.
The minimum gap size filter might need tuning depending on the instrument (e.g., Gold) to capture relevant gaps.
Current Status (as of 08:53 AM EDT, October 23, 2025)The script is fully functional on your 5-minute chart, with the latest version (v5) resolving the timeframe error by removing the invalid argument. Boxes should now appear and disappear as intended, with green for Bullish FVGs, red for Bearish FVGs, blue for Bullish IFVGs, and orange for Bearish IFVGs.

DynamoSent DynamoSent Pro+ — Professional Listing (Preview)
— Adaptive Macro Sentiment (v6)
— Export, Adaptive Lookback, Confidence, Boxes, Heatmap + Dynamic OB/OS
Preview / Experimental build. I’m actively refining this tool—your feedback is gold.
If you spot edge cases, want new presets, or have market-specific ideas, please comment or DM me on TradingView.
⸻
What it is
DynamoSent Pro+ is an adaptive, non-repainting macro sentiment engine that compresses VIX, DXY and a price-based activity proxy (e.g., SPX/sector ETF/your symbol) into a 0–100 sentiment line. It scales context by volatility (ATR%) and can self-calibrate with rolling quantile OB/OS. On top of that, it adds confidence scoring, a plain-English Context Coach, MTF agreement, exportable sentiment for other indicators, and a clean Light/Dark UI.
Why it’s different
• Adaptive lookback tracks regime changes: when volatility rises, we lengthen context; when it falls, we shorten—less whipsaw, more relevance.
• Dynamic OB/OS (quantiles) self-calibrates to each instrument’s distribution—no arbitrary 30/70 lines.
• MTF agreement + Confidence gate reduce false positives by highlighting alignment across timeframes.
• Exportable output: hidden plot “DynamoSent Export” can be selected as input.source in your other Pine scripts.
• Non-repainting rigor: all request.security() calls use lookahead_off + gaps_on; signals wait for bar close.
Key visuals
• Sentiment line (0–100), OB/OS zones (static or dynamic), optional TF1/TF2 overlays.
• Regime boxes (Overbought / Oversold / Neutral) that update live without repaint.
• Info Panel with confidence heat, regime, trend arrow, MTF readout, and Coach sentence.
• Session heat (Asia/EU/US) to match intraday behavior.
• Light/Dark theme switch in Inputs (auto-contrasted labels & headers).
⸻
How to use (examples & recipes)
1) EURUSD (swing / intraday blend)
• Preset: EURUSD 1H Swing
• Chart: 1H; TF1=1H, TF2=4H (default).
• Proxies: Defaults work (VIX=D, DXY=60, Proxy=D).
• Dynamic OB/OS: ON at 20/80; Confidence ≥ 55–60.
• Playbook:
• When sentiment crosses above 50 + margin with Δ ≥ signalK and MTF agreement ≥ 0.5, treat as trend breakout.
• In Oversold with rising Coach & TF agreement, take fade longs back toward mid-range.
• Alerts: Enable Breakout Long/Short and Fade; keep cooldown 8–12 bars.
2) SPY (daytrading)
• Preset: SPY 15m Daytrade; Chart: 15m.
• VIX (D) matters more; preset weights already favor it.
• Start with static 30/70; later try dynamic 25/75 for adaptive thresholds.
• Use Coach: in US session, when it says “Overbought + MTF agree → sell rallies / chase breakouts”, lean momentum-continuation after pullbacks.
3) BTCUSD (crypto, 24/7)
• Preset: BTCUSD 1H; Chart: 1H.
• DXY and BTC.D inform macro tone; keep Carry-forward ON to bridge sparse ticks.
• Prefer Dynamic OB/OS (15/85) for wider swings.
• Fade signals on weekend chop; Breakout when Confidence > 60 and MTF ≥ 1.0.
4) XAUUSD (gold, macro blend)
• Preset: XAUUSD 4H; Chart: 4H.
• Weights tilt to DXY and US10Y (handled by preset).
• Coach + MTF helps separate trend legs from news pops.
⸻
Best practices
• Theme: Switch Light/Dark in Inputs; the panel adapts contrast automatically.
• Export: In another script → Source → DynamoSent Pro+ → DynamoSent Export. Build your own filters/strategies atop the same sentiment.
• Dynamic vs Static OB/OS:
• Static 30/70: fast, universal baseline.
• Dynamic (quantiles): instrument-aware; use 20/80 (default) or 15/85 for choppy markets.
• Confidence gate: Start at 50–60% to filter noise; raise when you want only A-grade setups.
• Adaptive Lookback: Keep ON. For ultra-liquid indices, you can switch it OFF and set a fixed lookback.
⸻
Non-repainting & safety notes
• All request.security() calls use lookahead=barmerge.lookahead_off and gaps=barmerge.gaps_on.
• No forward references; signals & regime flips are confirmed on bar close.
• History-dependent funcs (ta.change, ta.percentile_linear_interpolation, etc.) are computed each bar (not conditionally).
• Adaptive lookback is clamped ≥ 1 to avoid lowest/highest errors.
• Missing-data warning triggers only when all proxies are NA for a streak; carry-forward can bridge small gaps without repaint.
⸻
Known limits & tips
• If a proxy symbol isn’t available on your plan/exchange, you’ll see the NA warning: choose a different symbol via Symbol Search, or keep Carry-forward ON (it defaults to neutral where needed).
• Intraday VIX is sparse—using Daily is intentional.
• Dynamic OB/OS needs enough history (see dynLenFloor). On short histories it gracefully falls back to static levels.
Thanks for trying the preview. Your comments drive the roadmap—presets, new proxies, extra alerts, and integrations.

NWOG/NDOG by OutOfOptionsNew Week Opening Gap (NWOG) and New Day Opening Gap (NDOG)
NWOG and NDOG represent price imbalances formed when markets skip over certain levels at the start of a new week or trading day. These gaps often serve as magnets for price action throughout the week or day, drawing prices back to fill them while also functioning as key support or resistance zones. They are particularly relevant in futures markets, though less so in equities.
Consequent Encroachment (CE)
The CE, which is the midpoint of an NWOG or NDOG, frequently emerges as a critical level—especially if the gap remains unbalanced. In such cases, it can exert a strong pull on price, encouraging retracement or consolidation.
Indicator Features
This indicator allows you to display any number of NWOGs and NDOGs directly on your chart, with complete customization of their visual appearance. You can assign distinct colors to the most recent gaps for easy identification. Unlike other tools, it includes a filtering option to exclude minor gaps that may lack significance. Additionally, the "Smart" mode intelligently positions price labels to ensure they remain visible and uncluttered at all times.
How Does it Work
The indicator tracks all daily closes and new day opens, capturing the two values representing the top/bottom of NDOG/NWOG. I If the day begins on a Sunday, the gap is identified as NWOG; otherwise, it is classified as NDOG. A key feature of the indicator is that it avoids duplicating NDOGs that are also NWOGs.
Next, the indicator applies the size filter setting (if set above 0) to skip minor gaps. Valid gaps are then displayed on the screen using a style configured in the indicator settings for the most recent NDOG/NWOG.
To prevent the chart from becoming cluttered, the indicator limits the number of NWOG/NDOGs shown. When a new NWOG/NDOG is added, it checks the total displayed, and if this exceeds the configured limit, the oldest NWOG/NDOG is removed. Additionally, the indicator updates the display style of the previous NWOG/NDOG to the generic (non-last) style as specified in the settings.
For labels showing NWOG/NDOG price ranges and CE, the indicator offers a "Smart" option that dynamically positions labels 10 bars from the last candle and adjusts them every 5 candles. Otherwise, labels are placed at the end of the week for NWOGs and at the end of the following day for NDOGs.

Perfect Candles By SalamunPerfect Candles Compass Trade Academy By Salamun
The "Perfect Candles By Salamun" indicator is a custom indicator for the TradingView trading platform that uses Pine Script v5. Let me explain its function and usage:
Main Function
1. Candlestick Display Modification
This indicator redraws candlesticks with special logic, especially to handle price gaps that occur when the market reopens after a close.
2. Eliminate Price Gaps
When the market opens after a break (for example after a weekend or holiday), there is usually a gap between the previous closing price and the new opening price.
This indicator "fixes" the gap by adjusting the open price of the new candle to be equal to the close price of the previous candle.
Input Parameters
"Valid only on open days" (default: false)
If enabled, modifications are only applied on market opening days.
If disabled, all candles will be modified
"Hourly threshold for detecting open days" (default: 6 hours)
Determine the time threshold for detecting gaps.
If the time interval between candles is > 6 hours, it is considered as the opening of a new day.
"Show Price" (default: true)
Displays a horizontal price line at the last price level
Ways of working
Gap Detection : Calculating the time difference between candles
Modification Conditions :
If applyToDayOpenOnly= false, OR
If the time gap > the specified threshold
Price Adjustment :
Open price = Close price of the previous candle
Close, High, Low still use original values
Coloring :
Teal green for bullish candles (close ≥ open)
Red for bearish candle (close < open)
Utility
For Traders:
Provides a smoother chart visualization without gaps
Helps with more continuous technical analysis
Useful for timeframes that often experience gaps (such as daily, weekly)
For Analysis:
Reduces noise from opening gap
Helps identify clearer trends
Suitable for strategies that focus on continuous price movements

Fair Value Gap MTF [by Oberlunar]Fair Value Gap MTF is a multi-timeframe indicator designed to detect and display Fair Value Gaps (FVGs) across up to five customizable timeframes. Fair Value Gaps are price inefficiencies—zones where the market moved too quickly, leaving unfilled areas between candles. These gaps are often used by traders as reference points for future price retracements, as they tend to be revisited or “mitigated” over time.
This indicator extends the traditional FVG concept by introducing dynamic multi-timeframe tracking. Each timeframe has its own visual layer, with distinct user-defined colors for bullish and bearish gaps. The script not only highlights newly formed FVGs but also updates them visually when they are touched by price. Mitigated FVGs are recolored in real time, and an optional setting allows the size of these zones to shrink progressively, reflecting only the remaining untested portion.
Labels at the center of each box display the originating timeframe, offering clear visual context. All calculations are properly aligned with the display chart, ensuring that each FVG is correctly projected into the current view, regardless of its timeframe of origin.
Fair Value Gaps often act as support or resistance levels. Bullish FVGs can serve as areas where price may find support, while bearish FVGs can signal potential resistance. When these zones are mitigated repeatedly, it typically reflects areas of institutional interest, liquidity pools, or zones of accumulation and distribution. Such behavior makes them particularly significant in breakout and reversal strategies.
— Oberlunar 👁️★