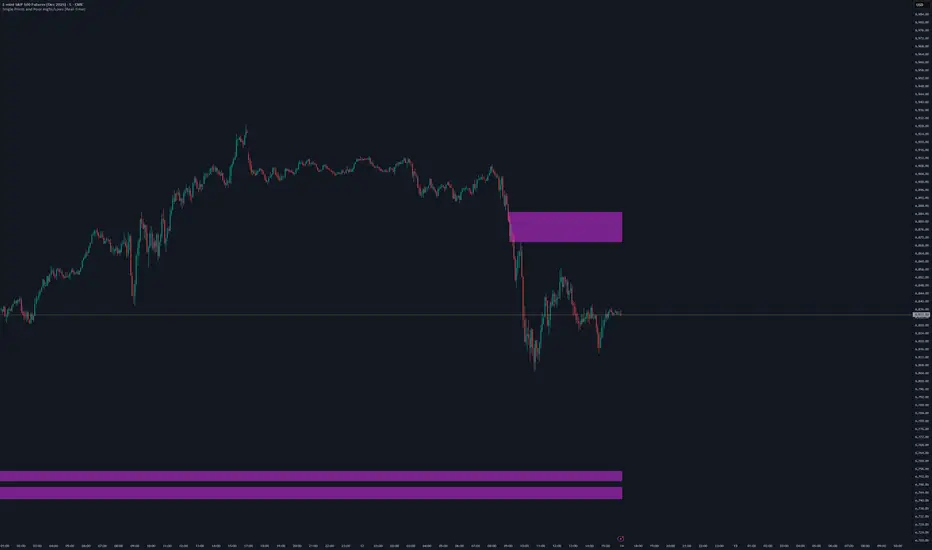
Single Prints and Poor Highs/Lows [Real-Time]This indicator is designed for traders utilizing Auction Market Theory (AMT) who need real-time visibility into market structure inefficiencies. Unlike standard TPO tools that often wait for closed bars or finished sessions, this script builds a developing TPO profile tick-by-tick to identify Single Prints and Poor Highs/Lows the moment they form.
Key Features:
Real-Time Single Prints: Automatically detects and highlights areas of single-print inefficiencies (buying/selling tails) as they happen. These "ghost" boxes persist on the chart until price repairs (fills) them, acting as immediate targets or support/resistance zones.
Poor High/Low Detection: Strictly implements AMT logic to identify "unfinished" auctions. If a session extreme is formed by two or more TPO blocks (indicating a flat top/bottom rather than a rejection tail), it marks the level with a dotted line.
Repair Logic: Both Single Prints and Poor High/Low lines are dynamic. If price revisits and repairs the structure, the markers automatically vanish to keep your chart clean.
Session Control: Fully customizable RTH (Regular Trading Hours) session input (default 08:30–15:15) to ensure profiles are built on relevant liquidity.
Quantization: Adjustable "Ticks per Block" allowing you to tune the sensitivity of the TPO profile to different assets (ES, NQ, CL, etc.).
How It Works:
TPO Construction: The script breaks the session into 30-minute periods (configurable) and tracks price overlap.
Single Prints: When the market expands rapidly, leaving gaps in the profile (single TPO blocks), a box is drawn. If price trades back through this box, it deletes itself.
Poor Extremes: It monitors the current session High and Low. If the extreme price level has a TPO count of ≥ 2, it is flagged as "Poor." If the extreme is a single print (count = 1), it is considered a valid tail and left unmarked.
Settings:
RTH Session: Define your specific trading session time.
TPO Period: Default is 30 minutes (standard AMT).
Ticks per Block: Controls the vertical resolution of the TPO. (Higher values = coarser profile, Lower values = more precision).
Colors: Fully customizable colors for Live Prints, Historical Prints, and Poor High/Low lines.
Usage:
Use this tool to spot immediate structural targets. A Poor High often acts as a magnet for price to revisit and "repair," while Single Prints often defend as support/resistance on the first retest.
Cari dalam skrip untuk "high low"
SMC pro trend
The PSK FX Structure Indicator (also known as SMC pro trend) is a complete Smart Money Concepts (SMC) toolkit designed for professional structure traders.
It detects and visualizes key price structure elements such as BoS (Break of Structure), CHoCH (Change of Character), HH/HL/LH/LL, IDM zones, SCOB, sweeps, inside bars, and EMA confluence — all with precise non-repainting logic.
This indicator helps traders read price action like an institution — identifying liquidity shifts, order flow direction, and possible reversal or continuation zones.
⸻
⚙️ Core Features
🧭 Structure Detection
• Automatic detection of major structure points:
• HH – Higher High
• HL – Higher Low
• LH – Lower High
• LL – Lower Low
• Confirms BoS (Break of Structure) and CHoCH (Change of Character) events in both bullish and bearish markets.
• Marks each structure change with labels and connecting lines for clarity.
🔁 BoS / CHoCH Logic
• Solid line = BoS
• Dashed line = CHoCH
• Colored by direction:
• 🟩 Bullish = Green
• 🟥 Bearish = Red
• Option to show live BoS/CHoCH lines extending forward for real-time updates.
🧱 IDM (Internal Displacement Model) Zones
• Detects previous and live IDM zones (premium/discount zones).
• Highlights IDM candles that cause structural displacement.
• Labels each detected IDM level automatically.
⚡ Sweeps (Liquidity Grab Detection)
• Detects when price sweeps previous highs/lows.
• Marks these zones with dotted lines and optional “X” markers.
🧩 SCOB Pattern (Smart Candle Order Block)
• Detects and colors special SMC candle structures:
• Bullish SCOB → Aqua
• Bearish SCOB → Fuchsia
• Option to color all bars by trend direction or only highlight SCOB bars.
🧭 Internal Structure & Pivots
• Marks minor highs/lows (internal structure) for better IDM leg visualization.
• Helps identify early momentum shifts before major structure breaks.
🎯 1.618 Target Projection
• Projects 1.618 Fibonacci targets dynamically after BoS or CHoCH confirmation.
• Displays target price level with text label:
• Bullish → Green Target Line
• Bearish → Red Target Line
🧱 Inside Bar Zones
• Highlights inside bar formations (compression zones).
• Draws colored boxes between high/low of inside bar clusters.
• Marks the first and consecutive inside bars with custom bar colors.
📊 EMA Filter
• Includes a toggleable Exponential Moving Average (EMA) for confluence with trend direction.
• Customizable EMA length (default: 50).
🎨 Monochrome Mode
• Toggle between normal color mode and a clean monochrome theme for minimalistic charting setups.
⸻
🧠 How to Use
1. Identify Market Context:
Wait for a confirmed CHoCH to spot potential reversals or structure shifts.
2. Follow Order Flow:
Confirm trend direction via BoS lines and IDM zones.
3. Entry Planning:
Combine sweep detection, inside bar zones, and IDM levels for sniper entries.
4. Take Profit Zones:
Use the 1.618 target projection line to set high-probability TP levels.
5. Trend Filtering:
Use EMA direction to confirm whether to follow continuation or counter-trend setups.
⸻
🧩 Inputs & Settings
Category
Key Settings
Structure
Equal H/L toggle, HH/LL labeling, internal structure
BoS/CHoCH
Enable/disable labels, custom label size, bull/bear colors
IDM
Show previous/live IDM, label size, color options
Sweeps
Show sweep lines, X-markers, sweep line color
Bar Coloring / SCOB
Toggle bar coloring and SCOB pattern
Inside Bars
Highlight and box compression zones
1.618 Targets
Enable Fibonacci target projection
EMA
Toggle EMA and adjust length
Monochrome Mode
Apply single-color chart theme
⚠️ Notes
• This indicator is built for non-repainting structure confirmation.
• Use it on higher timeframes for swing structure or lower timeframes for IDM entry precision.
• Works best with clean price action charts (no cluttered oscillators or extra visuals).
⸻
💡 Recommended Use Cases
✅ SMC traders
✅ ICT/Order Block strategy users
✅ Liquidity and market structure traders
✅ Scalpers and swing traders using BoS/CHoCH logic
⸻
✍️ Author
Developed by PURNA SAMPATH KALUARACHCHI (PSK FX)
Smart Money Concepts researcher and price structure developer.
⸻

Real-Time Swing High/Low Detector with liquidity sweepThis script identifies the most important market structure points (swing highs/lows) and liquidity sweeps in a configurable and timeframe-adaptive manner.
By default:
It shows 5 recent swing highs and lows to keep your charts readable.
It detects and illustrates up to 3 Liquidity Sweeps (very close new highs/lows to earlier extremes).
It automatically adjusts how tight the sweep detection is based on your chart’s timeframe to balance precision and noise.
You can tweak all these numbers via the input settings panel to customize the indicator to your personal trading style and chart preferences
Configurable Parameters
Pivot Length (pivot_length)
What it does: Determines how many bars to the left and right the script looks at when identifying swing highs and lows.
Effect: Increasing this value results in fewer, more significant swings; decreasing it makes the indicator more sensitive and detects more swings.
Default: 5
Suggested: Adjust based on your trading timeframe and style to balance sensitivity and noise.
Show Labels (show_labels)
What it does: Toggles the display of swing labels such as HH, HL, LH, LL on the chart.
Effect: If enabled, the script marks swing points with their corresponding label for easier visual reference.
Default: true
Use: Turn off if you prefer a cleaner chart without textual swing indicators.
Show Current Levels (show_current_levels)
What it does: Toggles horizontal lines extending from the latest swing highs and lows.
Effect: Provides visual support/resistance zones on the chart.
Default: true
Use: Helpful for visualizing major price levels based on recent swings.
Max Swing Points (max_swings)
What it does: Limits the number of swing points stored and displayed.
Effect: Prevents chart clutter and performance issues by controlling history length.
Default: 20
Use: Increase for longer history; decrease for lighter charts.
Liquidity Sweep Threshold (liq_sweep_threshold_pc)
What it does: Defines the maximum percentage price difference allowed to consider a new high/low "very close" to the previous one, detecting a Liquidity Sweep.
Effect: Controls how sensitively the script detects these sweep points.
Default: Automatically set based on chart timeframe:
For timeframes below 1 hour: 0.05% (stricter, less tolerant)
For 1 hour and above: 0.1% (more tolerant)
Use: This dynamic setting ensures relevance of Liquidity Sweeps across different timeframes.
Liquidity Sweep Label Transparency (liq_sweep_alpha)
What it does: Controls the opacity of "Liquidity Sweep" labels, with 0 being fully opaque and 255 fully transparent.
Default: 10 (mostly opaque but slightly transparent)
Use: You can increase this value if you want the labels to be more subtle.

MC High/LowMC High/Low is a minimalist precision tool designed to show traders the most critical price levels — the High and Low of the current Day and Week — in real-time, without any visual clutter or historical trails.
It automatically tracks:
🔼 HOD – High of Day
🔽 LOD – Low of Day
📈 HOW – High of Week
📉 LOW – Low of Week
Each level is plotted using simple black horizontal lines, updated dynamically as the session evolves. Labels are clearly marked and positioned to the right of the screen for easy reference.
There’s no trailing history, no background colors, and no distractions — just pure price structure for clean confluence.
Perfect for:
Intraday scalpers
Swing traders
Liquidity & range traders
This is a tool built for sniper-level execution — straight from the MadCharts mindset.
🛠 Created by:
🔒 Version: Public Release
🎯 Use this with your favorite price action, liquidity, or market structure strategies.

Pre-London High-Low Breakout IndicatorOverview
The Pre-London High-Low Breakout Indicator helps traders identify breakout opportunities at the London session open. It marks the high and low one hour before London opens (5 PM - 6 PM AEST) and incorporates a 200 SMA filter to confirm trade direction. The indicator also provides real-time breakout markers for precise entries.
How the Indicator Works
1. Pre-London High & Low Identification (5 PM - 6 PM AEST)
The indicator tracks the highest and lowest price levels within this period.
These levels act as key breakout zones once London opens.
The high and low remain visible until 12 AM AEST for reference.
2. 200 SMA as a Trend Filter
A 200 SMA (yellow, thick line) is plotted to filter breakout trades.
Only long (buy) trades are valid if price is above the 200 SMA.
Only short (sell) trades are valid if price is below the 200 SMA.
3. Real-Time Breakout Confirmation
Buy Signal (Green Diamond):
Price breaks above the pre-London high.
Price is above the 200 SMA.
Sell Signal (Red Diamond):
Price breaks below the pre-London low.
Price is below the 200 SMA.
No signal appears if the breakout is against the SMA trend, reducing false trades.
How to Use the Indicator Properly
Step 1: Identify the Pre-London Range (5 PM - 6 PM AEST)
Observe price movements and note the session high & low.
Do not take trades within this period—wait for a clear breakout.
Step 2: Wait for a Breakout After 6 PM AEST
A breakout must occur beyond the session high or low.
The breakout should be clear and decisive, not hovering around the range.
Step 3: Confirm with the 200 SMA
If price is above the 200 SMA, only buy signals are valid.
If price is below the 200 SMA, only sell signals are valid.
If a breakout occurs against the SMA, ignore it.
Step 4: Enter the Trade and Manage Risk
Enter the trade after the breakout candle closes.
Set stop-loss just inside the pre-London range to minimize risk.
Take profit using a 1:2 or 1:3 risk-reward ratio, or trail the stop.
Why This Strategy Works
Pre-London Liquidity Grab: Institutional traders set positions before the London open, making this range significant.
Trend Confirmation with SMA: Reduces false breakouts by filtering trades in the direction of the trend.
Real-Time Breakout Detection: Green and red diamond markers highlight valid breakouts that meet all conditions.
Final Notes
If price breaks out but quickly reverses, it may be a false breakout—avoid impulsive trades.
The indicator works best when combined with other confluences such as volume analysis or key support/resistance levels.
Alerts can be added to notify traders when a valid breakout occurs.
This setup is ideal for traders looking for a structured, rule-based approach to trading London session breakouts with a strong trend confirmation mechanism.

Multi-Timeframe OHLC Levels█ OVERVIEW
A fully customizable multi-timeframe indicator that independently plots levels based on the open, previous close, previous high, previous low, and previous mid-price.
This tool is ideal for traders who require a high level of tailoring and usability.
█ FEATURES
Multi-timeframe
Select the timeframe for each level separately. The indicator shows higher timeframe levels down to the 1-second chart.
Multi-source
Choose the source for each level individually from the current open, previous close, previous high, previous low, and previous mid-price.
Past levels
Manage the number of relevant levels displayed on historical bars for trading or backtesting.
Projections
Extend the levels to the current price action with clear and clean options.
Styling
Adjust the appearance according to your preferences and screen size using options for color, line style, line thickness, custom name, and text size.
█ NOTES
This is a PREMIUM indicator.
You may also find my free Daily Weekly Monthly Yearly Opens and Previous Day Week Highs & Lows indicators helpful.

Essa - Yearly High, Low & MidYearly High, Low & Midpoint Indicator
This TradingView indicator helps traders track key yearly price levels by plotting the high, low, and midpoint values for each year within a user-specified range.
Features & Functionality:
Automatic Yearly Calculation: Determines the highest and lowest price for each year and computes the midpoint as their average.
Clear & Customisable Visuals:
The Yearly High is plotted as a solid green line.
The Yearly Low appears as a solid red line.
The Midpoint is displayed as a blue dashed line for easy distinction
Detailed Labels:
Each level is labeled at the far right of the chart, showing the year, level type (High, Low, or Mid), and price (e.g., 2016 High - 1.20000).
Labels are right-aligned in white, ensuring clear visibility against any background.
This indicator is perfect for traders who rely on long-term technical analysis, providing a quick and structured way to visualise significant yearly price levels.

CandelaCharts - Equal Highs/Lows (EQH/EQL) 📝 Overview
The Equal Highs/Lows indicator is a specialized tool for detecting equal highs and lows within price movements.
These levels hold importance as they frequently signal possible reversal zones or consolidation phases in the market. By leveraging Average True Range (ATR) thresholds, the indicator employs tailored settings to pinpoint these critical price levels with precision.
Visual Markings: Lines and labels highlight equal highs and lows directly on the chart.
Dynamic Adaptability: It adjusts in real time to market volatility, ensuring accurate level identification through ATR-based thresholds.
Equal Highs are not used as entry and exit points; instead, they are used as confirmation that the current market trend will reverse. This means that when an EQH is formed on a chart, traders can adapt a bearish bias and look for only short entries.
📦 Features
Key features of the indicator include:
Visual Markings: Lines and labels highlight equal highs and lows directly on the chart.
Dynamic Adaptability: It adjusts in real time to market volatility, ensuring accurate level identification through ATR-based thresholds.
Styling
⚙️ Settings
Show: Controls whether EQH/EQL are displayed on the chart.
Line Style: Controls the line type and line width
Bullish Color: Color of the bullish EQH/EQL
Bearish Color: Color of the bearish EQH/EQL
⚡️ Showcase
Short Term
Intermediate Term
Long Term
🚨 Alerts
This script provides alert options for all signals.
Bearish Signal
A bearish signal is triggered when the price forms an EQH.
Bullish Signal
A bullish signal is triggered when the price forms an EQL.
⚠️ Disclaimer
Trading involves significant risk, and many participants may incur losses. The content on this site is not intended as financial advice and should not be interpreted as such. Decisions to buy, sell, hold, or trade securities, commodities, or other financial instruments carry inherent risks and are best made with guidance from qualified financial professionals. Past performance is not indicative of future results.

Gann High LowGann High Low is a moving average based trend indicator consisting of two different simple moving averages.
The Gann High Low Activator Indicator was described by Robert Krausz in a 1998 issue of Stocks & Commodities Magazine. It is a simple moving average SMA of the previous n period's highs or lows.
The indicator tracks both curves (of the highs and the lows). The close of the bar defines which of the two gets plotted.
This version is showing the channel that needs to be broken if the trend is going to be changed, and it allows you to chose from the 4 basic averages type for calculation (by definition, Gann High Low Activator uses only simple moving average, but some other averages can give you results that are probably more acceptable for trading in some conditions).
Increasing HPeriod and decreasing LPeriod better for short trades, vice versa for long positions.

Swing Pivots - Market Structure High Low [zazenio]What is Market Structure?
Market structure is simply the pattern of highs and lows that price creates as it moves. When you look at any chart, you'll notice price doesn't move in a straight line — it swings up, pulls back, swings up again (in an uptrend), or the opposite in a downtrend.
These swing points — the peaks and valleys — are what traders call pivots. Identifying them correctly is the foundation of understanding where a market has been and where it might go next.
What This Indicator Does
Swing Pivots automatically marks these peaks and valleys on your chart so you don't have to draw them manually. It works on any market — stocks, crypto, forex, futures, indices — and on any timeframe.
How Pivots Are Detected
This indicator confirms pivots based on price structure, not a fixed bar count.
Here's how it works:
A swing high is confirmed when price breaks below the previous swing low. At that moment, we know the high was real — price tried to go higher, failed, and reversed. The market "proved" that level was a genuine turning point.
A swing low is confirmed when price breaks above the previous swing high. The same logic applies — price tried to go lower, failed, and reversed direction.
This creates a natural alternation: high, low, high, low. Each pivot is validated by the market's actual behavior, not by waiting for an arbitrary number of bars to pass.
Why This Matters
Most pivot indicators use a "lookback" method — they wait for a certain number of bars (say, 5 or 10) on each side of a candle before confirming it as a pivot. This creates a fixed delay. By the time the pivot appears on your chart, price has already moved on.
This indicator doesn't wait. It confirms pivots the moment price structure proves them. The result is pivots that align with how traders actually read charts — based on breaks of structure, not arbitrary countdowns.
Settings
Swing Width: Controls how sensitive the detection is. Higher numbers show only major swings; lower numbers capture smaller moves within the structure.
Style/Size/Colors: Customize how the pivot markers look on your chart.
Use Cases
See the "skeleton" of price action at a glance
Identify potential support and resistance levels
Understand if the market is trending or ranging
Build a foundation for more advanced concepts like Break of Structure (BOS) and Change of Character (CHoCH)
⸻
Disclaimer:
This script is provided for educational and informational purposes only. It is not financial advice and does not constitute a recommendation to buy or sell any financial instrument. Always do your own research and trade at your own risk.

NoProcess Prior Month/Week/Day High/Low/EQ Prior Period Levels
Plots key support/resistance levels from previous timeframes: Day, Week, and Month.
Levels Displayed:
PDH/PDL/PDE — Prior Day High, Low, and Equilibrium (midpoint)
PWH/PWL/PWE — Prior Week High, Low, and Equilibrium
PMH/PML/PME — Prior Month High, Low, and Equilibrium
Features:
Toggle each timeframe independently
Single color control for clean chart aesthetics
Configurable right extension (1-50 bars)
Dotted line style with labels positioned at line endpoints
Use Case:
Reference levels for institutional order flow concepts. Prior period highs/lows act as liquidity pools; equilibriums mark fair value zones where price often rebalances. Works on any instrument and timeframe.

DarkPool's Gann High Low Activator DarkPool's Gann High-Low Activator.
It enhances the traditional trend-following logic by integrating Heikin Ashi smoothing, Multi-Timeframe (MTF) analysis, and volatility filtering. It is designed to filter out market noise and provide clearer trend signals during volatile conditions.
Underlying Concepts
Heikin Ashi Smoothing: Standard price candles can produce erratic signals due to wicks and short-term volatility. This script includes a "Calculation Mode" setting that allows the Gann logic to run on Heikin Ashi average prices. This smoothes out price data, helping traders stay in trends longer by ignoring temporary pullbacks.
Gann High-Low Logic: The core algorithm tracks the Simple Moving Average (SMA) of Highs and Lows over a user-defined period.
Bullish Trend: Price closes above the trailing SMA of Highs.
Bearish Trend: Price closes below the trailing SMA of Lows.
Volatility & Trend Filtering: To reduce false signals during sideways markets, this tool employs two filters:
ADX Filter (Choppiness): Uses the Average Directional Index to detect low-volatility environments. If the ADX is below the defined threshold (default 20), the indicator identifies the market as "choppy" and suppresses signals to preserve capital.
EMA Filter (Baseline): An optional Exponential Moving Average filter ensures trades are only taken in the direction of the longer-term trend (e.g., Longs only above the 200 EMA).
Features
Dual Calculation Modes: Switch between Standard price logic and Heikin Ashi smoothing logic.
Multi-Timeframe (MTF): Calculate the trend based on a higher timeframe (e.g., 4-Hour) while viewing a lower timeframe chart (e.g., 15-Minute).
Automated JSON Alerts: Generates machine-readable JSON alert payloads compatible with external trading bots and webhooks.
Live Dashboard: A data table displaying the current Trend State, Calculation Mode, ADX Value, and risk percentage.
How to Use
Buy Signal: Generated when the trend flips Bullish, provided the ADX indicates sufficient momentum and the price satisfies the EMA filter (if enabled).
Sell Signal: Generated when the trend flips Bearish, subject to the same momentum and trend filters.
Neutral State (Gray Cloud): When the cloud fill turns gray, the market is in consolidation. It is recommended to avoid entering new positions during this state.
Trailing Stop: The Gann Line serves as a dynamic trailing stop-loss level. A close beyond this line invalidates the current trend.
Settings Configuration
Calculation Mode: Select "Standard" for raw price action or "Heikin Ashi" for smoothed trend following.
Gann Length: Lower values (3-5) are suitable for short-term scalping; higher values (10+) are better for swing trading.
MTF Mode: Enable to lock the calculation to a specific higher timeframe.
ADX Threshold: Adjust based on asset volatility. Recommended: 20-25 for Crypto, 15-20 for Forex/Indices.
Disclaimer
This source code and the information presented here are for educational purposes only. This script does not constitute financial advice, trading recommendations, or a solicitation to buy or sell any financial instruments. Trading in financial markets involves a high degree of risk and may not be suitable for all investors. Past performance is not indicative of future results. The author assumes no responsibility for any losses incurred while using this indicator. Use this tool at your own discretion and risk.

HTF High/Low Dashboard (Year→Month→Week→Day→4H) by MacphelixTake your multi-timeframe analysis to the next level with the HTF High/Low Dashboard. This indicator provides a clear, intuitive overview of whether the previous high and low levels of key higher timeframes (Yearly, Monthly, Weekly, Daily, and 4H) have been taken or not.
Features:
✅ Multi-Timeframe Coverage: Yearly, Monthly, Weekly, Daily, and 4H levels.
✅ Dashboard Display: Shows a clear YES/NO indicator for each timeframe, so you instantly know which levels are taken.
✅ User Toggles: Turn on/off each timeframe in the dashboard individually .
✅ Alerts: Optional alerts for when any HTF high or low is taken.
✅ Customizable: Adjust dashboard position to suit your trading style.
How It Works:
The script checks each higher timeframe’s previous candle to see if its high or low has been surpassed by the current price.
A YES in the dashboard means the level has been taken; NO means it hasn’t.

Session High/Low by BKMarks all session highs and lows
Asia High/Low
London High/Low
New York High/Low

Pivot Points High Low Multi Time Frame + AlertsThis script is a modified version of “Pivot Points High Low Multi Time Frame” for TradingView, enhanced with price alerts when the market reaches or crosses recent pivot levels.
What it does:
Detects Pivot Highs and Pivot Lows based on your chosen timeframe and bar settings.
Draws visual lines and labels at each pivot level for clear identification.
Keeps track of the latest pivot high and low values.
Triggers an alert condition when the price crosses either of those pivots.
Alert conditions included:
🔔 Price Crossed Pivot High — notifies when the price touches or moves above the last pivot high.
🔔 Price Crossed Pivot Low — notifies when the price touches or moves below the last pivot low.
How to use:
Add the script to your chart in TradingView.
Click the Alarm (🔔) icon → choose Add Alert.
Under Condition, select this indicator and pick one of the two alert types.
Choose your preferred alert frequency (Once per bar, Every time, etc.).
Tip: You can also visually see when alerts are triggered — small green and red triangles will appear above or below the bars where the price crosses a pivot.

Pivots High Low Live DetectionPivots High Low Live Detection
Identifies and visualizes swing highs and lows on the chart in real time.
Helps to observe evolving market structure by connecting confirmed or developing pivot points with lines and labels.
Using a configurable lookback, minimum deviation, and confirmation bar system, the indicator highlights new Higher Highs (HH), Higher Lows (HL), Lower Highs (LH), and Lower Lows (LL) as they form.
When “Live (repainting)” mode is enabled, the current swing leg updates dynamically with each candle, giving immediate feedback as price develops.
When disabled, only confirmed pivots are plotted, ideal for historical validation and backtesting.
+ Key Features
Detects and labels major swing points (HH, HL, LH, LL).
Works in live or confirmed (non-repainting) mode.
Adjustable parameters for lookback, deviation (in ticks), and confirmation bars.
Lightweight and compatible with any timeframe or symbol.
Includes runtime alerts for new structural pivots and direction shifts.
+ How to Use
Adjust the inputs under the “Pivots” group to control sensitivity.
Enable “Live (repainting)” to see developing swing legs, or disable it for confirmed structure only.
Use alerts to track structural changes or potential trend reversals.

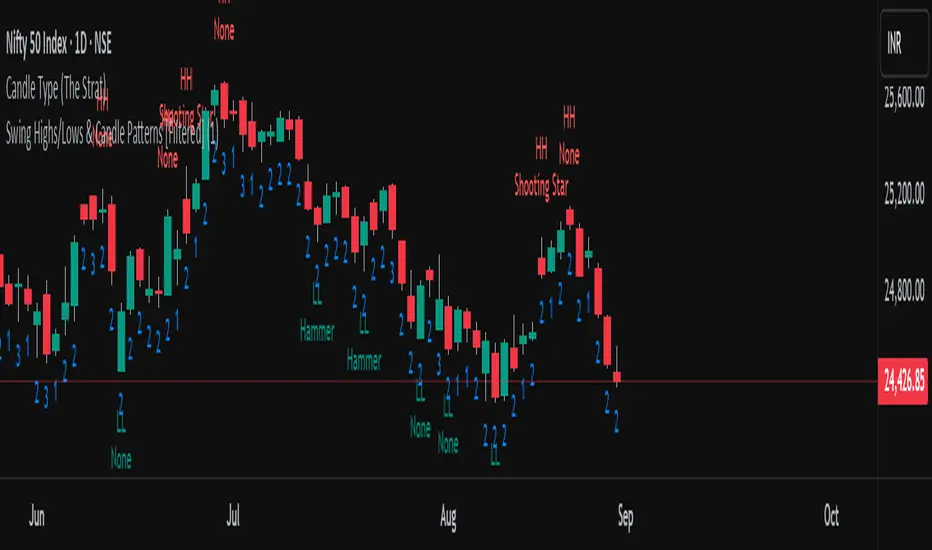
Swing Highs/Lows & Candle Patterns[LuxAlgo] [Filtered]Swing Highs/Lows & Candle Patterns - Tweaked Version
This indicator is a customized and enhanced version of LuxAlgo’s original Swing Highs/Lows & Candle Patterns indicator. It identifies and labels critical swing high and swing low points to help visualize market structure, alongside detecting key reversal candlestick patterns such as Hammer, Inverted Hammer, Bullish Engulfing, Hanging Man, Shooting Star, and Bearish Engulfing.
With added options to selectively display only Lower Highs (LH) and Higher Lows (HL), this tweaked version offers greater flexibility for traders focusing on specific market dynamics. Users can also customize the lookback length and label styling to fit their preferences.
Credit to LuxAlgo for the original concept and foundation of this powerful tool, which this script builds upon to support more tailored technical analysis. Ideal for swing traders and technical analysts seeking improved entry and exit signals through a combination of price swings and candlestick pattern recognition.
Hitu - MTF High/Low Marker
This indicator is a powerful tool for traders, designed to display the high and low levels from multiple significant timeframes directly on your chart. It helps you quickly identify key support, resistance, and liquidity levels at a glance, improving your understanding of the market structure.
Key Features:
* Multi-Timeframe Support: Visualize high and low levels from Monthly, Weekly, Daily, 4H, 1H, 15M, and 5M timeframes.
* Full Customization: Each timeframe's line can be customized with your preferred color and style (Solid, Dashed, or Dotted) directly from the settings.
* Toggle On/Off: You have complete control to enable or disable any timeframe level to match your specific trading strategy.
How It Helps:
The MTF High/Low Marker simplifies the process of finding crucial price zones. By seeing key highs and lows from higher timeframes on your current chart, you can make more informed decisions about your entries, exits, and overall risk management.
All-Time High/Low Levels with Dynamic Price Zones📈 All-Time High/Low Levels with Dynamic Price Zones — AlertBlake
🧠 Overview:
This powerful indicator automatically identifies and draws the All-Time High (AT.H) and All-Time Low (AT.L) on your chart, providing a clear visual framework for price action analysis. It also calculates and displays the Midpoint (50%), Upper Quartile (75%), and Lower Quartile (25%) levels, creating a dynamic grid that helps traders pinpoint key psychological levels, support/resistance zones, and potential breakout or reversal areas.
✨ Features:
Auto-Detection of All-Time High and Low:
Tracks the highest and lowest prices in the full visible historical range of the chart.
Automatically updates as new highs or lows are created.
Dynamic Level Calculation:
Midpoint (50%): Halfway between AT.H and AT.L.
25% Level: 25% between AT.L and AT.H.
75% Level: 75% between AT.L and AT.H.
Each level is clearly labeled with its corresponding value.
Labels are positioned to the right of the price for easy reading.
Color-Coded Lines (customizable)

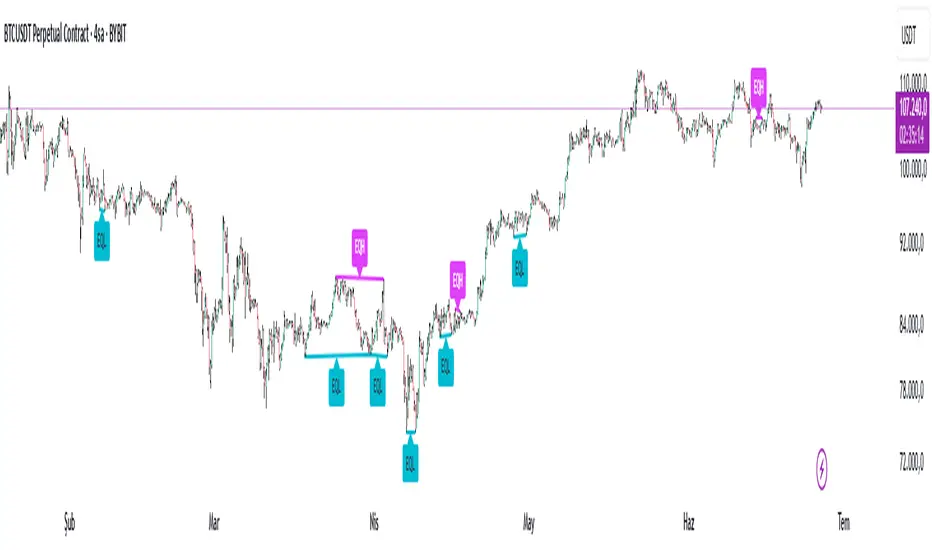
Equal High Low Detector v2.0✅ Equal High Low Detector – Description
This script detects and visualizes Equal Highs (EQH) and Equal Lows (EQL) using multiple user-defined pivot lengths. The indicator compares swing highs and lows based on ATR-based tolerance, identifying price levels that may represent liquidity zones, potential reversals, or breakout traps.
🔹 Uses ATR × tolerance to determine "equal" zones
🔹 Plots dynamic lines and labels for EQH/EQL zones
🔹 Automatically deletes older lines to reduce clutter
🔹 Useful for identifying areas of liquidity, stop hunts, or fakeouts
How it works:
For each active pivot setting, the script checks if the current pivot high/low is within a customizable range (using ATR) of the previous one. If they match within that threshold, it draws a line between the two points and marks the midpoint with a label.
This tool is especially helpful for traders focusing on liquidity engineering, market structure, and price action based strategies.
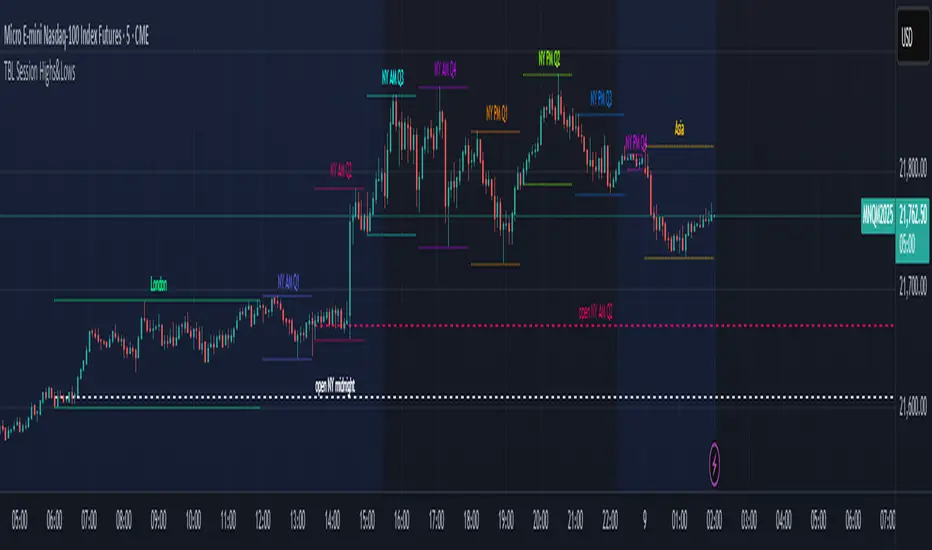
TBL Session Highs&LowsBL Session Highs&Lows is a versatile intraday tool that highlights key price levels within up to 11 configurable trading sessions. It displays session highs, lows, and optional open levels, with customizable lines, labels, and boxes — perfect for tracking price behavior across sessions like Asia, London, and New York.
🔧 Key Features
🧩 Up to 11 fully customizable sessions
📍 High, Low, and Open lines with adjustable color, style, and width
🧱 Optional boxes showing session range, dynamically colored based on price movement
🏷️ Session labels for visual orientation
🔁 Extendable lines to project levels beyond the session
🌐 Custom time zone support for each session
🎨 Fully customizable visuals for clear chart integration
📈 Designed for:
Intraday session tracking (e.g., Asia, London, NY)
Session-based strategies (breakouts, reversals, liquidity zones)
Open-level reference (e.g., NY open)
Visual separation of trading periods
Example Scenarios:
🟦 "Asia" session: 18:00–00:00 GMT-4 with full box and lines
🟩 "London" session: 00:00–06:00 with high/low lines only
🟥 Segmented NY sessions (Q1–Q4) for fine-grained intraday tracking
✅ Tip: Enable only the sessions you need to keep your chart clean and focused.
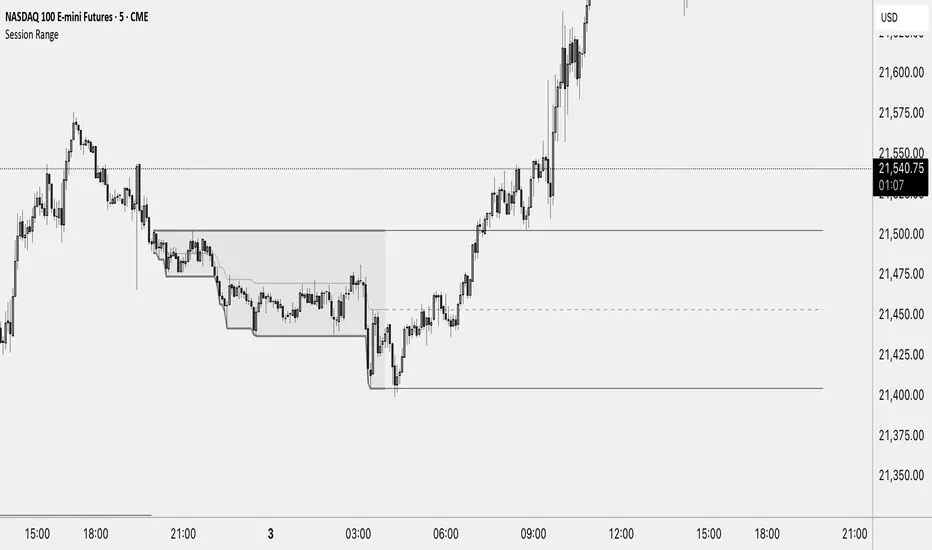
Session RangeThis Indicator Shows you the high, low and the midpoint for a chosen session and displays them on the chart.
You can make the following inputs:
Timezone: Choose your time zone (in UTC) to display the session correctly
Session Time: Choose the start time and end time of the session you want to have displayed.
Show Session Midpoint: Choose between displaying or not displaying the midpoint of the sessions high and low.
Extend Session Values until next Session: Choose this option if you want to display the sessions range until the next session starts. The midpoint will only be displayed if you chose "yes" at "Show Session Midpoint?"
Maximum number of bars between sessions: This is needed to ensure the correct display of the extended lines. Also this will affect the running speed of the script.
Limitations:
A higher number between bars slows down the script. What does that mean practically? If you choose to not have the sessions values displayed until the next session you can set this to 1 and the script will run as fast as it can. If you choose to display all the values until the next session you have to make sure that the number you put in is higher than the number of bars between the sessions. Otherwise the lines will be displayed backwards. As this affects the calculation speed you want to keep the number as low as possible. The default setting is 300 which is fine for 5 minute charts. On a 1 minute chart you will have to use something around 5000 depending on how long your session is.
Also the script will only run correctly if the start time of your session can be divided by the timeframe you are using. Example: you can use a 1min, 3min, 5min, or 15min chart on all sessions as they can only start every 15 minutes and 15 can be divided by all these numbers. A 2 minute timeframe will only work on sessions that start at minute 00 or 30, as 15 and 45 can not be divided by 2.
Customization and Alerts:
You can change the color of the sessions high, low, midpoint and background filling. The line style can also be changed but this might lead to a faulty display of the session.
The style of the extension lines can not be altered.
Alerts can be added for crossing the sessions high or low (after the session is finished). You do not have to display the extension lines in order to set an alert.
credit: The inspiration (especially for the look of this indicator) comes from the Asian Range by Nico948 indicator.
FeraTrading Sessions High/LowThe FeraTradiang Sessions High/Low Indicator plots precise high and low levels for the New York, London, and Asian trading sessions — without any clutter.
We designed this tool for simplicity, clarity and accuracy, automatically adjusting to any timeframe and time zone — no manual setup required.
🔍 Key Features:
Clean horizontal lines marking session highs and lows
Lines start at the actual high/low
Session times:
New York: 09:30 – 17:00
London: 03:00 – 08:00
Asian: 18:00 – 03:00
Real-time updates that trail live candles
Only shows the most relevant sessions:
Yesterday’s NY
Last night’s Asia + morning continuation
Today’s London
Fully customizable:
Session colors
Session toggles
Label toggles
Line extension settings
Enable extended trading hours on your chart for best results.
Whether you're trading futures, forex, or crypto, this indicator provides clean session context without the mess. Open-source for extra customization and designed for real-time usability.
