Cari dalam skrip untuk "high low"

High Low BandsIt is just a high-low band. I published it because I could not find something good.
ただのハイローバンドです。何故か良いのが見つからないので公開しました。

high/low timeframehere is a high/low type trend indicator that will work until aug good buys are between green lines and sells are between red lines

Single Prints and Poor Highs/Lows [Real-Time]This indicator is designed for traders utilizing Auction Market Theory (AMT) who need real-time visibility into market structure inefficiencies. Unlike standard TPO tools that often wait for closed bars or finished sessions, this script builds a developing TPO profile tick-by-tick to identify Single Prints and Poor Highs/Lows the moment they form.
Key Features:
Real-Time Single Prints: Automatically detects and highlights areas of single-print inefficiencies (buying/selling tails) as they happen. These "ghost" boxes persist on the chart until price repairs (fills) them, acting as immediate targets or support/resistance zones.
Poor High/Low Detection: Strictly implements AMT logic to identify "unfinished" auctions. If a session extreme is formed by two or more TPO blocks (indicating a flat top/bottom rather than a rejection tail), it marks the level with a dotted line.
Repair Logic: Both Single Prints and Poor High/Low lines are dynamic. If price revisits and repairs the structure, the markers automatically vanish to keep your chart clean.
Session Control: Fully customizable RTH (Regular Trading Hours) session input (default 08:30–15:15) to ensure profiles are built on relevant liquidity.
Quantization: Adjustable "Ticks per Block" allowing you to tune the sensitivity of the TPO profile to different assets (ES, NQ, CL, etc.).
How It Works:
TPO Construction: The script breaks the session into 30-minute periods (configurable) and tracks price overlap.
Single Prints: When the market expands rapidly, leaving gaps in the profile (single TPO blocks), a box is drawn. If price trades back through this box, it deletes itself.
Poor Extremes: It monitors the current session High and Low. If the extreme price level has a TPO count of ≥ 2, it is flagged as "Poor." If the extreme is a single print (count = 1), it is considered a valid tail and left unmarked.
Settings:
RTH Session: Define your specific trading session time.
TPO Period: Default is 30 minutes (standard AMT).
Ticks per Block: Controls the vertical resolution of the TPO. (Higher values = coarser profile, Lower values = more precision).
Colors: Fully customizable colors for Live Prints, Historical Prints, and Poor High/Low lines.
Usage:
Use this tool to spot immediate structural targets. A Poor High often acts as a magnet for price to revisit and "repair," while Single Prints often defend as support/resistance on the first retest.
AR-Session-Orb-HTF High/LowThis indicator is built for intraday model execution around liquidity grabs, session timing, and higher-timeframe draw-on-liquidity. It maps out sessions, ICT killzones, Session opening ranges (including the US 09:30 cash open), a daily NY “TD Open” line (00:00 → NY close), and key highs/lows from higher timeframes directly onto any lower timeframe chart (down to 1 minute).
________________________________________
1. Sessions (Asia / London / New York)
• Highlights the 3 main sessions with colored boxes:
• Asia
• London
• New York
• Default session times are set in New York local time:
• Asia: 18:00–02:00
• London: 03:00–12:00
• New York: 08:00–17:00
• You can change these times in the settings.
• Each box automatically expands as the session progresses.
Why it matters: these windows show you where liquidity usually builds, where the day “hands off” from Asia → London → NY, and when expansion/displacement typically happens.
________________________________________
2. ICT Killzones
The script includes 4 configurable killzones (NY local by default):
• Asia late session: 20:00–00:00
• London killzone: 02:00–05:00
• New York AM: 07:00–10:00
• New York Midday: 10:00–12:00
For each killzone you can:
• toggle on/off
• adjust the time window
• pick colors
This makes it easy to see when price is trading inside a high-probability delivery period, so you can line it up with liquidity above/below the session or OR.
________________________________________
3. Opening Range Levels
The indicator captures the high and low of the first X minutes (default 15) of each important window and projects those levels as horizontal lines.
It does this for:
• Asia Open Range
• London Open Range
• New York Open Range (08:00)
• NY 09:30 Cash-Open Range
• (in the original idea: NY mid / second NY window)
Behavior:
• Asia OR → after the first X minutes of Asia, the high/low are projected across the rest of the trading day.
• London OR → taken from the London start, but extended only while London is active.
• NY OR (08:00) → taken from the start of the NY session and extended only during NY.
• NY 09:30 OR → this one is special. At exactly 09:30 (cash open) the script starts a second, independent OR for that day, using your chosen length (e.g. 15 minutes). When the window finishes, it freezes the 09:30 high and low and projects them horizontally all the way to the NY session end. You can style it separately (color, labels). This gives you a clean “cash-open dealing range” to watch for sweeps, fake-outs and continuations.
You can:
• choose the range length (1–60 minutes for 09:30, 1–30 for the others)
• show/hide each OR
• color each OR
• show labels such as “Asia OR High”, “Lon OR Low”, “NY 09:30 High”, etc.
• control line padding so labels don’t print on top of the candle
These ORs often become obvious liquidity pools, fail-break zones, or continuation triggers.
________________________________________
4. NY TD Open Line (Daily 00:00)
On every trading day the script also plots a “TD” structure for New York:
• at 00:00 NY time it draws a vertical dashed line to mark the day’s start
• it records that day’s open price
• it then projects a horizontal line from 00:00 → all the way to NY session close (default 17:00)
• the horizontal line is labeled e.g. “NY TD Open”
How to use it:
• see instantly where current price is vs the daily open
• combine with 09:30 OR to know if cash open is opening above/below the day’s open
• good for intraday bias (above = bullish day structure, below = bearish day structure)
• nice anchor when you go down to 1m/3m
You can toggle the TD feature on/off and change its colors.
________________________________________
5. Previous Week High / Low
• Plots last week’s high and low on any timeframe
• Drawn as dashed lines with padding (so they don’t run to infinity)
• Each level is labeled (default “PW High” / “PW Low”)
These are classic weekly liquidity magnets and very useful when London/NY is expanding into an old weekly extreme.
________________________________________
6. Monthly High / Low
The script plots both:
• Previous month high/low
• Current month high/low (live)
Defaults:
• previous month → dashed + purple
• current month → solid + blue
You can change:
• line colors
• label text & colors
• how far the line should extend (bars span)
This gives you higher-TF liquidity targets on your intraday chart without switching to M or W.
________________________________________
7. 4H High / Low (Intra-session Liquidity Map)
On timeframes up to 4H, the script also plots:
• previous 4H high/low
• current 4H high/low
Important design choice: they only live inside their own 4H window.
• the previous 4H range is shown only over the previous 4H time span
• the current 4H range is shown only over the current 4H candle
That means you don’t get messy, stretched 4H lines across the whole day — only where they actually apply. This is super useful for London/NY raids on 4H highs/lows.
________________________________________
8. Customization / Inputs
Almost everything is editable:
• session windows + colors
• killzone windows + colors
• opening-range length
• ON/OFF per OR (Asia, London, NY 08:00, NY 09:30)
• label text, size, bg color, text color
• HTF line length (weekly / monthly)
• TD 00:00 ON/OFF + colors
• line end padding so labels don’t sit on the right edge
The idea is to give you structure, not signals.
________________________________________
How to Use
1. Start from the monthly / weekly / previous week levels to see where price “wants” to go.
2. Drop into the active session box / killzone to know when to pay attention.
3. Trade around opening-range highs/lows — especially the NY 09:30 OR — and look for liquidity sweeps.
4. Check where price is relative to the NY TD Open (00:00) to confirm intraday bias.
5. Refine entries using the 4H highs/lows that fall inside that session.
Result: you get a top-down liquidity map + intraday timing tool, all on one chart.
________________________________________
Notes
• All times are interpreted in the chart/session timezone — keep your chart on NY session if you want the defaults to match the description.
• TradingView has drawing limits; on very low timeframes far back in history, old drawings may recycle.
• Because 09:30 and TD are drawn every day, it’s normal to see more labels the further right you scroll.
________________________________________
Disclaimer
This script is for educational and charting purposes only.
It does not generate trade signals, manage risk, or guarantee profitability.
Trading involves risk — always do your own analysis.
Special Thanks to Sabo & Hive Community
Nov 17
Release Notes
This indicator is built for intraday model execution around liquidity grabs, session timing, and higher-timeframe draw-on-liquidity. It maps out sessions, killzones, opening ranges (including the US 09:30 cash open), a daily NY “TD Open” line (00:00 → NY close), and key highs/lows from higher timeframes directly onto any lower timeframe chart (down to 1 minute).
________________________________________
1. Sessions (Asia / London / New York)
• Highlights the 3 main sessions with colored boxes:
• Asia
• London
• New York
• Default session times are set in New York local time:
• Asia: 18:00–02:00
• London: 03:00–12:00
• New York: 08:00–17:00
• You can change these times in the settings.
• Each box automatically expands as the session progresses.
Why it matters: these windows show you where liquidity usually builds, where the day “hands off” from Asia → London → NY, and when expansion/displacement typically happens.
________________________________________
2. ICT Killzones
The script includes 4 configurable killzones (NY local by default):
• Asia late session: 20:00–00:00
• London killzone: 02:00–05:00
• New York AM: 07:00–10:00
• New York Midday: 10:00–12:00
For each killzone you can:
• toggle on/off
• adjust the time window
• pick colors
This makes it easy to see when price is trading inside a high-probability delivery period, so you can line it up with liquidity above/below the session or OR.
________________________________________
3. Opening Range Levels
The indicator captures the high and low of the first X minutes (default 15) of each important window and projects those levels as horizontal lines.
It does this for:
• Asia Open Range
• London Open Range
• New York Open Range (08:00)
• NY 09:30 Cash-Open Range
• (in the original idea: NY mid / second NY window)
Behavior:
• Asia OR → after the first X minutes of Asia, the high/low are projected across the rest of the trading day.
• London OR → taken from the London start, but extended only while London is active.
• NY OR (08:00) → taken from the start of the NY session and extended only during NY.
• NY 09:30 OR → this one is special. At exactly 09:30 (cash open) the script starts a second, independent OR for that day, using your chosen length (e.g. 15 minutes). When the window finishes, it freezes the 09:30 high and low and projects them horizontally all the way to the NY session end. You can style it separately (color, labels). This gives you a clean “cash-open dealing range” to watch for sweeps, fake-outs and continuations.
You can:
• choose the range length (1–60 minutes for 09:30, 1–30 for the others)
• show/hide each OR
• color each OR
• show labels such as “Asia OR High”, “Lon OR Low”, “NY 09:30 High”, etc.
• control line padding so labels don’t print on top of the candle
These ORs often become obvious liquidity pools, fail-break zones, or continuation triggers.
________________________________________
4. NY TD Open Line (Daily 00:00)
On every trading day the script also plots a “TD” structure for New York:
• at 00:00 NY time it draws a vertical dashed line to mark the day’s start
• it records that day’s open price
• it then projects a horizontal line from 00:00 → all the way to NY session close (default 17:00)
• the horizontal line is labeled e.g. “NY TD Open”
How to use it:
• see instantly where current price is vs the daily open
• combine with 09:30 OR to know if cash open is opening above/below the day’s open
• good for intraday bias (above = bullish day structure, below = bearish day structure)
• nice anchor when you go down to 1m/3m
You can toggle the TD feature on/off and change its colors.
________________________________________
5. Previous Week High / Low
• Plots last week’s high and low on any timeframe
• Drawn as dashed lines with padding (so they don’t run to infinity)
• Each level is labeled (default “PW High” / “PW Low”)
These are classic weekly liquidity magnets and very useful when London/NY is expanding into an old weekly extreme.
________________________________________
6. Monthly High / Low
The script plots both:
• Previous month high/low
• Current month high/low (live)
Defaults:
• previous month → dashed + purple
• current month → solid + blue
You can change:
• line colors
• label text & colors
• how far the line should extend (bars span)
This gives you higher-TF liquidity targets on your intraday chart without switching to M or W.
________________________________________
7. 4H High / Low (Intra-session Liquidity Map)
On timeframes up to 4H, the script also plots:
• previous 4H high/low
• current 4H high/low
Important design choice: they only live inside their own 4H window.
• the previous 4H range is shown only over the previous 4H time span
• the current 4H range is shown only over the current 4H candle
That means you don’t get messy, stretched 4H lines across the whole day — only where they actually apply. This is super useful for London/NY raids on 4H highs/lows.
________________________________________
8. Customization / Inputs
Almost everything is editable:
• session windows + colors
• killzone windows + colors
• opening-range length
• ON/OFF per OR (Asia, London, NY 08:00, NY 09:30)
• label text, size, bg color, text color
• HTF line length (weekly / monthly)
• TD 00:00 ON/OFF + colors
• line end padding so labels don’t sit on the right edge
The idea is to give you structure, not signals.
________________________________________
How to Use
1. Start from the monthly / weekly / previous week levels to see where price “wants” to go.
2. Drop into the active session box / killzone to know when to pay attention.
3. Trade around opening-range highs/lows — especially the NY 09:30 OR — and look for liquidity sweeps.
4. Check where price is relative to the NY TD Open (00:00) to confirm intraday bias.
5. Refine entries using the 4H highs/lows that fall inside that session.
Result: you get a top-down liquidity map + intraday timing tool, all on one chart.
________________________________________
Notes
• All times are interpreted in the chart/session timezone — keep your chart on NY session if you want the defaults to match the description.
• TradingView has drawing limits; on very low timeframes far back in history, old drawings may recycle.
• Because 09:30 and TD are drawn every day, it’s normal to see more labels the further right you scroll.
________________________________________
Disclaimer
This script is for educational and charting purposes only.
It does not generate trade signals, manage risk, or guarantee profitability.
Trading involves risk — always do your own analysis.
Special Thanks to Sabo & Hive Community

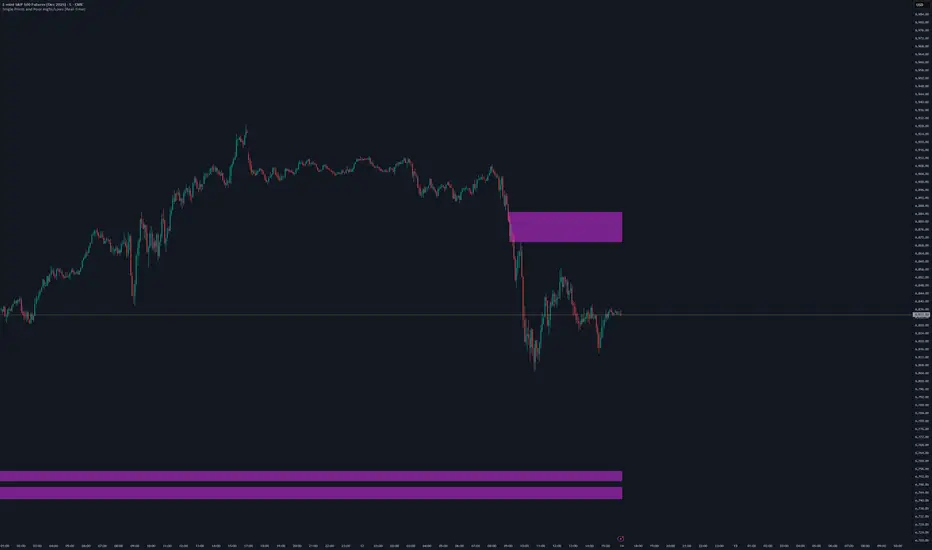
Session High-Low Box,
Session High-Low Box Session High-Low Box indicatorSession High-Low BoxSession High-Low BoxSession High-Low BoxSession High-Low BoxSession High-Low BoxSession High-Low BoxSession High-Low BoxSession High-Low BoxSession High-Low BoxSession High-Low BoxSession High-Low BoxSession High-Low BoxSession High-Low BoxSession High-Low BoxSession High-Low BoxSession High-Low BoxSession High-Low BoxSession High-Low BoxSession High-Low BoxSession High-Low BoxSession High-Low BoxSession High-Low Boxwrtvtrvwrtv4v2tr2Session High-Low Box24v2v2Session High-Low Box
Smart High low Pivot Points
## Description
The **Pivot High Low Indicator** is a powerful technical analysis tool designed to automatically identify and highlight significant pivot points in price action. This indicator marks crucial reversal zones where price has formed local peaks (pivot highs) and troughs (pivot lows), helping traders spot potential support/resistance levels and trend reversal points.
The indicator features intelligent price formatting that adapts to any market - from crypto tokens to large-cap stocks - displaying values in readable formats (M/B/T notation for large numbers, precise decimals for small values).
---
## Key Features
### 🎯 **Dual Pivot Detection System**
- **Pivot Highs**: Automatically identifies local price peaks where price is higher than surrounding bars
- **Pivot Lows**: Detects local price bottoms where price is lower than surrounding bars
- Independent left/right length settings for each pivot type
### 🎨 **Fully Customizable Appearance**
- Separate color controls for pivot high and low labels
- Custom text colors for optimal visibility
- Distinct label background colors (default: green for highs, red for lows)
- Clean, non-intrusive chart overlay
### ⚙️ **Flexible Configuration**
- Adjustable left/right bar lengths for sensitivity control
- Independent settings for highs and lows
- Real-time adaptation to market conditions
---
## Benefits
✅ **Identify Key Support & Resistance Levels** - Pivot points often act as important price levels where reversals occur
✅ **Spot Trend Reversals Early** - Recognize when momentum shifts from bullish to bearish or vice versa
✅ **Enhanced Market Structure Analysis** - Understand swing highs and lows for better trade timing
✅ **Works Across All Markets** - Optimized for stocks, forex, crypto, commodities, and indices
✅ **Clean Visual Presentation** - Labeled price points directly on chart without clutter
✅ **Universal Price Display** - Automatically formats prices for readability regardless of asset value
## Settings Available
### **LENGTH LEFT / RIGHT**
| Setting | Default | Min | Description |
|---------|---------|-----|-------------|
| **Pivot High - Left** | 15 | 1 | Number of bars to the left that must be lower than the pivot high |
| **Pivot High - Right** | 15 | 1 | Number of bars to the right that must be lower than the pivot high |
| **Pivot Low - Left** | 7 | 1 | Number of bars to the left that must be higher than the pivot low |
| **Pivot Low - Right** | 7 | 1 | Number of bars to the right that must be higher than the pivot low |
**💡 Tip**: Higher values = fewer, more significant pivots. Lower values = more frequent, minor pivots.
### **TEXT COLOR / LABEL COLOR**
| Setting | Default | Description |
|---------|---------|-------------|
| **Pivot High - Text Color** | White | Color of the price text on pivot high labels |
| **Pivot High - Label Color** | Green (#005703) | Background color of pivot high labels |
| **Pivot Low - Text Color** | White | Color of the price text on pivot low labels |
| **Pivot Low - Label Color** | Red (#7b0000) | Background color of pivot low labels |
## Use Cases
- 📈 **Swing Trading**: Identify swing high/low entry and exit points
- 🎯 **Support/Resistance**: Mark key levels for limit orders
- 📊 **Market Structure**: Analyze higher highs/higher lows or lower highs/lower lows
- ⚡ **Breakout Trading**: Spot when price breaks above pivot highs or below pivot lows
- 🔄 **Reversal Trading**: Enter trades at confirmed pivot points

TR FVG & Swing High Low FinderTR FVG & Swing Level Finder
Overview:
The TR FVG & Swing Level Finder is a powerful Pine Script indicator designed for traders who want to identify Fair Value Gaps (FVGs) and Swing Highs/Lows on their charts. This indicator combines two essential technical analysis tools into one, helping traders spot potential areas of support, resistance, and trend reversals. FVGs are price gaps that often act as areas of interest for price to return to, while swing highs and lows help identify key turning points in the market. The indicator is highly customizable, allowing users to adjust colors, limits, and display options to suit their trading style.
Key Features:
1: Fair Value Gap (FVG) Detection:
- Identifies Bullish FVGs: Occur when the high of two candles ago is lower than the low of the current candle, indicating a potential upward price movement.
- Identifies Bearish FVGs: Occur when the low of two candles ago is higher than the high of the current candle, indicating a potential downward price movement.
- Displays FVGs as colored boxes on the chart, with customizable border and fill colors based on the timeframe.
- Labels each FVG box with the corresponding timeframe (e.g., "1m FVG", "1h FVG", "Daily FVG").
2: Swing High and Swing Low Detection:
- Detects Swing Highs: A 3-candle pattern where the middle candle's high is higher than the highs of the candles on either side.
- Detects Swing Lows: A 3-candle pattern where the middle candle's low is lower than the lows of the candles on either side.
- Draws a solid black line with 50% opacity at each swing high and low, extending 5 bars to the right for better visibility.
- Adds a small Swing High or Swing Low label at the right end of each line, colored according to user-defined settings.
3: Timeframe-Specific FVG Visualization:
- FVGs are color-coded based on the chart's timeframe, making it easy to distinguish between FVGs on different timeframes.
- Each timeframe has its own fill color for bullish and bearish FVGs, with adjustable transparency for better chart clarity.
- A dashed black line is drawn in the middle of each FVG box to highlight the midpoint of the gap.
4: Customizable Display Options:
- FVG Limit: Control the maximum number of FVGs displayed on the chart (from 1 to 20).
- Extend Options for FVG Boxes:
- "None": FVG boxes extend only 2 bars to the right.
- "Limited": FVG boxes extend a user-defined number of candles to the right (1 to 100 candles).
- "Default": FVG boxes extend 3 bars to the right of the current bar.
- Color Customization:
- Set border colors for bullish and bearish FVGs.
- Adjust fill colors for FVGs on different timeframes (1m, 5m, 15m, 30m, 1h, 4h, Daily, Weekly, Monthly).
- Customize the colors of swing high and swing low labels.
5: Performance Optimization:
- The indicator only plots FVGs and swings on the last confirmed bar (barstate.islastconfirmedhistory), ensuring efficient performance and reducing chart clutter.
- Limits the number of displayed FVGs and swings to the user-defined fvgLimit, keeping the chart clean and focused on the most recent price action.
6: Inputs and Customization:
- Number of FVGs to Show (fvgLimit): Set the maximum number of FVGs and swings to display (default: 3, range: 1 to 20).
- Bullish FVG Border Color (bullishColor): Choose the border color for bullish FVGs (default: green).
- Bearish FVG Border Color (bearishColor): Choose the border color for bearish FVGs (default: red).
- Swing High Color (swingHighColor): Set the color for swing high labels (default: blue).
- Swing Low Color (swingLowColor): Set the color for swing low labels (default: purple).
- Extend Options:
- Extend Option (extendOption): Choose how far FVG boxes extend to the right ("None", "Limited", or "Default"; default: "Default").
- Extend Candles (extendCandles): If "Limited" is selected, specify the number of candles to extend FVG boxes (default: 8, range: 1 to 100).
- Timeframe-Specific Fill Colors:
- Customize fill colors for bullish and bearish FVGs on various timeframes (1m, 5m, 15m, 30m, 1h, 4h, Daily, Weekly, Monthly).
- Each fill color has a default transparency (e.g., 93% for most timeframes, 90% for 30m), which can be adjusted as needed.
How to Use:
1: Add the Indicator to Your Chart:
- Open TradingView, go to the Pine Editor, and paste the script.
- Click "Add to Chart" to apply the indicator to your current chart.
2: Adjust Settings:
- Open the indicator settings by clicking the gear icon next to the indicator name on your chart.
- Modify the inputs to suit your preferences:
- Set the number of FVGs and swings to display.
- Choose your preferred colors for FVGs and swings.
- Adjust the extend options for FVG boxes.
3: Interpret the Indicator:
- FVG Boxes: Look for colored boxes on the chart, which represent Fair Value Gaps. Bullish FVGs (green borders by default) suggest potential buying opportunities, while bearish FVGs (red borders by default) suggest potential selling opportunities. The label inside each box indicates the timeframe of the FVG.
- Swing Highs and Lows: Identify key turning points with solid black lines (50% opacity) at swing highs and lows. Each line extends 5 bars to the right, with an "SH" (Swing High) or "SL" (Swing Low) label at the end. Swing highs can act as resistance levels, while swing lows can act as support levels.
4: Combine with Your Strategy:
- Use FVGs to identify areas where price might return to fill the gap, often acting as support or resistance.
- Use swing highs and lows to spot potential trend reversals or to set stop-loss and take-profit levels.
- Combine the indicator with other tools (e.g., trendlines, moving averages) for a more comprehensive trading strategy.
Notes:
- The indicator works on all timeframes, but the appearance of FVGs and swings will vary depending on the chart's timeframe.
- For best results, use the indicator on a clean chart to avoid visual clutter, especially if you increase the fvgLimit.
- The swing high/low lines are drawn with 50% opacity to ensure they don’t overpower other chart elements, but they are still clearly visible.
Author’s Note:
This script was developed to help traders identify key price levels with ease. I hope it adds value to your trading! If you have any feedback or suggestions for improvement, feel free to leave a comment. Happy trading!

Historical High/Lows Statistical Analysis(More Timeframe interval options coming in the future)
Indicator Description
The Hourly and Weekly High/Low (H/L) Analysis indicator provides a powerful tool for tracking the most frequent high and low points during different periods, specifically on an hourly basis and a weekly basis, broken down by the days of the week (DOTW). This indicator is particularly useful for traders seeking to understand historical behavior and patterns of high/low occurrences across both hourly intervals and weekly days, helping them make more informed decisions based on historical data.
With its customizable options, this indicator is versatile and applicable to a variety of trading strategies, ranging from intraday to swing trading. It is designed to meet the needs of both novice and experienced traders.
Key Features
Hourly High/Low Analysis:
Tracks and displays the frequency of hourly high and low occurrences across a user-defined date range.
Enables traders to identify which hours of the day are historically more likely to set highs or lows, offering valuable insights into intraday price action.
Customizable options for:
Hourly session start and end times.
22-hour session support for futures traders.
Hourly label formatting (e.g., 12-hour or 24-hour format).
Table position, size, and design flexibility.
Weekly High/Low Analysis by Day of the Week (DOTW):
Captures weekly high and low occurrences for each day of the week.
Allows traders to evaluate which days are most likely to produce highs or lows during the week, providing insights into weekly price movement tendencies.
Displays the aggregated counts of highs and lows for each day in a clean, customizable table format.
Options for hiding specific days (e.g., weekends) and customizing table appearance.
User-Friendly Table Display:
Both hourly and weekly data are displayed in separate tables, ensuring clarity and non-interference.
Tables can be positioned on the chart according to user preferences and are designed to be visually appealing yet highly informative.
Customizable Date Range:
Users can specify a start and end date for the analysis, allowing them to focus on specific periods of interest.
Possible Uses
Intraday Traders (Hourly Analysis):
Analyze hourly price action to determine which hours are more likely to produce highs or lows.
Identify intraday trading opportunities during statistically significant time intervals.
Use hourly insights to time entries and exits more effectively.
Swing Traders (Weekly DOTW Analysis):
Evaluate weekly price patterns by identifying which days of the week are more likely to set highs or lows.
Plan trades around days that historically exhibit strong movements or price reversals.
Futures and Forex Traders:
Use the 22-hour session feature to exclude the CME break or other session-specific gaps from analysis.
Combine hourly and DOTW insights to optimize strategies for continuous markets.
Data-Driven Trading Strategies:
Use historical high/low data to test and refine trading strategies.
Quantify market tendencies and evaluate whether observed patterns align with your strategy's assumptions.
How the Indicator Works
Hourly H/L Analysis:
The indicator calculates the highest and lowest prices for each hour in the specified date range.
Each hourly high and low occurrence is recorded and aggregated into a table, with counts displayed for all 24 hours.
Users can toggle the visibility of empty cells (hours with no high/low occurrences) and adjust the table's design to suit their preferences.
Supports both 12-hour (AM/PM) and 24-hour formats.
Weekly H/L DOTW Analysis:
The indicator tracks the highest and lowest prices for each day of the week during the user-specified date range.
Highs and lows are identified for the entire week, and the specific days when they occur are recorded.
Counts for each day are aggregated and displayed in a table, with a "Totals" column summarizing the overall occurrences.
The analysis resets weekly, ensuring accurate tracking of high/low days.
Code Breakdown:
Data Aggregation:
The script uses arrays to store counts of high/low occurrences for both hourly and weekly intervals.
Daily data is fetched using the request.security() function, ensuring consistent results regardless of the chart's timeframe.
Weekly Reset Mechanism:
Weekly high/low values are reset at the start of a new week (Monday) to ensure accurate weekly tracking.
A processing flag ensures that weekly data is counted only once at the end of the week (Sunday).
Table Visualization:
Tables are created using the table.new() function, with customizable styles and positions.
Header rows, data rows, and totals are dynamically populated based on the aggregated data.
User Inputs:
Customization options include text colors, background colors, table positioning, label formatting, and date ranges.
Code Explanation
The script is structured into two main sections:
Hourly H/L Analysis:
This section captures and aggregates high/low occurrences for each hour of the day.
The logic is session-aware, allowing users to define custom session times (e.g., 22-hour futures sessions).
Data is displayed in a clean table format with hourly labels.
Weekly H/L DOTW Analysis:
This section tracks weekly highs and lows by day of the week.
Highs and lows are identified for each week, and counts are updated only once per week to prevent duplication.
A user-friendly table displays the counts for each day of the week, along with totals.
Both sections are completely independent of each other to avoid interference. This ensures that enabling or disabling one section does not impact the functionality of the other.
Customization Options
For Hourly Analysis:
Toggle hourly table visibility.
Choose session start and end times.
Select hourly label format (12-hour or 24-hour).
Customize table appearance (colors, position, text size).
For Weekly DOTW Analysis:
Toggle DOTW table visibility.
Choose which days to include (e.g., hide weekends).
Customize table appearance (colors, position, text size).
Select values format (percentages or occurrences).
Conclusion
The Hourly and Weekly H/L Analysis indicator is a versatile tool designed to empower traders with data-driven insights into intraday and weekly market tendencies. Its highly customizable design ensures compatibility with various trading styles and instruments, making it an essential addition to any trader's toolkit.
With its focus on accuracy, clarity, and customization, this indicator adheres to TradingView's guidelines, ensuring a robust and valuable user experience.

GT - Recent High/Low█ OVERVIEW
This indicator will help traders identify the recent high and low of the current trend so we know where we are in the trend. If recent high/low broken it could be that the trend is changing. This indicator is based on price action.
█ HOW IT WORKS
Basically, a trend is when the prices move up and down in a stair-step fashion. In an uptrend, The indicator keeps track of the up and down movement and remember the last high and once the price pull back and broke the recent high it will mark out the new high. When prices pull back in and uptrend it must not broken the recent low. If the pull back move broke the recent low it could means that the trend is changing and we could see prices start going down. Downtrend is the reverse of uptrend.
Whenever the price broke the recent high or low the script will go back from the candle that broken the previous high to find the recent low. As long as the high of previous candle is lower than each other consecutively backward, all of those candle will be counted as part of the up move. The lowest low of these candles will be counted as the recent low. If one of the candles that are part of the up move is an inside bar then the recent low is the low of that inside bar candle (for downtrend it will be the high). Inside bar candle is a candle that it's high and low are both inside the high and low of the candle preceding it (to its left).
█ DISCLAIMERS
The content of this post is NOT investment advice and I am not a financial advisor.
This is for educational purpose only.
Always do you own research. Do not blindly trust a random stranger online.
█ HOW DOES IT HELP YOU
Moving the recent high and low every time a candle break out is a very tedious job. Plus, you cannot set an automatic alert system whenever price broke a recent high or low. This indicator allow you to create an alert whenever a recent high or low is broken.
You can use this indicator as a trailing stop loss strategy. Move the stop loss of your long position to the recent low level whenever price broke recent high or move the stop loss of your short position to the recent high level whenever price broke recent low.
The bullet line is the minor recent high or low before the prices broke the major recent high/low. This line could be the level where prices touch before continue with the trend.
█ TRADING IDEAS
Based on how a candle broke the recent high or low, if it breaks impulsively you can develop your strategy to trade the pullback and hoping on the trend before it continue to move up or down.
█ CURRENT FEATURES
Recent high/low.
Previous high/low.
Inside bar marker.
Alert for when high/low broken. Configurable message format either in JSON or plain text, useful when using with webhook alert.
Bullet line (trend continuation line).
Toggle switch to redraw in realtime. CAUTION: this will cause repainting and alert will fire multiple time during a real-time bar.
█ NOTES
- I am very new to pine script. So there could be a way to handle the alert in realtime to not fire multiple time, Once I found a way I will update the indicator. However, redrawing in realtime will definitely cause repainting of high/low or bullet line, as far as I know this cannot be fixed because it is how pine script compiler works.
- If you like the indicators and it helps you please be sure to leave a like.
█ CREDITS
This indicator is made by me but the idea is inspired by Guerrilla Trading course. Which is why this indicator is closed-source. Guerrilla doesn't support the use of indicators and they believe in mastering reading candle sticks using price action on a naked chart. However, I'm a visual learner, I do my due diligent in backtesting and learning how to read the chart. I think that a little help with indicator to smooth my learning curve or make it easier to identify important level is very useful.
!IMPORTANT!: If you are a member of Guerrilla please do not advertise this indicator on their forum as they do not support the idea of using indicators.
While using the indicator if you found any bugs or the lines draw incorrectly please report it directly to me by leaving a comment or message me directly. Do not report the bugs of this indicator to Guerrilla Trading as this has nothing to do with them and they are not the maintainer.
If you are not a member of Guerrilla but you are considering joining Guerrilla Trading. You can support me out by using my affiliate link in my Signature . Thank you very much!
█ CONTRIBUTE
If you are a developer and a member of Guerrilla and you would like to contribute to this indicator please message me.

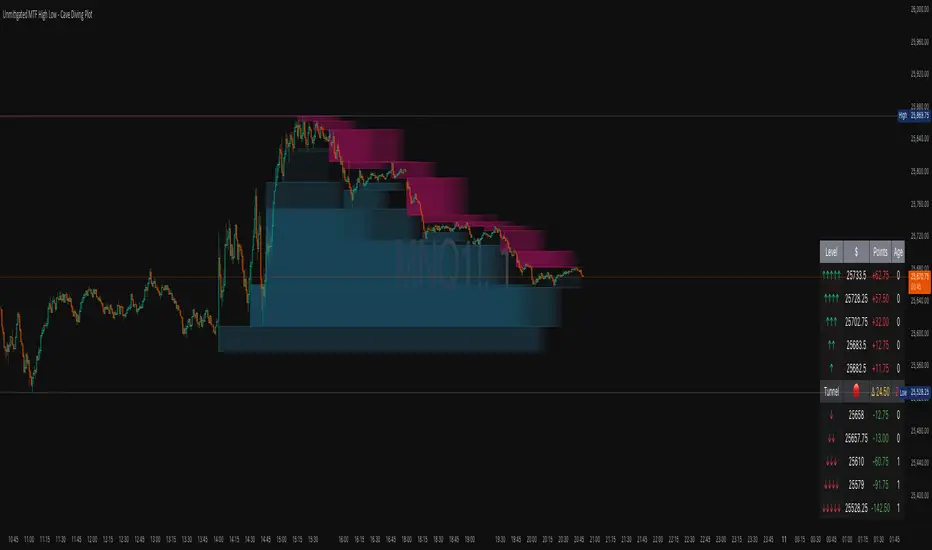
Unmitigated MTF High Low - Cave Diving Plot
IntroductionThe Unmitigated MTF High Low -
Cave Diving Plot is a multi-timeframe (MTF) indicator designed for NQ and ES futures traders who want to identify high-probability entry and exit zones based on unmitigated price levels. The "Cave Diving" visualization helps you navigate between support (floor) and resistance (ceiling) zones, while the integrated Strat analysis provides directional context.
Who Is This For?
Futures traders (NQ, ES) trading during ETH and RTH sessions
Scalpers and day traders looking for precise entry/exit levels
Traders using The Strat methodology for directional analysis
Anyone seeking confluence between price action and key levels
Core Concepts
1. Unmitigated Level:
An unmitigated level is a price high or low that has been created but not yet tested (touched) by price. These levels act as magnets - price often returns to test them.Key Properties:
Resistance (Highs): Price has created a high but hasn't revisited it
Support (Lows): Price has created a low but hasn't revisited it
Mitigation: When price touches a level, it becomes "mitigated" and loses strength
2. The Cave Diving MetaphorThink of trading as cave diving between two zones:
┌─────────────────────────────────┐
│ CEILING (Upper Band) │ ← 1st & 2nd Unmitigated Highs
│ 🟥 Resistance Zone │
├─────────────────────────────────┤
│ │
│ THE TUNNEL │ ← Price navigates here
│ (Trading Channel) │
│ │
├─────────────────────────────────┤
│ 🟢 Support Zone │
│ FLOOR (Lower Band) │ ← 1st & 2nd Unmitigated Lows
└─────────────────────────────────┘
Trading Concept:
Ceiling: Formed by the 1st and 2nd most recent unmitigated highs
Floor: Formed by the 1st and 2nd most recent unmitigated lows
Tunnel: The space between ceiling and floor where price operates
Cave Diving: Navigating between these zones for entries and exits
3. Session-Based Age TrackingLevels are tracked by session age:
Session: 6:00 PM to 5:00 PM NY time (23-hour window)
Age 0: Created in the current session (today)
Age 1: Created 1 session ago (yesterday)
Age 2+: Older levels (more significant)
Why Age Matters:
Older unmitigated levels are typically stronger magnets
Fresh levels (Age 0) may be weaker and easier to break
Age 2+ levels often provide high-probability reversal zones
Indicator Components
Visual Elements
1. Colored Bands (Cave Zones)Upper Band (Pink/Maroon - 95% transparency)
Space between 1st and 2nd unmitigated highs
Acts as resistance zone
Price often hesitates or reverses here
Lower Band (Teal - 95% transparency)
Space between 1st and 2nd unmitigated lows
Acts as support zone
Price often finds buyers here
2. Information Table Located in your chosen corner (default: Bottom Right), the table displays:
5 most recent unmitigated highs (top section)
Tunnel row (middle separator)
5 most recent unmitigated lows (bottom section)
Reading the TableTable Structure
┌────────┬──────────┬────────┬───────┐
│ Level │ $ │ Points │ Age │
├────────┼──────────┼────────┼───────┤
│ ↑↑↑↑↑ │ 21,450.25│ +45.30 │ 3 │ ← 5th High (oldest)
│ ↑↑↑↑ │ 21,425.50│ +32.75 │ 2 │ ← 4th High
│ ↑↑↑ │ 21,410.00│ +25.00 │ 1 │ ← 3rd High
│ ↑↑ │ 21,400.75│ +18.50 │ 1 │ ← 2nd High
│ ↑ │ 21,395.25│ +12.00 │ 0 │ ← 1st High (newest)
├────────┼──────────┼────────┼───────┤
│ Tunnel │ 🟢 │ Δ 85.50│ 2U │ ← Current State
├────────┼──────────┼────────┼───────┤
│ ↓ │ 21,310.00│ -15.25 │ 0 │ ← 1st Low (newest)
│ ↓↓ │ 21,295.50│ -22.75 │ 1 │ ← 2nd Low
│ ↓↓↓ │ 21,280.25│ -30.00 │ 1 │ ← 3rd Low
│ ↓↓↓↓ │ 21,265.75│ -38.50 │ 2 │ ← 4th Low
│ ↓↓↓↓↓ │ 21,250.00│ -45.00 │ 3 │ ← 5th Low (oldest)
└────────┴──────────┴────────┴───────┘Column
Breakdown
Column 1: Level (Arrows)
Green arrows (↑): Resistance levels above current price
Red arrows (↓): Support levels below current price
Arrow count: Indicates recency (1 arrow = newest, 5 arrows = oldest)
Why This Matters:
More arrows = older level = stronger magnet for price
Column 2: $ (Price)
Exact price of the unmitigated level
Use this for limit orders and stop placement
Column 3: Points (Distance)
Positive (+) for highs: Points above current price
Negative (-) for lows: Points below current price
Helps gauge proximity to key levels
Trading Application:
If you're +2.50 points from resistance, a reversal may be imminent
If you're -45.00 points from support, you're far from the floor
Column 4: Age (Sessions)
Number of full 6pm-5pm sessions the level has survived
Age 0: Created today (current session)
Age 1+: Created in previous sessions
Significance Ladder:
Age 0: Weak, may break easily
Age 1-2: Medium strength
Age 3+: Strong, high-probability reaction zone
Tunnel Row (Critical Information)│ Tunnel │ 🟢 │ Δ 85.50│ 2U │
└─┬─┘ └─┬─┘ └──┬──┘ └─┬─┘
│ │ │ │
Label Direction Range Strat
1. Tunnel Label: Identifies the separator row
2. Direction Indicator (🟢/🔴)
🟢 Green Circle: Current 15m bar closed bullish (above previous close)
🔴 Red Circle: Current 15m bar closed bearish (below previous close)
3. Δ (Delta/Range)
Distance in points between 1st High and 1st Low
Shows the tunnel width (trading range)
Example: Δ 85.50 = 85.50 points between ceiling and floor
Trading Use:
Wide tunnel (>100 points): More room to trade, consider range strategies
Narrow tunnel (<50 points): Tight range, expect breakout
4. Strat Pattern
1: Inside bar (consolidation)
2U: 2 Up (bullish directional bar)
2D: 2 Down (bearish directional bar)
3: Outside bar (expansion/volatility)
Color Coding:
Green: 2U (bullish)
Red: 2D (bearish)
Yellow: 3 (expansion)
Gray: 1 (inside/neutral)
HTF/CTF High/Low Mitigation with SignalsHTF/CTF High/Low Mitigation with Signals Indicator
Overview
HTF/CTF High/Low Mitigation with Signals (shortened as "H/L Signals+") is an advanced overlay indicator for TradingView, designed to identify and visualize higher timeframe (HTF) and current timeframe (CTF) swing highs/lows, track their mitigation, and generate filtered buy/sell signals using an EMA ribbon trend filter. It incorporates automated trade simulation with risk/reward (RR) visualization, position sizing based on user-defined risk, and a statistics table for performance evaluation. This tool is ideal for multi-timeframe traders focusing on swing trading, breakout strategies, or trend reversals across assets like forex, futures, metals (e.g., XAU/USD, XAG/USD), stocks, or cryptocurrencies.
The "meshup" (mashup) integrates several complementary elements: Multi-timeframe swing level detection (HTF for broader structure, CTF for finer details) with mitigation logic ensures signals align with market structure breaks; an EMA ribbon provides a dynamic trend bias to filter counter-trend trades; risk management automates position sizing and RR calculations for disciplined trading; and built-in backtesting stats offer quick insights into hypothetical performance. This combination reduces noise from isolated indicators—e.g., raw swings can be choppy, EMAs alone lag structure, and manual RR is error-prone—creating a cohesive system for spotting high-probability setups where structure, trend, and risk align. By meshing these, it aims to enhance decision-making in trending or ranging markets, though it's reactive and best used with confirmation. Note: This is a technical tool for educational purposes only; it does not provide financial advice, guarantees of profitability, or trading recommendations. Past performance is not indicative of future results, and users should backtest thoroughly on their specific assets/timeframes, in compliance with TradingView's house rules.
Key Features
• HTF Swing Levels: Detects and draws session highs/lows from a user-selected higher timeframe (e.g., Daily), extends lines until mitigated (by wick or body close), with alerts on mitigation.
• CTF Swing Levels: Identifies local swing highs/lows on the chart timeframe using a pivot candle formation (default 5-candle), with separate limits for unmitigated/mitigated lines.
• EMA Ribbon: A three-EMA system (fast 8, mid 13, slow 21) with gradient fills (green for bullish, red for bearish) to visualize trend strength and filter signals.
• Signal Generation: Buy/sell labels ("BUY"/"SELL") triggered post-mitigation when price aligns with EMA trend (e.g., above slow EMA with stacked bulls for buys).
• Trade Simulation & Risk Management: On signals, calculates stop-loss (SL) from recent extremes, position size based on fixed risk amount (e.g., $100 per trade, adjusted for asset type like futures point value or forex lots), and full take-profit (TP) at user-defined RR level (1-5). Draws RR boxes for visuals.
• Statistics Table: Displays total trades, wins/losses, win rate (%), net R-return, and max consecutive losses in a top-right table.
• Alerts: Customizable alerts for HTF mitigations and new trades (including entry, SL, TP, size).
• Visual Customizations: Toggle lines/ribbon/boxes, adjust colors/styles/widths for unmitigated/mitigated lines (HTF/CTF), min box width.
• Performance Optimization: Automatically cleans up excess lines to stay within max limits (e.g., 15 unmitigated HTF, 5 CTF).
How It Works
• HTF Logic: On new HTF bars (via time(htf_timeframe)), captures session high/low and draws extendable lines. Lines extend rightward until mitigated (high/close > high level for highs, low/close < low level for lows, toggle wick/body). Mitigation sets "waiting" flags for signals and triggers alerts.
• CTF Logic: Scans for pivot highs/lows using a user-defined candle count (e.g., 2 left/right for 5-candle swings). Draws and extends lines similarly, mitigating on wick touches, with separate styles for mitigated (e.g., dotted gray).
• EMA Ribbon Logic: Computes 8/13/21 EMAs; fills mid-slow and fast-mid with bullish green (close > slow EMA) or bearish red gradients.
• Signal Conditions: Post-mitigation (waiting_for_buy/sell true), checks EMA stack—buys require close > slow, fast > mid > slow; sells require close < slow, fast < mid < slow. Signals only on confirmed bars.
• Trade Execution: On signal, sets entry at close, scans back to mitigation bar for tightest SL (lowest low for buys, highest high for sells). Calculates risk points (entry - SL for buys), then position size via helper function (asset-specific: e.g., XAU *100, futures *pointvalue, forex 100000pointvalue). Sets full TP at entry ± (risk * full_tp_level). Draws risk/reward boxes (e.g., long: dark risk below entry, blue reward above) with RR and size text. Alerts with trade details.
• Trade Management: Monitors for SL hit (low <= SL for longs) or TP hit (high >= TP for longs); updates stats (wins if TP, losses if SL, tracks consec losses, net R as +full_tp_level or -1). Places summary label ("Hit TP5 (Win)" or "Stopped Out (Loss)").
• Cleanup: Counts unmitigated/mitigated lines; deletes oldest excess to respect max limits (e.g., max_lines_input=15 for HTF unmitigated, max_mit_lines_ctf=5 for CTF mitigated).
• Why This Meshup?: Standalone tools often fall short—HTF swings ignore local noise, but without CTF, miss entries; EMAs filter trends but overlook structure; manual RR lacks automation. Meshing them creates a "mitigation-to-signal" flow: HTF/CTF provide structural context (e.g., BOS/CHOCH), EMA ensures trend alignment (reducing whipsaws), and RR simulation adds practical risk control with stats for optimization. This holistic approach potentially improves edge in structure-based trading, especially in volatile markets, by combining macro/micro analysis with quantifiable risk—though it may lag in ranges or require tuning.
All logic uses arrays for line management, barstate.isconfirmed for reliability, and syminfo for asset-specific sizing. No repainting, but historical trades simulate based on chart data.
Settings and Customization
Inputs are grouped for usability:
1. Higher Timeframe (HTF) Settings:
o Show HTF Lines: Toggle visibility (default: true).
o Use Wick for Mitigation: True for wick touch, false for body close (default: false; tooltip explains).
o Timeframe: HTF period (default: "D").
o Max Unmitigated HTF Lines: Limit for active lines (default: 15, min 1, max 250).
2. Current Timeframe (CTF) Settings:
o Show CTF Swings: Toggle (default: true).
o CTF Swing Candle Count: Left/right candles for pivot (default: 2, min 1; tooltip: '2' = 5-candle formation).
o Max Unmitigated CTF Lines: (default: 5, min 1, max 250).
o Max Mitigated CTF Lines: (default: 5, min 1, max 250).
3. EMA Settings:
o Show EMA Ribbon: Toggle (default: true).
o Fast/Middle/Slow EMA Length: Defaults 8/13/21.
4. Risk/Reward Settings:
o Risk Amount per Trade ($): Fixed risk (default: 100.0, min 0.1; tooltip: for position sizing).
o Full Take Profit Level (1-5): RR for full win (default: 5; tooltip: counts as win in stats).
o Show Trade Visuals & Stats: Toggle boxes, labels, table (default: true).
5. 🎨 Visuals:
o Draw Risk/Reward Box: Toggle (default: true).
o Minimum Box Width (in bars): (default: 5, min 1).
o Long - Risk/Reward Box Colors: Defaults dark gray (risk), blue (reward).
o Short - Risk/Reward Box Colors: Defaults dark gray (risk), orange (reward).
6. Alert Settings:
o Alert on HTF Level Mitigation: Toggle (default: true).
7. HTF Line Style Settings:
o High (Unmitigated): Color (maroon 20%), width (1).
o High (Mitigated): Color (gray 40%), style (dotted/dashed, default dotted).
o Low (Unmitigated): Color (teal 20%), width (1).
o Low (Mitigated): Color (gray 40%), style (dotted/dashed, default dotted).
8. CTF Line Styles:
o CTF High (Unmitigated): Color (purple #8d198d 25%), width (1), style (Solid/Dotted/Dashed, default Solid).
o CTF High (Mitigated): Color (gray 50%), width (1), style (default Dotted).
o CTF Low (Unmitigated): Color (teal #008080 25%), width (1), style (default Solid).
o CTF Low (Mitigated): Color (gray 50%), width (1), style (default Dotted).
Usage Tips
• Multi-Timeframe Strategy: Use HTF (e.g., D1) for major levels, CTF for entries. Signals post-mitigation with EMA filter—enter on "BUY"/"SELL" labels, use boxes for RR visualization.
• Risk Management: Set risk_amount_per_trade to 1-2% of capital; adjust full_tp_level for strategy (e.g., 3 for conservative). Position size auto-adapts to asset (e.g., smaller for high-vol like XAU).
• Customization: Enable wick mitigation for aggressive setups; increase max lines in trending markets. Tune EMAs for asset (shorter for crypto).
• Alerts Integration: Use for notifications on mitigations or trades; messages include all details for quick action.
• Stats Analysis: Table shows hypothetical results—use for optimization (e.g., aim for >50% win rate, low consec losses). Reset on chart reload.
• Chart Compatibility: Best on candlestick charts; test on lower TFs with higher HTF for confluence.
Limitations
• Reactive Signals: Waits for mitigation + EMA alignment, so may miss early reversals or lag in fast markets.
• Chop in Ranges: Frequent mitigations without trend can generate false signals; EMA helps but not foolproof.
• Simulation Only: Trades are backtested on visible data—no live execution; stats assume full TP or SL hits, ignoring partials or slippage.
• Line Limits: Caps at user max to prevent overload; oldest deleted first.
• Asset Specificity: Position sizing tailored to forex/futures/metals; may need tweaks for others.
• Disclaimer: For informational use only. Trading involves risk of loss; results vary by market, timeframe, and settings. Consult professionals and backtest extensively. No profitability claims per TradingView rules.

Swing High/Low (Adaptive)Swing High/Low (Adaptive)
Overview
The Indicator is a pivot point detection tool that identifies swing highs and lows with invalidation tracking. The key differentiator of this indicator is its adaptive invalidation system . Most pivot indicators simply mark every detected pivot without considering whether subsequent price action has made earlier pivots less relevant.
How It Works
The indicator uses Pine Script's native ta.pivotlow() and ta.pivothigh() functions combined with custom logic to detect swing points. The adaptive algorithm evaluates each potential pivot against the following criteria:
For Low Pivots:
Confirms a new low pivot when it's the next expected pivot type in the swing sequence
If consecutive lows occur, only accepts a new low if it's lower than the previous low
Marks the previous low as invalidated when a stronger low is detected
For High Pivots:
Confirms a new high pivot when it's the next expected pivot type in the swing sequence
If consecutive highs occur, only accepts a new high if it's higher than the previous high
Marks the previous high as invalidated when a stronger high is detected
This approach ensures that the indicator maintains clean swing structure and automatically adjusts when price action creates stronger pivots, providing a more realistic view of support and resistance levels.
Settings
Pivot Settings:
Left Bars : Number of bars to the left required for pivot confirmation (default: 5)
Right Bars : Number of bars to the right required for pivot confirmation (default: 5)
Pivot Display Settings:
Toggle visibility for low and high pivots independently
Customizable colors for valid pivot markers
Low pivots marked with upward triangle (▲)
High pivots marked with downward triangle (▼)
Invalid Pivot Settings:
Optional display of invalidated pivots
Separate color customization for invalid low and high pivots
Helps visualize where market structure expectations changed
ZigZag Settings:
Toggle ZigZag line display on/off
Separate colors for upward and downward price swings
Adjustable line width
Use Cases
1. Market Structure Analysis
Identify key swing points to understand the current market structure and trend direction. The adaptive invalidation feature ensures you're always looking at the most relevant pivots.
2. Support and Resistance Identification
Use confirmed swing highs and lows as potential support and resistance levels for entry and exit planning.
3. Trend Confirmation
The ZigZag visualization helps confirm trends by showing the sequence of higher highs and higher lows (uptrend) or lower highs and lower lows (downtrend).
Disclaimer
This indicator is designed as a technical analysis tool and should be used in conjunction with other forms of analysis and proper risk management. Past performance does not guarantee future results, and traders should thoroughly test any strategy before implementing it with real capital.

Sessions High/Low with Break LogicSessions High/Low with Break Logic – Indicator Description
Update 27.10.25
Overview
This indicator marks the highs and lows of key trading sessions (Tokyo, London, New York) and highlights when these levels are broken. It is ideal for traders using session-based strategies to monitor breakouts or support/resistance levels in real time.
Key Features
Session-Based Highs/Lows:
Tracks highs and lows for three trading sessions:
Tokyo: 02:00–09:00 (UTC+1)
London: 09:00–17:00 (UTC+1)
New York: 15:30–22:00 (UTC+1)
Break Logic:
Detects when the current price breaks a session high or low.
Labels are updated with a "Break" note when a level is breached.
Visual Display:
Draws horizontal lines for highs and lows of each session.
Adds labels with values (optionally including price).
Colors are customizable for each session:
Tokyo: Purple
London: Teal
New York: Orange
Customizable Settings:
Horizontal Offset: Shifts lines and labels horizontally for clarity.
Time Zone: Adjustable to UTC+1 (default).
Price Display: Option to show the exact price next to the label.
Settings and Translations
Display Settings
Horizontal Offset: Horizontal shift for lines and labels.
Show Price with Text: Displays the price next to the label (e.g., "London High: 123.45").
Time Settings
UTC: Time zone (default: UTC+1).
Session 1 (Tokyo)
Session 1: 02:00–09:00
High Text: "Tokyo High"
Low Text: "Tokyo Low"
High Color: Purple
Low Color: Purple
Session 2 (London)
Session 2: 09:00–17:00
High Text: "London High"
Low Text: "London Low"
High Color: Teal
Low Color: Teal
Session 3 (New York)
Session 3: 15:30–22:00
High Text: "New York High"
Low Text: "New York Low"
High Color: Orange
Low Color: Orange

Weekly High/Low Day BreakdownThe "Weekly High/Low Day Breakdown" is a tool designed to help identify patterns in market behaviour by analysing the days of the week when weekly highs and lows occur. This indicator calculates the frequency and percentage of weekly highs and lows for each day from Monday to Sunday within the visible range of your chart.
Features:
Weekly Analysis: Calculates weekly highs and lows based on daily open high and low prices from Monday to Sunday.
Day-Specific Breakdown: Tracks which day of the week each weekly high and low occurred.
Visible Range Focus: Only considers data within the current visible range of your chart for precise analysis.
Interactive Table Display: Presents the results in an easy-to-read table directly on your chart.
How It Works:
Data Collection: Fetches daily high, low, day of the week, and time data regardless of your chart's timeframe. Uses these daily figures to determine the weekly high and low for each week.
Weekly Tracking: Monitors the day of the week when the weekly high and low prices occur. Resets tracking at the end of each week (Sunday).
Visible Range Analysis: Only includes weeks that fall entirely within the visible time range of your chart. Ensures that the analysis is relevant to the period you are focusing on.
Percentage Calculation: Counts the occurrences of weekly highs and lows for each day. Calculates the percentage based on the total number of weeks in the visible range.
Result Display: Generates a table with days of the week as columns and "Weekly High" and "Weekly Low" as rows. Displays the percentage values, indicating how often highs and lows occur on each day.
How to Use:
Add the Indicator: Apply the "Weekly High/Low Day Breakdown" indicator to your TradingView chart.
Adjust Visible Range: Zoom in or out to set the desired visible time range for your analysis.
Interpret the Table:
Columns: Represent days from Monday to Sunday.
"Weekly High" Row: Shows the percentage of times the weekly high occurred on each day. "Weekly Low" Row: Shows the percentage of times the weekly low occurred on each day.
Colors: Blue text indicates high percentages, red text indicates low percentages.
Example Interpretation:
If the table shows a 30% value under "Tuesday" for "Weekly High," it means that in 30% of the weeks within the visible range, the highest price of the week occurred on a Tuesday.
Similarly, a 40% value under "Friday" for "Weekly Low" indicates that 40% of the weekly lows happened on a Friday.

Prior Day High/Low and Highest High/Lowest LowFeatures:
Prior Day High and Low:
The script tracks and displays the previous trading day's high and low prices. These levels can serve as important areas of support or resistance, helping traders to make informed decisions about potential price reversals or breakouts.
Highest High and Lowest Low Over N Days:
This indicator also tracks and displays the highest high and lowest low over the last N days, where N is user-configurable. This allows traders to see broader trends in price action and identify key levels for potential trend changes.
User-Configurable Inputs:
Show Prior Day High/Low: Toggle whether to display the prior day’s high and low levels.
Days to Consider for Highest High/Lowest Low: Define the number of days over which the highest high and lowest low are calculated.
Show Highest High/Lowest Low: Toggle whether to display the highest high and lowest low levels over the specified period.
Low Source and High Source: Customize the data sources for the high and low values.
Automatic Data Handling:
The script automatically tracks the daily high and low prices, storing them in arrays, and calculates the highest and lowest prices over the user-specified number of days. When a new day begins, the prior day's data is saved, and the calculations are updated accordingly.
Visual Display:
The indicator uses distinct colors and plotting styles:
Prior day’s high and low are plotted as blue circles.
The highest high over N days is plotted as a red circle.
The lowest low over N days is plotted as a green circle.
This indicator helps traders stay informed about significant price levels, which are often used in trading strategies for breakouts, trend following, or reversals.

AP Capital – Volatility + High/Low Projection v1.1📌 AP Capital – Volatility + High/Low Projection v1.1
Predictive Daily Volatility • Session Logic • High/Low Projection Indicator
This indicator is designed to help traders visually understand daily volatility conditions, identify session-based turning points, and anticipate potential highs and lows of the day using statistical behavior observed across thousands of bars of intraday data.
It combines intraday session structure, volatility regime classification, and context from the previous day’s expansion to highlight high-probability areas where the market may set its daily high or daily low.
🔍 What This Indicator Does
1. Volatility Regime Detection
Each day is classified into:
🔴 High Volatility (trend continuation & expansion likely)
🟡 Normal Volatility
🔵 Low Volatility (chop, false breaks, mean-reversion common)
The background color automatically adapts so you always know what environment you're trading in.
2. Session-Based High/Low Identification
Different global sessions tend to create different market behaviors:
Asia session frequently sets the LOW of day
New York & Late US sessions frequently set the HIGH of day
This indicator uses those probabilities to highlight potential turning points.
3. Potential High / Low of Day Projections
The script plots:
🟢 Potential LOW of Day
🔴 Potential HIGH of Day
These appear only when:
Price hits the session-statistical turning zone
Volatility conditions match
Yesterday’s expansion or compression context agrees
This keeps signals clean and prevents over-marking.
4. Clean Visuals
Instead of cluttering the chart, highs and lows are marked only when conditions align, making this tool ideal for:
Session scalpers
Day traders
Gold / NAS100 / FX intraday traders
High-probability reversal traders
🧠 How It Works
The engine combines:
Daily range vs 20-day average
Real-time intraday high/low formation
Session-specific probability weighting
Previous day expansion and volatility filters
This results in highly reliable signals for:
Fade trades
Reversal setups
Timing entries more accurately
✔️ Best Uses
Identifying where the day’s range is likely to complete
Avoiding trades during low-volatility compression days
Detecting where the market is likely to turn during major sessions
Using potential HIGH/LOW levels as take-profit zones
Enhancing breakout or reversal strategies
⚠️ Disclaimer
This indicator does not repaint, but it is not a standalone entry tool.
It is designed to provide context, session awareness, and volatility-driven turning points to assist your existing strategy.
Always combine with sound risk management.

Monthly, Daily, 4H High Low (v2 Corrected)Multi-Timeframe Highs & Lows (M, D, 4H) with Alerts
Script Description:
Summary
This indicator is a powerful tool designed to streamline your technical analysis by plotting the most significant price levels from higher timeframes directly onto your chart. It automatically draws the previous Monthly, Daily, and 4-Hour High and Low levels, allowing you to identify key support and resistance zones without constantly switching between timeframes.
The clean, minimalist design ensures your chart remains uncluttered, while the built-in, customizable alert system notifies you instantly when the price interacts with these critical levels.
Key Features
Automatic High & Low Plotting: Visualizes the previous high and low for three key timeframes:
Monthly High & Low (Red lines)
Daily High & Low (Blue lines)
4-Hour High & Low (Orange lines)
Clear On-Chart Labels: Each line is accompanied by a small, non-intrusive label (e.g., "Monthly High") on the right side of the chart for easy identification.
Powerful Alert System: Never miss a key price reaction. The script includes a fully configurable alert system that triggers when the price crosses any of the plotted high or low levels.
Customizable Alerts: In the indicator settings, you can individually enable or disable alerts for each timeframe (Monthly, Daily, 4H), giving you full control over your notifications.
How to Use
The lines plotted by this indicator serve as powerful, objective levels of support and resistance.
Resistance: The high of a previous period (e.g., Daily High) often acts as a ceiling where price may struggle to break through.
Support: The low of a previous period (e.g., Daily Low) often acts as a floor where price may find buying interest.
Breakout/Breakdown Confirmation: A decisive close above a previous high or below a previous low can signal a potential continuation of the trend. Use the alerts to be notified of these events in real-time.
Liquidity Sweeps: Traders often watch for price to briefly "sweep" or "hunt" these levels before reversing. The alert system is perfect for catching these movements.
Setting Up Alerts
Add the indicator to your chart.
Click the Alert icon (clock symbol) in the TradingView toolbar.
In the "Condition" dropdown, select the indicator: "Multi-Timeframe Highs & Lows (v2 Corrected)".
A second dropdown will appear. Select the specific event you want to be notified about (e.g., "Cross Daily High" or "Cross 4H Low").
Choose your preferred alert settings (e.g., "Once Per Bar Close") and notification method.
Click "Create".
You can create multiple alerts for different levels as needed.
This tool was designed to be both simple and effective, helping traders make more informed decisions by keeping an eye on the bigger picture. Happy trading!
Fibonacci Pivot Points & Previous D,W&M Highs/LowsIndicator Overview
This indicator combines Fibonacci Pivot Points with previous high and low levels for different timeframes (day, week, month). It plots these levels on the chart to provide traders with key support and resistance areas, making it easier to identify potential trading opportunities.
Features
Fibonacci Pivot Points:
The indicator calculates pivot points based on the high, low, and close prices.
Fibonacci levels are used to determine support (S1, S2, S3, S4, S5) and resistance (R1, R2, R3, R4, R5) levels.
Users can customize the Fibonacci levels for both support and resistance.
Previous Highs and Lows:
The indicator plots previous day, week, and month high and low levels.
Each of these lines can be customized in terms of visibility, color, and width.
This helps traders to see key historical levels that might act as support or resistance in the future.
Inputs and Customization:
Fibonacci Time Frame:
Users can select the timeframe for calculating the pivot points (Daily, Weekly, Monthly).
Fibonacci Levels:
Customizable input fields for each Fibonacci level (R1, R2, R3, R4, R5, S1, S2, S3, S4, S5).
Previous High/Low Lines:
Day Lines:
Options to show or hide previous day's high/low lines.
Customizable color and width for these lines.
Week Lines:
Options to show or hide previous week's high/low lines.
Customizable color and width for these lines.
Month Lines:
Options to show or hide previous month's high/low lines.
Customizable color and width for these lines.
Technical Calculations:
Fibonacci Pivot Points:
Calculated as:
pp = (High + Low + Close) / 3
S1 = pp - ((High - Low) * Fibonacci Level)
R1 = pp + ((High - Low) * Fibonacci Level)
Previous High/Low Levels:
Uses request.security to fetch previous high and low values for the selected timeframe.
Plotted using line.new to draw lines across the chart.
Plotting:
The indicator plots Fibonacci Pivot Points and previous high/low lines on the chart, using distinct colors for each level.
Customizable transparency and linewidths make it easier to visually interpret the levels.
This indicator is particularly useful for traders who rely on technical analysis to identify key support and resistance levels, offering a blend of historical data and Fibonacci-based predictions.
Feel free to ask if you have any specific questions or need further adjustments!
