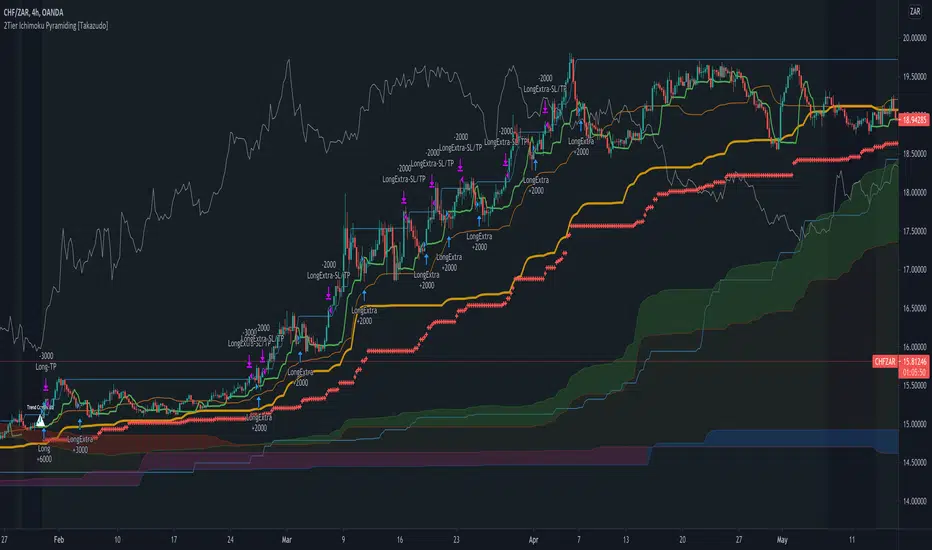
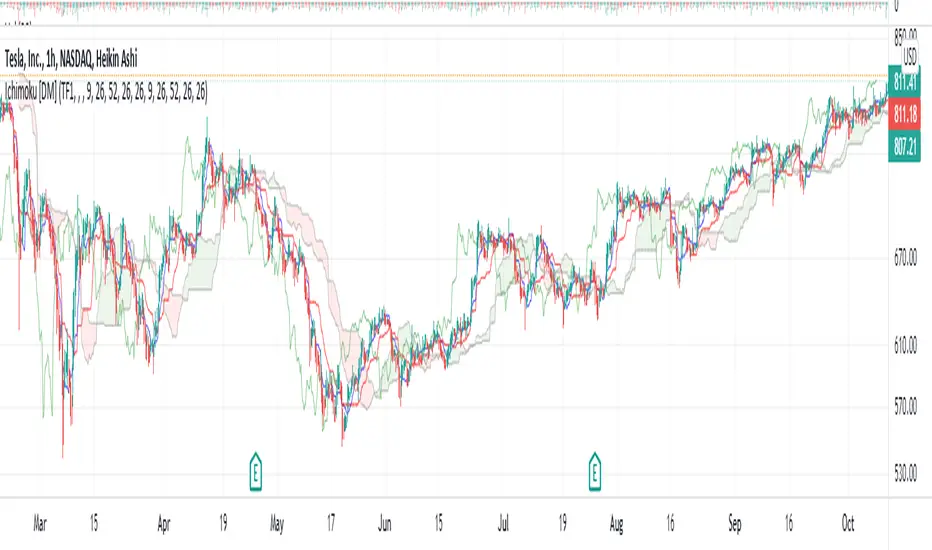
2Tier Ichimoku Pyramiding [Takazudo]Ichimoku based pyramiding strategy example that was tested on 4h TF.
makes the first entry when 2Tier Kumo breakout was occurred.
makes the extra entries when higher-low (on long) or lower-high (on short) was occurred.
uses short term MACD reversal + stop entry as a confirmation of the trend.
slack trailing stop loss.
changes entry quantity by the percentage of SL.
prevents the ranged entry.
This is just an example of how to trade using Ichimoku signals.
Cari dalam skrip untuk "ichimoku"
Ichimoku Trend DirectionThis script will help you detect the current trend of market use Ichimoku trading system. We use the default parameters.
To reduce risk, ONLY trade follow the trend of high time frame!
Very simple to use:
- Green background when market Up trend
- Red background when market Down trend
Have a nice trade! :P
Volume Weighted Ichimoku (Cleaned Up Visuals)Ichimoku with cleaned up appearance on chart and volume-weighted highs / lows. Publishing this final version with open script.

Ichimoku Line CounterThis simple script will help you seen the range of Kijun-sen, Tenkan-sen and Senkou span B. You can use it to analyze the direction of Ichimoku components. Very useful for Ichimoku trader!
Example: how many days Kijun, Kumo, ... still flat or become flat?
We use the default number: 9, 26 and 52. You absolutely can modify it if your system use different numbers :P
Have a nice trade! :D
Ichimoku Cloud Enhanced - Conditions IndicatorOriginal Cloud code base from "Ichimoku Cloud Enhanced For Crypto"
Link here
At a glance simplified rendering of ichimoku cloud elements and algorithmic detection of all ichimoku cloud events. Has alert conditions for all/most events you would want.
Central red/green band represents the cloud and the current "future" cloud colour.
Kumo Twists are shown for when they are both below/above the current candle and for when they first appear in the "future" cloud.
Orange line represents close and it's relative position to the cloud and Kinjun.
Tenkan and Kinjun, crosses and relative position to the cloud (blue/green lines). Will show crosses if they occurred above/in/below the cloud etc.
Chikouspan Breakouts (above/below cloud & price action) fuchsia lines.
It should have all the logic required to build a strategy from IC conditions by combining them however you want.
-------------------------------------------------------
If you find it useful please consider a tip/donation to the rumpy liquidation recovery fund : BTC - 3BMEXEDyWJ58eXUEALYPadbn1wwWKmf6sA
Ichimoku Screener [Pineify]Advanced Multi-Timeframe Ichimoku Screener - Complete Market Analysis Tool
This sophisticated Ichimoku Screener represents a comprehensive approach to multi-timeframe market analysis, combining four distinct Ichimoku-based indicators into a unified screening system. Unlike traditional single-symbol indicators, this screener provides simultaneous analysis across multiple assets and timeframes, enabling traders to identify optimal trading opportunities with enhanced precision and efficiency.
Key Features
Multi-asset screening capability for up to 10 symbols simultaneously
Four customizable timeframes per symbol for comprehensive analysis
Four integrated Ichimoku-based indicators working in harmony
Real-time visual feedback with color-coded signals
Customizable Ichimoku parameters for personalized analysis
Clean, organized table display for easy interpretation
Automated signal strength assessment and timing
How It Works
The screener employs the traditional Ichimoku Kinko Hyo methodology, utilizing five core components: Conversion Line (Tenkan-sen), Base Line (Kijun-sen), Leading Span A (Senkou Span A), Leading Span B (Senkou Span B), and displacement calculations. Each component is mathematically calculated using specific period lengths:
Conversion Line = (Highest High + Lowest Low) / 2 over conversion period
Base Line = (Highest High + Lowest Low) / 2 over base period
Leading Span A = (Conversion Line + Base Line) / 2
Leading Span B = (Highest High + Lowest Low) / 2 over lagging span period
The screener processes these calculations across multiple securities simultaneously using TradingView's security() function, enabling real-time cross-asset analysis. The system tracks state changes using barssince() functions to provide precise timing information for each signal type.
Trading Ideas and Insights
This screener excels in identifying momentum convergence patterns where multiple Ichimoku components align across different timeframes. The most powerful signals occur when:
Cloud color aligns with price position relative to the cloud
Conversion Line crosses above/below Base Line in the same direction as cloud bias
Multiple timeframes show consistent directional bias
Entry signals appear with minimal bars since formation (indicating fresh momentum)
For trend following strategies , focus on symbols where the cloud maintains consistent color across higher timeframes while showing recent entry signals on lower timeframes. For reversal opportunities , identify assets where cloud color changes coincide with price re-entering the cloud after extended periods above or below.
The screener particularly excels in cryptocurrency and forex markets where momentum shifts can be dramatic and sustained. By monitoring multiple timeframes simultaneously, traders can identify when short-term signals align with longer-term trends, significantly improving trade success probability.
How Multiple Indicators Work Together
The four integrated indicators create a comprehensive analytical framework through synergistic interaction:
Ichimoku Cloud (IchiCld) establishes the primary trend bias by comparing Leading Span A with Leading Span B. When Span A > Span B, the cloud displays bullish characteristics; when Span A < Span B, bearish characteristics emerge. The indicator tracks duration since the last cloud color change, providing momentum persistence insight.
Ichimoku Lagging Cloud (IchiLagCld) determines price position relative to the displaced cloud formation. This indicator identifies whether current price action occurs above, below, or within the cloud structure, revealing support/resistance dynamics and trend confirmation signals.
Conversion vs Base (IchiC>Base) monitors the relationship between short-term (Conversion Line) and medium-term (Base Line) momentum. Crossovers in this relationship often precede significant price movements and provide early trend change warnings.
Ichimoku Entry (IchiEnt) synthesizes all components into actionable signals by requiring alignment between cloud bias, price position, and conversion/base relationship. This multi-factor confirmation approach significantly reduces false signals while maintaining sensitivity to genuine momentum shifts.
The mathematical foundation ensures that each indicator contributes unique information while maintaining logical consistency. The system's strength lies in requiring multiple confirmations before generating entry signals, following Ichimoku's original philosophy of comprehensive market analysis.
Unique Aspects
This implementation distinguishes itself through several innovative features:
Advanced State Tracking : Unlike standard Ichimoku indicators that show current values, this screener tracks duration since state changes , providing crucial timing information for signal freshness and momentum strength assessment.
Multi-Asset Efficiency : The screener eliminates the need to manually check multiple charts by presenting comparative analysis across assets and timeframes in a single view, dramatically improving analytical efficiency.
Customizable Visual Feedback : The color-coding system adapts to different signal types and strengths, with recent signals receiving enhanced visual prominence to draw attention to fresh opportunities.
Professional Table Architecture : The organized display accommodates up to 40 symbol-timeframe combinations (10 symbols × 4 timeframes), with intelligent pagination for optimal screen utilization.
Signal Correlation Analysis : By displaying multiple timeframes for each symbol, traders can quickly identify timeframe confluence and divergence patterns that would otherwise require extensive manual analysis.
How to Use
Symbol Configuration : Enter up to 10 symbols in the Symbol input group. Use full exchange:ticker format for optimal compatibility (e.g., "BINANCE:BTCUSDT").
Timeframe Selection : Configure four timeframes in ascending order for logical analysis progression. Recommended combinations include 1m/5m/15m/1h for intraday analysis or 1h/4h/1D/1W for swing trading.
Ichimoku Parameters : Adjust the four core parameters based on your trading style:
Conversion Line Length (default: 9) - Controls short-term momentum sensitivity
Base Line Length (default: 26) - Determines medium-term trend identification
Leading Span B Length (default: 52) - Sets long-term trend calculation period
Displacement (default: 26) - Controls forward projection of cloud structure
Signal Interpretation :
Green backgrounds indicate bullish conditions
Red backgrounds indicate bearish conditions
Numerical values show bars since last state change
"L:" prefix indicates long entry signals
"S:" prefix indicates short entry signals
"N/A" indicates neutral/transitional states
Trading Workflow : Scan for symbols showing consistent signals across multiple timeframes, prioritize fresh signals (low bar counts), and use individual charts for precise entry timing and risk management.
Customization
The screener accommodates various trading approaches through parameter adjustment:
Scalping Configuration : Use shorter periods (Conversion: 5, Base: 13, Span B: 26) with 1m/3m/5m/15m timeframes for high-frequency opportunities.
Swing Trading Setup : Employ standard parameters with 4h/1D/3D/1W timeframes for position trading across days or weeks.
Cryptocurrency Optimization : Given crypto's 24/7 nature, consider using 4h/8h/1D/3D combinations for optimal signal timing.
Symbol selection can focus on correlated assets (e.g., major cryptocurrencies) for sector analysis or diverse assets for portfolio opportunity identification. The flexible timeframe configuration allows adaptation to any market's characteristic volatility and trading patterns.
Conclusion
This Advanced Multi-Timeframe Ichimoku Screener transforms traditional single-chart analysis into a comprehensive market monitoring system. By integrating multiple Ichimoku components across various timeframes and assets, it provides traders with unprecedented analytical efficiency and signal reliability.
The mathematical rigor of traditional Ichimoku analysis combines with modern Pine Script capabilities to deliver a professional-grade screening tool. Whether used for identifying trend continuation opportunities, spotting potential reversals, or conducting broad market analysis, this screener offers the analytical depth and practical functionality required for serious trading applications.
The system's emphasis on signal confluence across multiple timeframes and indicators significantly improves trade selection quality while reducing analysis time. For traders seeking to leverage Ichimoku's proven methodology across multiple markets simultaneously, this screener represents an essential analytical upgrade to traditional single-symbol approaches.

Ichimoku Cloud DistanceAn alternative way to look at the Ichimoku Cloud with various modes:
Distance to Center: the various lines of the Ichimoku system are displayed as the distance to the center of the cloud in percentage terms. 0 is the center of the cloud.
Distance to Edge: lines are displayed as the distance to the closest edge of the cloud in percentage terms. values inside the cloud are displayed as 0.
Hybrid: values outside of the cloud behave as the 'Distance to Edge' mode, values inside behave as 'Distance to Center' mode. The values outside the cloud are scaled by the supplied scale factor in order to make things more readable. Best value for this scale factor is chart/timeframe dependent. The interval from -1 to 1 is equivalent to the bottom and top of the cloud respectively; 0 is the center.
The background color is the color of the cloud.

Ichimoku Kinko Hyo [DM]Ichimoku Kinko Hyo PineV5
Definition
The Ichimoku Cloud is a package of multiple technical indicators that signal support, resistance, market trend, and market momentum. It is one of the few indicators out there that attempts to convey a number of meaningful insights into one. For that reason it can be hard to understand at first glance, but is commonly used among professional traders and market participants.
History
In the late 1960s, Goichi Hosada introduced the Ichimoku Cloud. It took several years for its adoption and understanding to take off, but today it is commonly known and used as an indicator in the field of technical analysis.
Calculations
The Ichimoku Cloud can be calculated in several different ways. It depends on your timeframe, needs, and expertise in technical analysis.
Takeaways
The Cloud is an integral part of the technical indicator as a whole and helps traders and investors identify the specific calculations made to the chart. Price below the cloud indicates a downward trend, whereas price above the cloud indicates an uptrend. These trend signals can strengthen if both the cloud and the price are moving in the same direction. Similarly, the signals can weaken if the cloud is moving in the opposite direction.
What to look for
By using various averages, the Ichimoku Cloud indicator gives traders and investors key and extensive data information. Trends are high when price is above the cloud, weak when price is below the cloud, or transitioning when price is seen inside the cloud.
As was mentioned in the Calculation section above, when Leading Span A falls below Leading Span B, we can confirm a downtrend. The cloud, in this case, displays a red hue. When Leading Span A is above Leading Span B, we can confirm an uptrend. The cloud, in this case, displays a green hue.
The Ichimoku cloud can be used with other technical indicators in order to better assess risk. By looking at larger trends, with the help of multiple indicators, traders are able to see how smaller trends can fit within the general market picture as a whole.
Limitations
With all of the lines and cloud shading and data points, the chart can look a little crowded and stuffy. In order to work through this, there’s software that can hide these lines so the chart looks cleaner for traders and all the information you’d like to see is at the forefront of the chart. At TradingView, we have special features available for all our users. Anyone using our platform can pick which lines and backgrounds they’d like shown and can also customize the color, line thickness, and opacity with a simple click.
more info: ichimoku.org
HLM Trend Line (High-Low-Midpoint / Ichimoku Line)Ichimoku style trend line .
Some strategies call for a custom Ichimoku style line (midpoint of range's high/low).
This allows you to use or replace a single line without having to customize a full Ichimoku setup.

Ichimoku breakoutIf you use Ichimoku Cloud strategies, this indicator is very useful for you!
This code indicates the candles that break the ichimoku cloud in both directions!
conversion line, base line and lagging span are disable by default, you can enable it from settings window.
green triangles under the candles with green backgrounds show break out the red clouds.
red triangles at the top of the candles with red backgrounds show break out the red clouds.
you can set alerts to be notified when an Ichimoku Cloud is broken.

Ichimoku [Gu5]Original Ichimoku Kinko Hyo created by Goichi Hosoda 1930
Knowing how to interpret the Ichimoku indicator can be complicated. I hope this version is more intuitive
Use Ichimoku to determine the trend of the day
When the market is above the cloud, and Tenkan (green line) crosses over Kijun (red Line), there is a Bullish Trend . When Tenkan crosses under Kijun, the trend ends.
When the market is under the cloud, and Tenkan crosses under Kijun; There is a Bearish Trend . When Tenkan crosses over Kijun, the trend ends.
When the market crosses the cloud (orange bars), there is no trend
The default setting is 9, 26 and 52. For cryptocurrencies (24/7 market), you can change it to 10, 30 and 60 periods.
///
Ichimoku Kinko Hyo fue creado por Goichi Hosoda en 1930
Saber interpretar al indicador Ichimoku puede ser complicado. Espero esta version sea mas intuitiva
Use Ichimoku para determinar la tendencia del día, y operar solo a favor de la misma
Cuando el mercado esta sobre la nube y Tenkan (linea verde) cruza sobre Kijun (linea roja), la tendencia es alcista. Cuando Tenkan cruza bajo Kijun, termina la tendencia.
Cuando el mercado esta bajo la nube y Tenkan cruza bajo Kijun, la tendencia es bajista. Cuando Tenkan cruza sobre Kijun, termina la tendencia.
Cuando el mercado atraviesa la nube (barras naranjas), no hay tendencia
Por defecto, el seteo es 9, 26 y 52. Para criptomonedas, puede cambiarlo a 10, 30 y 60 períodos

Ichimoku ACE ClubA. Overview:
This script is a custom implementation of the Ichimoku Cloud indicator for the TradingView platform, built using Pine Script version 4. It adds additional features like custom "Knife" lines and circle markers for specific data points. The indicator overlays on the chart and plots various elements of the Ichimoku system, including the Tenkan, Kijun, Chikou, and Kumo Cloud.
B. Inputs:
1. Tenkan (TS): This is the short-term moving average line (default period: 9).
2. Kijun (KJ): This is the medium-term moving average line (default period: 17).
3. Knife1 (K1): This line is based on a longer-term moving average (default period: 65).
4. Knife2 (K2): Another long-term moving average line (default period: 129).
5. Chikou Displacement (Chikou_Disp): The Chikou Span is plotted with a delay of 26 periods by default.
6. Displacement (disp): Determines the horizontal shift of the Kumo cloud.
C. Functions:
- `donchian(len)`: This function calculates the Donchian channel, which is the average of the highest high and the lowest low over the given period (len).
- `mf(len, offset)`: This function calculates the highest high and the lowest low over the given period, with an offset applied.
D. Plots:
1. Tenkan, Kijun, Knife1, and Knife2: These are plotted as lines with different colors and thicknesses.
- Tenkan is blue.
- Kijun is red.
- Knife1 is yellow.
- Knife2 is orange.
2. Chikou Span: This is plotted with a displacement and shown in purple.
3. Kumo Cloud: The cloud is formed by plotting two lines, Span A (green) and Span B (magenta), which represent the top and bottom of the cloud, respectively. The space between these lines is filled with a semi-transparent color, either green or magenta, depending on the relative position of the two spans.
E. Circle Markers:
- Additional circle markers are plotted for each of the Tenkan, Kijun, Knife1, and Knife2 lines at various offsets, helping to visualize the historical data points for each of these indicators. These circles are color-coded according to the line they correspond to.
F. Customization:
- The indicator allows customization of the lengths (periods) for Tenkan, Kijun, Knife1, Knife2, and other components via the script's input fields.
G. Conclusion:
This Ichimoku-based indicator provides a detailed view of the market's trend strength and direction. It offers a unique addition with the Knife lines and visual aids like circle markers for specific periods, which helps traders make better-informed decisions based on Ichimoku analysis.
---
You can modify the parameters such as `TS`, `KJ`, `K1`, `K2`, and `disp` according to your trading preferences. The colors and line thicknesses can also be adjusted for better visual representation.

Ichimoku MA Up & DownIchimoku and MA use the default.
It is repainted because it uses a moving average line.
A marker is only true if it was created after the candle closed.
The principle is too simple.
Please enjoy using it.
- Up : Conversion Line > MA #1 and Base Line > MA #2
It is an uptrend. The short-term moving average should be above the conversion line. And the long-term should be above the Base Line.
- Down : Conversion Line < MA #1 and Base Line < MA #2
It's a downtrend. The short-term moving average should be below the conversion line. And the long-term should be below the Base Line.
You can get better results if you use a momentum indicator like RSI.
Thank you.

Ichimoku Breakout Kumo SWING TRADER (By Insert Cheese)A simple strategy for long spot or long futures (swing traders) based on a basic method of Ichimoku Kinko Hyo strategies.
The strategy is simple:
- Buy when the price breaks the cloud
- Close the trade when the price closes again inside the cloud.
The parameters that work best on this strategy are 10,30,60,30 and 1 for Senkou-Span A
but you can try classic Ichimoku parameters (9,26,52,26,26) or whatever you want like (7,22,44,22,22), (10,30,60,30,30) and others.
-1D chart
I have removed everything from the interface except the cloud to make it visually more aesthetic :D (but if you want to see all the ichimoku indicator you can put in again into the chart)
I have also added several functions for you to do your own backtesting:
- Date range
- TP AND SL method
- Includes long or short trades
The strategy starts with 500 $ and use 100% for trade to make the power of the compounding :P
Remember that this is for only educational porpouse and you must to do your own research and backtested on your usually market..
I hope you like it enjoy and support this indicator :)
Donate (BEP20) 0xC118f1ffB3ac40875C13B3823C182eA2Af344c6d

Ichimoku ImbalanceYou may have heard the word balance or imbalance
This indicator is designed based on Ichimoku periods to display imbalances in each period
When you see a black mark, it means that one of the Ichimoku periods is saturated or unbalanced
If the current candle was equal to the lowest price on 9/26/52 of the last period and the highest price was equal to the last candle from left on 9/26/52 of the last period
If the current candle was equal to the highest price on 9/26/52 of the last period and the lowest price was equal to the last candle from right on 9/26/52 of the last period
This indicator is a useful and powerful tool for Ichimoku traders to understand overbought and oversold points in different time periods.
Note: This is an auxiliary tool and does not issue buy and sell signals

Ichimoku ScreenerChecks the status of Ichimoku Cloud for 30 coins/stocks.
It may take several seconds ( around 30 sec ) to load.

Ichimoku [2022] [v5] [keivanipchihagh]A more personalized ichimoki indicator with more configurations.
This indicator is exactly like the original ichimoku indicator, but with 104 Line (x4 timeframe) , 208 Line (x8 timeframe) , Quality Line and Tenken-sen & Kijun-sen crossovers added as well. The extras added to the indicator can simply be hidden in order to make the chart look less full.
104 Line : The formula is to average the highest and lowest point of the last 104 candles. This is to see the x4 time-frame as well, which shows a strong support and resistance line.
208 Line : The formula is to average the highest and lowest point of the last 208 candles. This is to see the 84 time-frame as well, which shows even a stronger support and resistance line.
Quality Line : It's exactly the same the Kijun-sen but with a positive offset of 26.
Tenken-sen & Kijun-sen Crossoveers : Just to make it easier to see the crossovers.
In future updates, I'm going to add more components and make it more insightful than it currently is. Ideas would be appreciated (:
Ichimoku Kinko Hyo [+Conditions]version 5 script - Future Cloud visible at real-time
This Ichimoku Indicator has 30 conditions identified for usage such:
Thick cloud identification (relative to the historic cloud thickness), Chikou in open area, Thin cloud identification (Relative to %), Price movements near Tenkan and Kijun and many more.
p.s. use 'calc_on_every_tick=false' in strategies to avoid repainting

Ichimoku [xdecow]The Ichimoku Kinko Hyo (Ichimoku Cloud) is a popular indicator / system.
In this version you will have a panel that shows the main signs of this system.
Each signal can have its status as bullish (weak, neutral or strong), consolidation and bearish (weak, neutral or strong).
Signals
Kijun-Sen Cross
Occurs when the price closes above/below the Kijun-sen.
Weak Bullish: Occurs below the Kumo.
Weak Bearish: Occurs above the Kumo.
Bullish/Bearish Neutral: Occurs inside the Kumo.
Strong Bullish: Occurs above the Kumo.
Strong Bearish: Occurs below the Kumo.
TK Cross
Occurs when the Tenkan-sen crosses the Kijun-sen.
Weak Bullish: Occurs when the crossing is below the Kumo.
Weak Bearish: Occurs when the crossing is above the Kumo.
Bullish/Bearish Neutral: Occurs when the crossing is inside the Kumo.
Strong Bullish: Occurs when the crossing is above the Kumo.
Strong Bearish: Occurs when the crossing is below the Kumo.
Chikou Span Cross
Occurs when the Chikou Span crosses the price.
Weak Bullish: Occurs when current price is below the Kumo.
Weak Bearish: Occurs when current price is above the Kumo.
Bullish/Bearish Neutral: Occurs when current price is inside the Kumo.
Strong Bullish: Occurs when current price is above the Kumo.
Strong Bearish: Occurs when current price is below the Kumo.
Kumo Breakout
Occurs when the price closes above/below the Kumo.
Kumo Twist
Occurs when the Senkou Span A crosses the Senkou Span B ahead.
Weak Bullish: Occurs when current price is below the Kumo.
Weak Bearish: Occurs when current price is above the Kumo.
Bullish/Bearish Neutral: Occurs when current price is inside the Kumo.
Strong Bullish: Occurs when current price is above the Kumo.
Strong Bearish: Occurs when current price is below the Kumo.
In addition, Senkou Span B turns golden when it is flat and the cloud is lighter when it is thin (default is half the average of the last 610).

Ichimoku Basic AlertsStarted with Ichimoku Kinko Hyo by Mizuki32. Converted to study and added alerting and cloud confirmation.
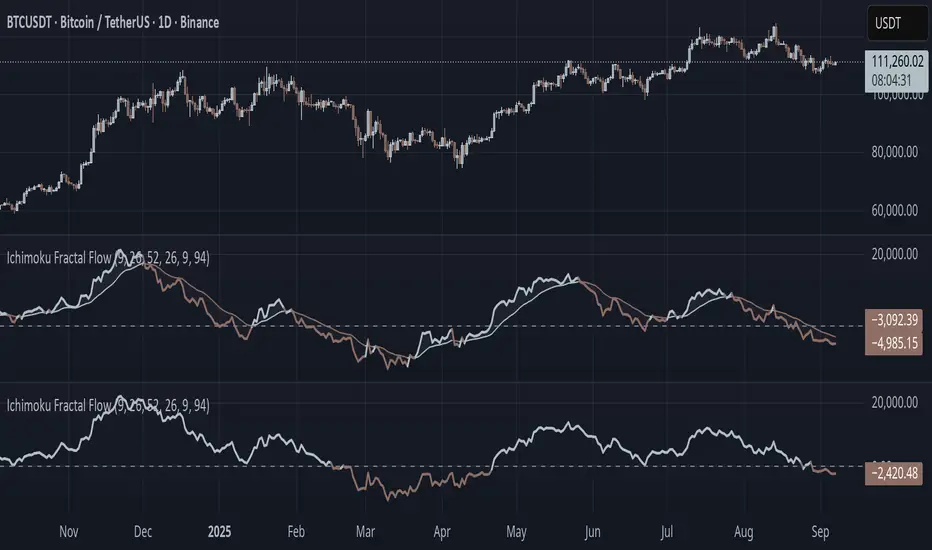
Ichimoku Fractal Flow### Ichimoku Fractal Flow (IFF)
By Gurjit Singh
Ichimoku Fractal Flow (IFF) distills the Ichimoku system into a single oscillator by merging fractal echoes of price and cloud dynamics into one flow signal. Instead of static Ichimoku lines, it measures the "flow" between Conversion/Base, Span A/B, price echoes, and cloud echoes. The result is a multidimensional oscillator that reveals hidden rhythm, momentum shifts, and trend bias.
#### 📌 Key Features
1. Fourfold Fusion – The oscillator blends:
* Phase: Tenkan vs. Kijun spread (short vs. medium trend).
* Kumo Phase: Span A vs. Span B spread (cloud thickness).
* Echo: Price vs lagged reflection.
* Cloud Echo: Price vs. projected cloud center.
2. Oscillator Output – A unified flow line oscillating around zero.
3. Dual Calculation Modes – Oscillator can be built using:
* High-Low Midpoint (classic Ichimoku-style averaging).
* Wilder’s RMA (smoother, less noisy averaging averaging).
4. Optional Smoothing – EMA or Wilder’s RMA creates a trend line, enabling MACD-style crossovers.
5. Dynamic Coloring – Bullish/Bearish color shifts for quick bias recognition.
6. Fill Styling – Highlighted regions between oscillator & smoothing line.
7. Zero Line Reference – Acts as a structural pivot (bull vs. bear).
#### 🔑 How to Use
1. Add to Chart: Works across all assets and timeframes.
2. Flow Bias (Zero Line):
* Above 0 → Bullish flow 🐂
* Below 0 → Bearish flow 🐻
3. With Signal Line:
* Oscillator above smoothing line → Possible upward trend shift.
* Oscillator below smoothing line → Possible downward trend shift.
4. Strength:
* Wide separation from smoothing = strong trend.
* Flat, tight clustering = indecision/range.
5. Contextual Edge: Combine signals with Ichimoku Cloud analysis for stronger confluence.
#### ⚙️ Inputs & Options
* Conversion Line (Tenkan, default 9)
* Base Line (Kijun, default 26)
* Leading Span B (default 52)
* Lag/Lead Shift (default 26)
* Oscillator Mode: High-Low Midpoint vs Wilder’s RMA
* Use Smoothing (toggle on/off)
* Signal Smoothing: Wilder/EMA option
* Smoothing Length (default 9)
* Bullish/Bearish Colors + Transparency
#### 💡 Tips
* Wilder’s RMA (both oscillator & smoothing) is gentler, reducing whipsaws in sideways markets.
* High-Low Mid captures pure Ichimoku-style ranges, good for structure-based traders.
* EMA reacts faster than RMA; use if you want early momentum signals.
* Zero-line flips act like momentum pivots—watch them near cloud boundaries.
* Signal line crossovers behave like MACD-style triggers.
* Strongest signals appear when oscillator, signal line, and Ichimoku Cloud all align.
👉 In short: Ichimoku Fractal Flow compresses multi-layered Ichimoku system into a single fractal oscillator that detects flow, pivotal shifts, and momentum with clarity—bridging price, cloud, and echoes into one signal. Where the cloud shows structure, IFF reveals the underlying flow. Together, they offer a fractal lens into market rhythm.
Ichimoku by FarmerBTCLegal Disclaimer
This strategy, "Ichimoku by FarmerBTC," is provided for educational and informational purposes only. It does not constitute financial advice and should not be relied upon as such. Trading and investing involve substantial risk, including the potential for losing more than your initial investment. Past performance is not indicative of future results. Always consult with a qualified financial advisor before making trading or investment decisions. The author of this strategy is not responsible for any financial losses incurred through its use.
Overview
The "Ichimoku by FarmerBTC" strategy is a trend-following system built on the Ichimoku Cloud indicator, enhanced with volume analysis and a high-timeframe Simple Moving Average (HTF SMA) condition. It is designed to identify long-only trade opportunities and performs optimally on higher timeframes, such as the daily chart or above.
Core Components
1. Ichimoku Cloud
The Ichimoku Cloud is a comprehensive trend-following indicator that helps identify the overall market direction and momentum. It consists of:
Conversion Line (Tenkan-Sen): Measures short-term momentum.
Base Line (Kijun-Sen): Filters medium-term trends.
Leading Span A: The average of the Conversion and Base Lines, forming one cloud boundary.
Leading Span B: The midpoint of the highest high and lowest low over a longer period, forming the other cloud boundary.
Key Ichimoku Rules Applied:
The strategy identifies bullish trends when:
The price is above the cloud.
The cloud is bullish (Leading Span A > Leading Span B).
2. High-Timeframe Simple Moving Average (HTF SMA)
This condition ensures alignment with the broader trend:
Default SMA Length: 13 periods.
Default Timeframe: 1 day.
HTF SMA Rule:
Trades are allowed only when the price is above the HTF SMA, ensuring alignment with the larger trend.
3. Volume Analysis
The strategy uses volume to validate trade setups:
Volume MA: A 20-period moving average of volume is calculated.
Trades are allowed only when the current volume is at least 1.5x the Volume MA, indicating strong market participation.
Entry and Exit Rules
Entry Condition (Long Only):
Price above the Ichimoku Cloud: Confirms a bullish trend.
Bullish Cloud: Leading Span A > Leading Span B indicates upward momentum.
Price above the HTF SMA: Ensures alignment with the broader trend.
Volume exceeds threshold: Confirms strong market participation.
Exit Condition:
The strategy exits the position when the price moves below the Ichimoku Cloud, signaling a potential trend reversal.
Best Timeframes
This strategy is optimized for daily (1D) or higher timeframes (e.g., weekly 1W). Using it on lower timeframes may produce false signals due to increased noise in price and volume data.
Default Settings
Ichimoku Settings:
Conversion Line Period: 10
Base Line Period: 30
Lagging Span Period: 53
Displacement: 26
HTF SMA Settings:
SMA Length: 13
Timeframe: 1 Day
Volume Settings:
Volume MA Length: 20
Volume Multiplier: 1.5x
Visualization
Ichimoku Cloud:
Dynamic cloud coloring (green for bullish, red for bearish) helps identify the current trend.
HTF SMA:
A purple line overlays the chart, providing a clear representation of the high-timeframe trend.
Volume Panel:
An optional panel displays volume (blue histogram) and the Volume Moving Average (orange line) to analyze market participation.
Advantages of This Strategy
High Accuracy on Higher Timeframes:
Filtering trades using the Ichimoku Cloud, HTF SMA, and volume ensures robust trend alignment, reducing false signals.
Volume Confirmation:
Incorporates volume as a validation metric to enter trades only during strong market participation.
Easy Customization:
Parameters like Ichimoku periods, SMA length, timeframe, and volume thresholds can be adjusted to suit different assets or trading styles.
Limitations
Not Suitable for Low Timeframes:
Lower timeframes can produce excessive noise, leading to false signals.
Long-Only:
The strategy is designed only for bullish markets and does not support short trades.
Lagging Nature of Indicators:
Both the Ichimoku Cloud and SMA are lagging indicators, meaning they react to past price movements.
Conclusion
The "Ichimoku by FarmerBTC" strategy is an excellent tool for trend-following on daily or higher timeframes. Its combination of Ichimoku Cloud, high-timeframe SMA, and volume ensures a robust framework for identifying high-probability long trades in trending markets. However, users are advised to test the strategy thoroughly and manage their risk appropriately. Always consult with a financial professional before making trading decisions.

Ichimoku Cloud Crosses_AITIchimoku Cloud Crosser_AIT
The "Ichimoku Cloud Crosses_AIT" indicator is designed to leverage the Ichimoku Cloud components, focusing on the crossovers between the Tenkan-sen and Kijun-sen lines. This indicator visually displays these crossovers on the price chart to help traders identify potential long and short trading opportunities.
1. Indicator Components
Ichimoku Cloud Elements
Tenkan-sen (Conversion Line): A short-term trend indicator. It is the midpoint of the highest high and the lowest low over a specified period (tenkanLength). In this indicator, the default period is set to 21.
Kijun-sen (Base Line): A medium-term trend indicator. It is the midpoint of the highest high and the lowest low over the specified period (kijunLength). In this indicator, the default period is set to 120.
Senkou Span A and B: These components are part of the traditional Ichimoku Cloud, but they are not directly plotted in this version of the indicator.
Chikou Span (Lagging Span): This component is included in the calculation but is not plotted in this indicator version.
2. Signal Conditions
Long Signal
Condition: A long signal is generated when the Tenkan-sen crosses above the Kijun-sen.
Visual Representation: Displayed as a yellow triangle below the price bar.
Short Signal
Condition: A short signal is generated when the Tenkan-sen crosses below the Kijun-sen.
Visual Representation: Displayed as a fuchsia triangle above the price bar.
3. How to Use the Indicator
Add the Indicator: Apply the "Ichimoku Cloud Crosses_AIT" indicator to your chart in TradingView.
Adjust Parameters: You can customize the periods for the Tenkan-sen, Kijun-sen, Senkou Span A, Senkou Span B, and Chikou Span in the indicator's settings.
Interpret the Signals:
Long Signal: Look for a yellow triangle below the bar, indicating a potential bullish crossover (Tenkan-sen crossing above Kijun-sen).
Short Signal: Look for a fuchsia triangle above the bar, indicating a potential bearish crossover (Tenkan-sen crossing below Kijun-sen).
Conclusion
The "Ichimoku Cloud Crosses_AIT" indicator provides a clear visualization of the crossovers between the Tenkan-sen and Kijun-sen lines on the price chart. This tool helps traders quickly identify potential bullish and bearish signals, making it a valuable addition to any trading strategy. Adjust the settings and parameters as needed to fit your specific trading style and market conditions.
