ICT IRON-CLAD: Fixed Sessionsall sessions and killzones marked out with colours and lables as used by all traders
Cari dalam skrip untuk "ict"


ICT Precision Turtle Soup NuNi1. Identify the CRT Range (The Context)
Before looking for a trade, the indicator defines the Candle Range Theory (CRT) boundaries based on your lookback period.
CRT High (Red Line): Represents old buy-side liquidity.
CRT Low (Green Line): Represents old sell-side liquidity.
HTF Filter: The code ensures the higher timeframe trend (e.g., 4H) aligns with your direction. Only look for Buys if the HTF trend is bullish.
2. The Manipulation (Turtle Soup 🐢)
Wait for price to move outside the CRT boundaries.
The Trap: Price must sweep below the CRT Low or above the CRT High.
The Reclaim: A Turtle Body Soup (TBS) occurs when the candle body closes back inside the range, or a wick rejection happens.
Symbol: A 🐢 icon will appear on the chart. Do not entry yet. This is just a warning that a setup is forming.
3. The Shift & Momentum (The Trigger)
To ensure a high-probability entry, the indicator waits for two technical confirmations:
MSS (Market Structure Shift): Price must break the most recent swing high (for Buys) or swing low (for Sells).
Displacement: The breaking candle must be "displaced"—meaning it has a large, energetic body compared to previous candles. This proves that big banks/institutions are moving the price.
4. The Entry Execution
Once all conditions are met, the "⭐ PRECISION ENTRY" label will appear.
Execution: You can enter at the market price when the label appears.
Retest Entry: Alternatively, look for the price to return to the IFVG or Breaker Zone (the shaded box) drawn by the indicator for a more refined entry.

ICT Premium/Discount Zones [Exponential-X]Premium/Discount Zones - Visual Market Structure Tool
Overview
This indicator helps traders visualize premium and discount price zones based on recent market structure. It automatically identifies swing highs and lows within a specified lookback period and divides the price range into three key areas: Premium Zone, Equilibrium, and Discount Zone.
What This Indicator Does
The script continuously monitors price action and calculates:
Highest High and Lowest Low within the lookback period
Equilibrium Level - the midpoint between the swing high and low
Premium Zone - the area from equilibrium to the swing high (typically viewed as relatively expensive price levels)
Discount Zone - the area from the swing low to equilibrium (typically viewed as relatively cheap price levels)
Core Calculation Method
The indicator uses pivot point logic to identify significant swing highs and lows based on the pivot strength parameter. It then calculates the highest high and lowest low over the specified lookback period. The equilibrium is computed as the arithmetic mean of these two extremes, creating a fair value reference point.
The zones are dynamically updated as new price data becomes available, ensuring the visualization remains relevant to current market conditions.
Key Features
Dynamic Zone Detection
Automatically adjusts zones based on recent price action
Uses customizable lookback period for flexibility across different timeframes
Employs pivot strength parameter to filter out minor price fluctuations
Visual Clarity
Color-coded zones for easy identification (red for premium, green for discount)
Optional equilibrium line display
Adjustable zone label placement
Customizable color schemes to match your charting preferences
Alert Capabilities
Alerts when price enters the premium zone
Alerts when price enters the discount zone
Alerts when price returns to equilibrium
Helps traders monitor key zone interactions without constant chart watching
Customization Options
Adjustable lookback period (5-500 bars)
Configurable pivot strength for swing detection (1-20 bars)
Control over box extension into the future
Toggle labels and equilibrium line on/off
Full color customization for all visual elements
How to Use This Indicator
Setup
Add the indicator to your chart
Adjust the lookback period to match your trading timeframe (shorter for intraday, longer for swing trading)
Set pivot strength to filter out noise (higher values for major swings, lower for more frequent updates)
Customize colors and labels to your preference
Interpretation
Premium Zone: Price trading here may indicate potential resistance or selling opportunities when aligned with other technical factors
Discount Zone: Price trading here may indicate potential support or buying opportunities when aligned with other technical factors
Equilibrium: Acts as a fair value reference point where price often consolidates or reacts
Trading Applications
This tool works well when combined with other forms of analysis such as:
Trend identification indicators
Volume analysis
Support and resistance levels
Price action patterns
Market structure analysis
Important Considerations
This indicator identifies zones based purely on historical price data
Premium and discount zones are relative to the recent lookback period
The effectiveness varies across different market conditions and timeframes
Should be used as part of a comprehensive trading strategy, not in isolation
Past price structure does not guarantee future price behavior
Technical Details
Calculation Method
Uses Pine Script's ta.pivothigh() and ta.pivotlow() functions for swing detection
Employs ta.highest() and ta.lowest() for range calculation
Updates dynamically with each new bar
Draws zones using box objects for clear visual representation
Performance Optimization
Efficiently manages box and line objects to minimize resource usage
Uses conditional plotting to reduce unnecessary calculations
Limited to essential visual elements for chart clarity
Timeframe Compatibility
This indicator works on all timeframes but the recommended settings vary:
1-5 minute charts: Lookback period 10-20, Pivot strength 3-5
15-60 minute charts: Lookback period 20-50, Pivot strength 5-10
Daily charts: Lookback period 50-100, Pivot strength 10-15
Weekly charts: Lookback period 20-50, Pivot strength 5-10
Adjust these values based on the volatility of your specific instrument.
Limitations and Considerations
What This Indicator Does NOT Do
Does not provide buy or sell signals on its own
Does not predict future price movements
Does not account for fundamental factors or market events
Does not guarantee profitability or accuracy
Market Condition Awareness
In strong trending markets, price may remain in premium or discount zones for extended periods
During ranging conditions, price typically oscillates between zones more predictably
High volatility can cause frequent zone recalculations
Low volatility may result in narrow zones with limited practical use
Risk Considerations
Premium and discount are relative concepts, not absolute values
What appears as a discount zone may continue lower in a downtrend
What appears as a premium zone may continue higher in an uptrend
Always use proper risk management and position sizing
Consider multiple timeframe analysis for context
Version Information
This indicator is written in Pine Script v6, ensuring compatibility with the latest TradingView features and optimal performance.
Final Notes
This tool is designed to enhance your market analysis by providing a clear visual representation of premium and discount price zones. It should be used as one component of a well-rounded trading approach that includes proper risk management, multiple forms of analysis, and realistic expectations about market behavior.
The concept of premium and discount zones is rooted in auction market theory and the idea that price oscillates around fair value. However, traders should understand that these zones are interpretive tools based on historical data and do not constitute trading advice or predictions about future price action.
Remember to backtest any strategy using this indicator on historical data before applying it to live trading, and always trade responsibly within your risk tolerance.
Disclaimer: The information provided by this indicator is for educational and informational purposes only. It does not constitute financial advice, investment advice, trading advice, or any other sort of advice. Always conduct your own research and consult with qualified financial professionals before making trading decisions.

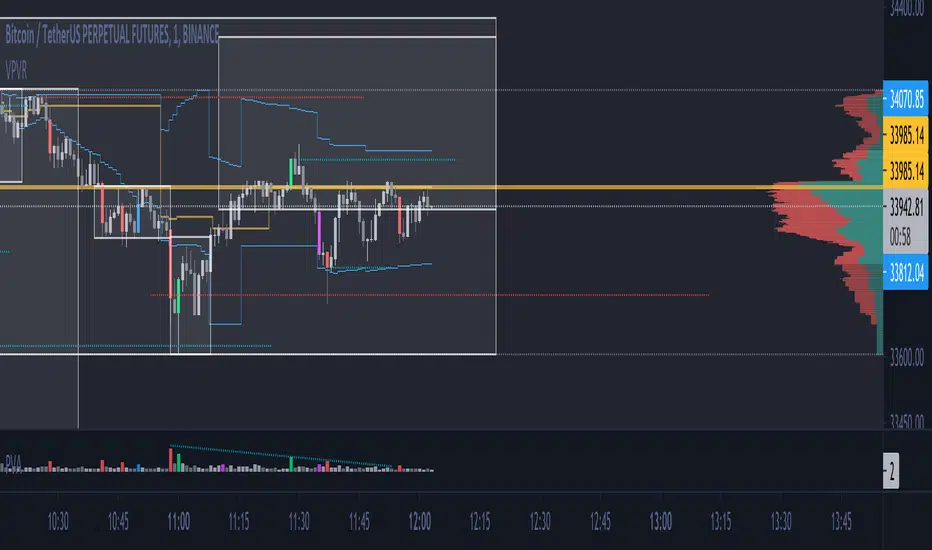
ICT Quant-Core: Liquidity Intelligence [Dual-Engine]🔥 THE ULTIMATE LIQUIDITY FILTERING ENGINE
Most SMC traders lose money because they "catch falling knives" on every local wick. This algorithm solves this problem by using DUAL-CORE logic and a signal quality scoring system.
This is no ordinary pivot indicator.
⚙️ HOW DOES IT WORK? (DUAL-CORE LOGIC)
The algorithm analyzes the market on two levels simultaneously:
1️⃣ MACRO CORE (Lookback 50 - "WHALE 🐋")
Tracks key levels from recent weeks/months.
This is where institutions build their positions.
Signals from this core have the highest priority (Score 10/10).
2️⃣ LOCAL CORE (Lookback 20 - "ROACH 🐟")
Tracks internal market structure and noise.
Signals are filtered by the Main Trend. If the trend is down, Local Longs are marked as "TRAP."
🧠 SMART FILTERS (QUANT LAYERS)
Instead of entering on every line touch, the script requires confirmation:
✅ RECLAIM LOGIC: Price must close back above/below the liquidity level (Swing Failure Pattern).
✅ RVOL FILTER: Requires relative volume > 1.2x the average (institutional track).
✅ SCORING SYSTEM (0-10): Each signal receives a score.
- 10/10: Macro Grab in line with the trend + high volume.
- 3/10: Local Grab against the trend (risky).
📊 ANALYTICAL DASHBOARD
In the lower right corner, you'll find the "Command Center":
- Trend Status (Distribution/Accumulation)
- Whale's Last Move (Price and Direction)
- Current Tactics (e.g., "Ignore Longs, Search for Shorts")
- Filter Status (RSI, Volume, Reclaim)
🚀 HOW TO USE IT?
1. Set the H4 timeframe.
2. Wait for a signal with a rating > 7/10.
3. Ignore "Fish/Local" signals (small icons) if they contradict the Dashboard color.
4. Entry occurs only after the candle closes (Reclaim).

ICT/SMC Holy GrailThe Holy Grail, with its backtesting feature to check win rates, is all you need to do when placing orders!

ICT Macro Slot Algo Event📊 Overview
A powerful multi-timeframe trading indicator that combines Institutional Macro Session Tracking identify optimal trading windows throughout the day. This tool helps traders align with institutional flow patterns and algorithmic activity across major sessions.
🎯 Key Features
1. Macro Algo Event Sessions
Tracks 6 key institutional time windows during NY Session:
NY Sweep (08:50-09:10) - Opening balance flows
Silver Bullet #1 (09:50-10:10) - First major macro move
Silver Bullet #2 (10:50-11:10) - Second chance/retest opportunity
Lunch Macro (11:50-12:10) - Mid-day repositioning
Post-Lunch Rebalance (13:10-13:40) - Post-lunch adjustments
NY Closing Macros (15:15-15:45) - End-of-day flows

ICT Macro Slot Algo Event📊 Overview
A powerful multi-timeframe trading indicator that combines Institutional Macro Session Tracking to identify optimal trading windows throughout the day. This tool helps traders align with institutional flow patterns and algorithmic activity across major sessions.
🎯 Key Features
1. Macro Algo Event Sessions
Tracks 6 key institutional time windows during NY Session:
NY Sweep (08:50-09:10) - Opening balance flows
Silver Bullet #1 (09:50-10:10) - First major macro move
Silver Bullet #2 (10:50-11:10) - Second chance/retest opportunity
Lunch Macro (11:50-12:10) - Mid-day repositioning
Post-Lunch Rebalance (13:10-13:40) - Post-lunch adjustments
NY Closing Macros (15:15-15:45) - End-of-day flows

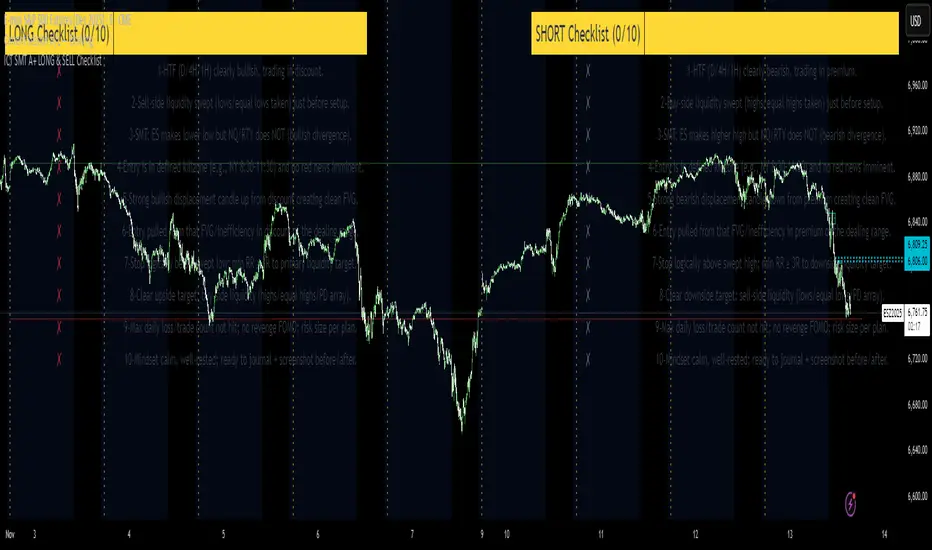
ICT SMT A+ LONG & SELL ChecklistTrade Checklist. Once all items checked color changes from yellow to green.
ICT Largest Midnight–00:30 FVG (NY, 1 per day) — FIXEDmarks out the first and largest fvg on the 1 min chart from midnight open until 12:30 am est

ICT Killzones_SAIFKill Zones Shading with High and Low levels highlight for required market sessions

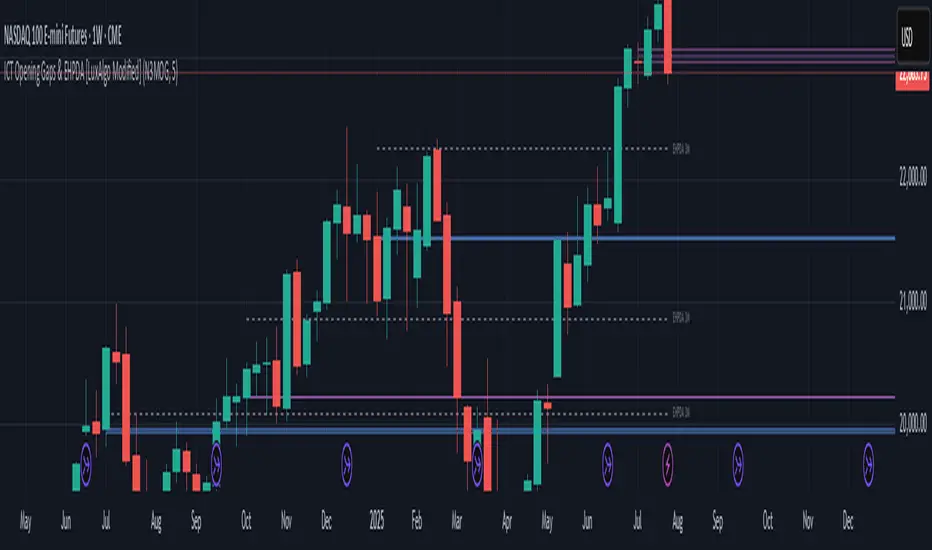
ICT Opening Gaps & EHPDA [LuxAlgo Modified]Modified version of LuxAlgo's original opening gap indicator to include NMOGs and NYOGs

ICT Macro Tracker° (Open-Source) by PesSpecific time indicator for order effectiveness when US market opens

ICT SMT Divergence Lines - EnhancedThis indicator identifies and highlights Smart Money Technique (SMT) divergence between two user-selected symbols across any timeframe. It compares the last two completed candles of both symbols and marks potential SMT signals only when market context aligns with smart money principles.
⚡ Key Features
✅ SMT Bullish Signal
Symbol 1 forms a lower low compared to its prior candle.
Symbol 2 forms a higher low compared to its prior candle.
The previous candle on the chart was bearish (close < open).
✅ SMT Bearish Signal
Symbol 1 forms a higher high compared to its prior candle.
Symbol 2 forms a lower high compared to its prior candle.
The previous candle on the chart was bullish (close > open).
✅ Visual Representation
Draws a clean, subtle line between the two SMT candles — green for bullish SMT and red for bearish SMT — making divergence easy to spot.
Optional small triangle markers above or below the bar where SMT is detected.
Old lines are automatically removed to keep the chart uncluttered.
✅ Multi-timeframe compatible
Works on any chart timeframe.
Compares the last two completed candles in the current chart timeframe, or can be adapted for a fixed higher timeframe.

ICT Macro and Daye QT ShiftEST Vertical Lines - Auto DST Adjustment
Overview
This indicator draws customizable vertical lines at specific Eastern Time (EST/EDT) points throughout the trading day, automatically adjusting for daylight savings time. Designed for precision trading on 1-minute and 5-minute charts, it highlights key intraday moments when price action tends to accelerate.
Features
- **18 pre-configured NY session times** (09:50-15:45 ET)
- **Auto timezone conversion** - Always shows correct EST/EDT regardless of your local timezone
- **3 line styles** - Choose between solid/dashed/dotted lines
- **Clean labeling** - Optional time markers above each line
- **1m/5m optimized** - Perfect for scalpers and day traders
- **Visual alerts** - "TOUCH" labels when price interacts with lines
Inputs
| Parameter | Description | Default |
|-----------|-------------|---------|
| Line Times | Comma-separated HH:MM times | 09:50,10:10,...15:45 |
| Line Color | Line color | Black |
| Line Width | 1-5px thickness | 2 |
| Line Style | Solid/Dashed/Dotted | Solid |
| Show Labels | Display time markers | true |
How To Use
1. Apply to 1m or 5m charts
2. Lines appear automatically at specified EST times
3. Watch for price reactions at these key levels
4. Customize styles via indicator settings
Ideal For
- NY open/London close traders
- Earnings/News traders
- Breakout traders
- Market open/close strategies
Updates
v1.1 - Added line style customization
v1.0 - Initial release

ICT Macro H1"H1 Candle Time Box" is a custom TradingView indicator that highlights a configurable time window surrounding the close of each 1-hour (H1) candle. The indicator draws a transparent box 15 minutes before and after each H1 candle close (by default), helping traders visualize time-based reaction zones.
🔍 Features:
Custom time window: Users can set how many minutes before and after the H1 close the box should appear.
Dynamic positioning: Boxes are drawn slightly above the candles to avoid overlap with price bars.
Live time labels: Each box displays its time range (e.g., "08:45 - 09:15") based on the start and end time of the zone.
Auto-cleaning: Only a limited number of recent boxes (default: 5) are shown, keeping the chart clean.
Requires 1-minute chart for precise timing.
This tool is especially helpful for intraday traders to identify areas of interest or market reactions before and after key hourly closes.

Nirmal Fair Value GapsICT Fair Value Gaps
Trade Wisely
How a Fair Value Gap Works
Formation:
A Fair Value Gap occurs when a strong price movement (usually from institutional orders) creates an imbalance between buyers and sellers.
This is typically seen in a three-candle pattern, where the middle candle has a large body, and the two surrounding candles have wicks but little overlap with the middle candle’s range.
Identification:
The FVG is marked between the high of the first candle and the low of the third candle (for bullish gaps).
For bearish gaps, it’s the low of the first candle and the high of the third candle.
Market Behavior Around FVG:
Price often retraces into the gap before resuming its original direction.
This happens because the market seeks to "fill" the imbalance where few trades occurred.
Traders use FVGs as potential entry zones for trend continuation trades.
Trading Fair Value Gaps
In an Uptrend:
Look for bullish fair value gaps as potential support zones for buy entries.
Price may dip into the gap and then continue upward.
In a Downtrend:
Look for bearish fair value gaps as potential resistance zones for sell entries.
Price may retrace into the gap and then drop further.
Confluence Factors:
FVGs work best when combined with other strategies like order blocks, liquidity zones, or key Fibonacci levels.

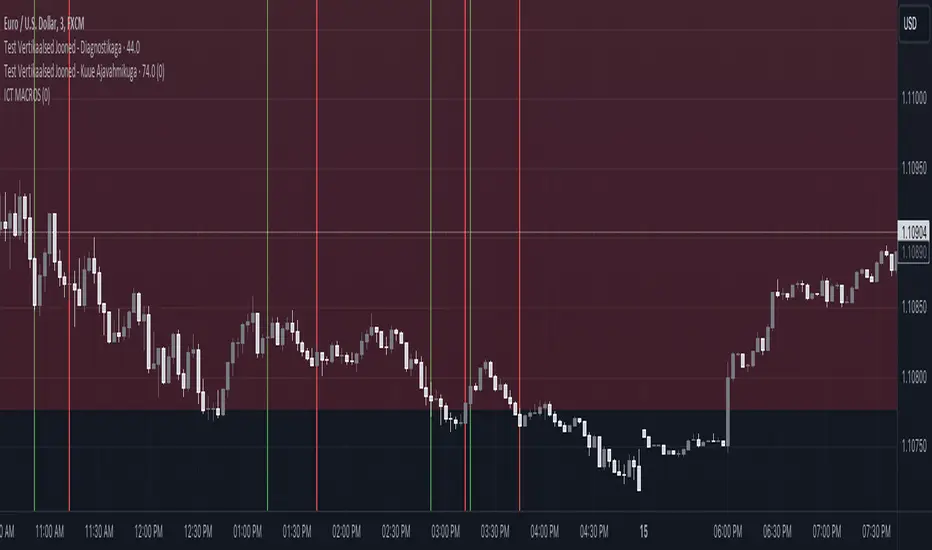
ICT MACROS (UTC-4)This Pine Script creates an indicator that draws vertical lines on a TradingView chart to mark specific time intervals during the day. It allows the user to see when certain predefined time periods start and end, using vertical lines of different colors. The script is designed to work with time frames aligned to the UTC-4 timezone.
### Key Features of the Script
1. **Vertical Line Drawing Function**:
- The script uses a custom function, `draw_vertical_line`, to draw vertical lines at specific times.
- This function takes four parameters:
- `specificTime`: The specific timestamp when the vertical line should be drawn.
- `lineColor`: The color of the vertical line.
- `labelText`: The text label for the line (used internally for debugging purposes).
- `adjustment_minutes`: An integer value that allows time adjustment (in minutes) to make the lines align more accurately with the chart’s candles.
- The function calculates an adjusted time using the `adjustment_minutes` parameter and checks if the current time (`time`) falls within a 3-minute range of the adjusted time. If it does, it draws a vertical line.
2. **User Input for Time Adjustment**:
- The `adjustment_minutes` input allows users to fine-tune the appearance of the lines by shifting them slightly forward or backward in time to ensure they align with the chart candles. This is useful because of potential minor discrepancies between the script’s timestamps and the chart’s actual candle times.
3. **Predefined Time Intervals**:
- The script specifies six different time intervals (using the UTC-4 timezone) and draws vertical lines to mark the start and end of each interval:
- **First interval**: 8:50 - 9:10 AM
- **Second interval**: 9:50 - 10:10 AM
- **Third interval**: 10:50 - 11:10 AM
- **Fourth interval**: 13:10 - 13:40 PM
- **Fifth interval**: 14:50 - 15:10 PM
- **Sixth interval**: 15:15 - 15:45 PM
- For each interval, there are two timestamps: the start time and the end time. The script draws a green vertical line for the start and a red vertical line for the end.
4. **Line Drawing Logic**:
- For each time interval, the script calculates the timestamp using the `timestamp()` function with the specified time in UTC-4.
- The `draw_vertical_line` function is called twice for each interval: once for the start time (with a green line) and once for the end time (with a red line).
5. **Visual Overlay**:
- The script uses the `overlay=true` setting, which means that the vertical lines are drawn directly on top of the existing price chart. This helps in visually identifying the specific time intervals without cluttering the chart.
### Summary
This Pine Script is designed for traders or analysts who want to visualize specific time intervals directly on their TradingView charts. It provides a customizable way to highlight these intervals using vertical lines, making it easier to analyze price action or trading volume during key times of the day. The `adjustment_minutes` input adds flexibility to align these lines accurately with chart data.
ICT Watermark | FluxxDescription:
The watermark indicator is designed to enhance the visual presentation of your trading charts by adding customizable watermarks. This tool allows you to overlay essential information, such as ticker symbols, timeframes, dates, and custom text, directly onto your charts. While providing larger text options then all other watermarks currently available.
Key Features:
Customizable Watermarks: Users can enable up to two watermarks with adjustable text content, color, size, and position.
Dynamic Information Display: Option to display real-time symbol and timeframe details, as well as the current date.
Flexible Placement: Watermarks can be positioned at the top, middle, or bottom of the chart, and aligned to the left, center, or right.
Multiple Size Options: Includes a variety of text sizes, making the text larger than any other watermark out there!
Use Cases:
Branding: Add your name or brand to your charts for a personalized touch.
Clarity: Overlay important chart details without obstructing the main content, helping in presentations or shared analysis.
This indicator is original and valuable for traders who seek to enhance the clarity and professionalism of their charts. It is particularly useful for those who create educational content or wish to maintain consistent chart branding.
ICT Premium/DiscountThis script indicator prints lines for the highest, lowest and middle price in a selected time period (in days).
With that you can easily see wheter the price is currently high, low or balanced compared to the prices in the selected time period.
I also added a gray dotted vertical line to the chart which represents the beginning of your selected time period
You can choose the time period on your own and you can also customize the color and style of the lines.
Your lines may get printed in a separate window. To fix this, click on the indicator and select
Move to -> existing pane above
Your lines also may stay stuck on the same place on the chart and are not fixed to a high/low. To fix this, right-click on the left price scale and select
Merge all scales into one -> on the right

ICT KillZones + Pivot Points [TradingFinder] Support/Resistance 🟣 Introduction
Pivot Points are critical levels on a price chart where trading activity is notably high. These points are derived from the prior day's price data and serve as key reference markers for traders' decision-making processes.
Types of Pivot Points :
Floor
Woodie
Camarilla
Fibonacci
🔵 Floor Pivot Points
Widely utilized in technical analysis, floor pivot points are essential in identifying support and resistance levels. The central pivot point (PP) acts as the primary level, suggesting the trend's likely direction.
The additional resistance levels (R1, R2, R3) and support levels (S1, S2, S3) offer further insight into potential trend reversals or continuations.
🔵 Camarilla Pivot Points
Featuring eight distinct levels, Camarilla pivot points closely correspond with support and resistance, making them highly effective for setting stop-loss orders and profit targets.
🔵 Woodie Pivot Points
Similar to floor pivot points, Woodie pivot points differ by placing greater emphasis on the closing price, often resulting in different pivot levels compared to the floor method.
🔵 Fibonacci Pivot Points
Fibonacci pivot points combine the standard floor pivot points with Fibonacci retracement levels applied to the previous trading period's range. Common retracement levels used are 38.2%, 61.8%, and 100%.
🟣 Sessions
Financial markets are divided into specific time segments, known as sessions, each with unique characteristics and activity levels. These sessions are active at different times throughout the day.
The primary sessions in financial markets include :
Asian Session
European Session
New York Session
The timing of these major sessions in UTC is as follows :
Asian Session: 23:00 to 06:00
European Session: 07:00 to 14:25
New York Session: 14:30 to 22:55
🟣 Kill Zones
Kill zones are periods within a session marked by heightened trading activity. During these times, trading volume surges and price movements become more pronounced.
The timing of the major kill zones in UTC is :
Asian Kill Zone: 23:00 to 03:55
European Kill Zone: 07:00 to 09:55
New York Kill Zone: 14:30 to 16:55
Combining kill zones and pivot points in financial market analysis provides several advantages :
Enhanced Market Sentiment Analysis : Aligns key price levels with high-activity periods for a clearer market sentiment.
Improved Timing for Trade Entries and Exits : Helps better time trades based on when price movements are most likely.
Higher Probability of Successful Trades : Increases the accuracy of predicting market movements and placing profitable trades.
Strategic Stop-Loss and Profit Target Placement : Allows for precise risk management by strategically setting stop-loss and profit targets.
Versatility Across Different Time Frames : Effective in both short and long time frames, suitable for various trading strategies.
Enhanced Trend Identification and Confirmation : Confirms trends using both pivot levels and high-activity periods, ensuring stronger trend validation.
In essence, this integrated approach enhances decision-making, optimizes trading performance, and improves risk management.
🟣 How to Use
🔵 Two Approaches to Trading Pivot Points
There are two main strategies for trading pivot points: utilizing "pivot point breakouts" and "price reversals."
🔵 Pivot Point Breakout
When the price breaks through pivot lines, it signals a shift in market sentiment to the trader. In the case of an upward breakout, where the price crosses these pivot lines, a trader might enter a long position, placing their stop-loss just below the pivot point (P).
Conversely, if the price breaks downward, a short position can be initiated below the pivot point. When using the pivot point breakout strategy, the first and second support levels can serve as profit targets in an upward trend. In a downward trend, these roles are filled by the first and second resistance levels.
🔵 Price Reversal
An alternative method involves waiting for the price to reverse at the support and resistance levels. To implement this strategy, traders should take positions opposite to the prevailing trend as the price rebounds from the pivot point.
While this tool is commonly used in higher time frames, it tends to produce better results in shorter time frames, such as 1-hour, 30-minute, and 15-minute intervals.
Three Strategies for Trading the Kill Zone
There are three principal strategies for trading within the kill zone :
Kill Zone Hunt
Breakout and Pullback to Kill Zone
Trading in the Trend of the Kill Zone
🔵 Kill Zone Hunt
This strategy involves waiting until the kill zone concludes and its high and low lines are established. If the price reaches one of these lines within the same session and is strongly rejected, a trade can be executed.
🔵 Breakout and Pullback to Kill Zone
In this approach, once the kill zone ends and its high and low lines stabilize, a trade can be made if the price breaks one of these lines decisively within the same session and then pulls back to that level.
🔵 Trading in the Trend of the Kill Zone
Kill zones are characterized by high trading volumes and strong trends. Therefore, trades can be placed in the direction of the prevailing trend. For instance, if an upward trend dominates this area, a buy trade can be entered when the price reaches a demand order block.

ICT Market SessionsThis indicator highlights sessions, kill-zones and significant time elements on the chart based on ITC's method.