ICT Open Range Gap & 1st FVG (fadi)In his 2024 mentorship program, ICT detailed how price action interacts with Open Range Gaps and the initial 1-minute Fair Value Gap following the market open at 9:30 AM.
What is an Open Range Gap?
An Open Range Gap occurs when the market opens at 9:30 AM at a higher or lower level compared to the previous day's close at 4:14 PM, primarily relevant in futures trading. According to ICT, there is a statistical probability of 70% that the price action will close 50% or more of the Open Range Gap within the first 30 minutes of trading (9:30 AM to 10:00 AM).
What is the First 1-Minute Fair Value Gap?
ICT places significant emphasis on the first 1-minute Fair Value Gap (FVG) that forms after the market opens at 9:30 AM. The FVG must occur at 9:31 AM or later to be considered valid. This gap often presents key opportunities for traders, as it represents a temporary imbalance between supply and demand that the market seeks to correct.
Understanding and leveraging these patterns can enhance trading strategies by offering insights into potential price movements shortly after market open.
ICT Open Range Gap & 1st FVG
This indicator is engineered to identify and highlight the Open Range Gaps and the first 1-minute Fair Value Gap. Furthermore, it functions across multiple timeframes, from seconds to hours, catering to various trading preferences. This flexibility is particularly beneficial for traders who favor higher timeframes or wish to observe these patterns' application at broader intervals.
Settings
The Open Range Gap indicator offers flexible display settings. It identifies the quadrants and provides optional color coding to distinguish them. Additionally, it tracks the "fill" level to visualize how far the price action has progressed into the gap, enhancing traders' ability to monitor and analyze price movements effectively. By default, the Open Range Gap will stop extending at 10:00 AM; however, there is an option to continue extending until the end of the trading day.
The 1st Fair Value Gap (FVG) can be viewed on any timeframe the indicator is active on, offering various styling options to match each trader's preferences. While the 1st FVG is particularly relevant to the day it is created, previous 1st FVGs within the same week may provide additional value. This indicator allows traders to extend Monday's 1st FVG, marking the first FVG of the week, or to extend all 1st FVGs throughout the week.
Cari dalam skrip untuk "ict"

ICT Propulsion Block [LuxAlgo]The ICT Propulsion Block indicator is meant to detect and highlight propulsion blocks, which are specific price structures introduced by the Inner Circle Trader (ICT).
Propulsion Blocks are essentially blocks located where prices interact with preceding order blocks. Traders often utilize them when analyzing price movements to identify potential turning points and market behavior or areas of interest in the market.
🔶 USAGE
An order block is a significant area on a price chart where there was a notable accumulation or distribution of orders, often identified by a strong move in price followed by a consolidation or sideways movement. Traders use order blocks to identify potential support or resistance levels.
A Propulsion Block, on the other hand, is a concept taught by the Inner Circle Trader (ICT) and refers to a specific type of order block that interacts with the preceding order block. Traders often analyze propulsion blocks to identify potential turning points and areas of interest in the market.
A mitigated order block refers to an order block that has been invalidated or nullified due to subsequent market movements or developments. It no longer holds the same significance or relevance in the current market context.
Let's explore a bearish order block and propulsion block scenario commonly utilized by ICT traders in their trading strategies.
🔶 SETTINGS
🔹 Order & Propulsion Blocks
Swing Detection Length: Lookback period used to detect swing points for creating order blocks and/or propulsion blocks.
Mitigation Price: Allows users to choose between the closing price or the candle's wick for mitigation.
Highlight Propulsion Block Signals: Highlights the propulsion block and its sentiment for easier identification and analysis.
Remove Unassociated Order Blocks: Eliminate order blocks that are not associated with any propulsion block.
Remove Mitigated Blocks: Eliminates mitigated order blocks and propulsion blocks along with their associated order blocks, streamlining the visualization for clearer analysis.
Most Recent Blocks: Activates processing of the specified number of most recent blocks according to the option. If not enabled, the script defaults to processing the last 125 occurrences.
🔹 Order & Propulsion Blocks Style
Bullish Order & Propulsion Blocks: Toggles the visibility of bullish order and propulsion blocks, along with color customization options.
Bearish Order & Propulsion Blocks: Toggles the visibility of bearish order and propulsion blocks, along with color customization options.
Block Labels: Toggles the visibility of order and propulsion block labels, and label size customization option.
🔶 RELATED SCRIPTS
Order-Blocks-Breaker-Blocks .

ICT KillZones Hunt [TradingFinder] 4 Sessions + OB + FVG + Alert🔵 Introduction
🟣 ICT
The "ICT" style is a subset of "Price Action" technical analysis. The primary goal of the ICT trading strategy is to merge "Price Action" with the "Smart Money" concept to pinpoint optimal trade entry points.
However, this approach's strength extends beyond merely finding entry points. It also helps traders gain a deeper understanding of price behavior and adapt their trading strategies to the market structure.
The most important concepts of "ICT" :
Order Block
Fair Value Gap(FVG)
Liquidity
🟣 Session
Financial markets are divided into several time periods, each featuring distinct characteristics and levels of activity. These periods, known as sessions, are active at different times during the day.
The primary active sessions in financial markets include :
Asian Session
European Session
New York Session
Based on the UTC time zone, the schedule for these key sessions is :
Asian Session: 23:00 to 06:00
European Session: 07:00 to 16:30
New York Session: 13:00 to 22:00
Note
To avoid session overlap and minimize interference during kill zones, the session times have been modified as follows :
Asian Session: 23:00 to 06:00
European Session: 07:00 to 14:25
New York Session: 14:30 to 22:55
🟣 KillZone
Kill zones are periods within a session where trader activity spikes. During these times, trading volume surges, and price movements become more pronounced.
The major kill zones, according to the UTC time zone, are as follows :
Asian Kill Zone: 23:00 to 03:55
European Kill Zone: 07:00 to 09:55
New York Morning Kill Zone: 14:30 to 16:55
New York Evening Kill Zone: 19:30 to 20:55
🔵 How to Use
🟣 Order Block
Order blocks are a distinct category of "Supply and Demand" zones, formed when a series of orders are grouped together. These blocks are often created by banks or other significant market participants.
Banks typically execute large orders in blocks during their trading sessions. If they were to enter the market with small quantities, substantial price movements would occur before the orders were fully executed, reducing potential profit.
To mitigate this, they divide their orders into smaller, more manageable positions. Traders should seek "buy" opportunities in "demand order blocks" and "sell" opportunities in "supply order blocks."
🟣 Fair Value Gap (FVG)
To pinpoint the "Fair Value Gap" on the chart, meticulous candle-by-candle analysis is essential. Pay close attention to candles with significant bodies, examining each candle alongside the one preceding it.
The candles flanking this central candle should exhibit elongated shadows, with bodies that do not intersect the body of the central candle. The span between the shadows of the first and third candles is referred to as the FVG range.
Note :
The origin of all Order Blocks and FVGs starts from inside a kill zone and extends up to the end of the same session.
🟣 Kill Zone Hunt
Following this strategy, after the conclusion of the kill zone and the stabilization of its high and low lines, if the price touches either of these lines within the same session and encounters a robust rejection, it presents an opportunity to enter a trade.
🔵 Setting
🟣 Global Setting
Show All Order Block :
If it is turned off, only the last Order Block will be displayed.
Show All FVG :
If it is turned off, only the last FVG will be displayed.
Show More Info Session :
If it is turned on, more information about kill zones (Trade Volume, Time, Number of Candles) will be displayed.
🟣 Logic Parameter
Pivot Period of Order Blocks Detector :
Enter the desired pivot period to identify the Order Block.
Order Block Validity Period (Bar) :
You can specify the maximum time the Order Block remains valid based on the number of candles from the origin.
Mitigation Level Order Block :
Determining the basic level of a block order. When the price hits the basic level, the order block due to mitigation.
🟣 Order Blocks Display
Demand Order Block :
Show or not show and specify color.
Supply order Block :
Show or not show and specify color.
🟣 Order Block Refinement
Refine Demand OB :
Enable or disable the refinement feature. Mode selection.
Refine Supply OB :
Enable or disable the refinement feature. Mode selection.
🟣 FVG
FVG Validity Period (Bar) :
You can specify the maximum time the FVG remains valid based on the number of candles from the origin.
Mitigation Level FVG :
Determining the basic level of a FVG. When the price hits the basic level, the FVG due to mitigation.
Show Demand FVG :
Show or not show and specify color.
Show Supply FVG :
Show or not show and specify color.
FVG Filter :
Enable or disable filtering of FVGs. Select filter mode.
🟣 Session
Show More Info Session Color
Asia Session, London Sesseion, New York am Session & New York pm Session :
Show or not show session and kill zones. Change the display color.
🟣 Alert
Send Alert When Touched Session high & Low :
On / Off
Alert Demand OB Mitigation :
On / Off
Alert Supply OB Mitigation :
On / Off
Alert Demand FVG Mitigation :
On / Off
Alert Supply FVG Mitigation :
On / Off
Message Frequency :
This string parameter defines the announcement frequency. Choices include: "All" (activates the alert every time the function is called), "Once Per Bar" (activates the alert only on the first call within the bar), and "Once Per Bar Close" (the alert is activated only by a call at the last script execution of the real-time bar upon closing). The default setting is "Once per Bar".
Show Alert Time by Time Zone :
The date, hour, and minute you receive in alert messages can be based on any time zone you choose. For example, if you want New York time, you should enter "UTC-4". This input is set to the time zone "UTC" by default.
Display More Info :
Displays information about the price range of the order blocks (Zone Price) and the date, hour, and minute under "Display More Info". If you do not want this information to appear in the received message along with the alert, you should set it to "Off".

ICT Times [joshu]This TradingView indicator provides a comprehensive view of ICT killzones, Silver Bullet times, and ICT Macros, enhancing your trading experience.
In those time windows price either seeks liquidity or imbalances and you often find the most energetic price moves and turning points.
Features:
Automatic Adaptation: The ICT killzones intelligently adapt to the specific chart you are using. For Forex charts, it follows the ICT Forex times:
Asia: 2000-0000
London: 0200-0500
New York: 0700-1000
London Close: 1000-1200
For other charts, it uses the following session times:
Asia: 2000-0000
London: 0200-0500
New York AM: 0830-1100
New York PM: 1330-1600
Silver Bullet Times:
0300-0400
1000-1100
1400-1500
How to Use:
Simply apply the indicator to your chart, and the session boxes and Silver Bullet times will be plotted automatically.

ICT HTF Liquidity Levels /w Alert [MsF]Japanese below / 日本語説明は英文の後にあります。
-------------------------
*This indicator is based on sbtnc's "HTF Liquidity Levels". It's a very cool indicator. thank you.
It has 3 functions: visualization of HTF liquidity (with alert), candle color change when displacement occurs, and MSB (market structure break) line display.
=== Function description ===
1. HTF liquidity (with alert)
Lines visualize the liquidity pools on the HTF bars. Alerts can be set for each TF's line.
Once the price reaches the line, the line is repaint.
To put it plainly, the old line disappears and a new line appears. The line that disappeared remains as a purged line. (It is also possible to hide the purged line with a parameter)
The alert will be triggered at the moment the line disappears. An alert will be issued when you touch the HTF's liquid pools where the loss is accumulated, so you can notice the stop hunting with the alert.
This alert is an original feature of this indicator.
The timeframe of the HTF can't modify. You can get Monthly, weekly, daily and H1 and H4.
Each timeframe displays the 3 most recent lines. By narrowing it down to 3, it is devised to make it easier to see visually. (This indicator original)
2. Displacement
Change the color display of the candlesticks when a bullish candle stick or bearish candle stick is attached. Furthermore, by enabling the "Require FVG" option, you can easily discover the FVG (Fair Value Gap). It is a very useful function for ICT trading.
3. MSB (market structure break)
Displays High/Low lines for the period specified by the parameter. It is useful for discovering BoS & CHoCH/MSS, which are important in ICT trading.
=== Parameter description ===
- HTF LIQUIDITY
- Daily … Daily line display settings (color, line width)
- Weekly … Weekly line display settings (color, line width)
- Monthly … Monthly line display settings (color, line width)
- INTRADAY LIQUIDITY
- 1H … 1H line display settings (color, line width)
- 4H … 4H line display settings (color, line width)
- PURGED LIQUIDITY … Display setting of the line once the candle reaches
- Show Purge Daily … Daily purged line display/non-display setting
- Show Purge Weekly … Weekly purged line display/non-display setting
- Show Purge Monthly … Monthly purged line display/non-display setting
- Show Purge 1H … 1H purged line display/non-display setting
- Show Purge 4H … 4H purged line display/non-display setting
- MARKET STRUCTURE BREAK - MBS
- Loopback … Period for searching High/Low
- DISPLACEMENT FOR FVG
- Require FVG … Draw only when FVG occurs
- Displacement Type … Displacement from open to close? or from high to low?
- Displacement Length … Period over which to calculate the standard deviation
- Displacement Strength … The larger the number, the stronger the displacement detected
-------------------------
このインジケータはsbtncさんの"HTF Liquidity Levels"をベースに作成しています。
上位足流動性の可視化(アラート付き)、変位発生時のローソク色変更、MSB(market structure break)ライン表示の3つの機能を有します。
<機能説明>
■上位足流動性の可視化
上位足の流動性の吹き溜まり(ストップが溜まっているところ)をラインで可視化します。ラインにはアラートを設定することが可能です。
一度価格がラインに到達するとそのラインは再描画されます。
平たく言うと、今までのラインが消えて新しいラインが出現する。という事です。
消えたラインはpurgeラインとして残ります。(パラメータでpurgeラインを非表示にすることも可能です)
アラートはラインが消える瞬間に発報します。上位足の損切り溜まってるところにタッチするとアラートを発報するので、アラートにてストップ狩りに気づくことができます。
このアラート発報については本インジケータオリジナルの機能となります。
表示可能な上位足のタイムフレームは固定です。月足、週足、日足およびH1とH4を表示することができます。
各タイムフレーム、直近から3つのラインを表示します。3つに絞ることで視覚的に見やすく工夫しています。(本インジケータオリジナル)
■変位発生時のローソク色変更
大きな陽線、陰線を付けた場合に、そのローソク足をカラー表示を変更します。
さらに"Require FVG"オプションを有効にすることで、FVG(Fair Value Gap)を容易に発見することができます。ICTトレードにを行うにあたり大変有用な機能となっています。
■MSB(market structure break)ライン表示
パラメータで指定した期間のHigh/Lowをライン表示します。ICTトレードで重要視しているBoS & CHoCH/MSSの発見に役立ちます。
<パラメータ説明>
- HTF LIQUIDITY
- Daily … 日足ライン表示設定(色、線幅)
- Weekly … 週足ライン表示設定(色、線幅)
- Monthly … 月足ライン表示設定(色、線幅)
- INTRADAY LIQUIDITY
- 1H … 1時間足ライン表示設定(色、線幅)
- 4H … 4時間足ライン表示設定(色、線幅)
- PURGED LIQUIDITY … 一度到達したラインの表示設定
- Show Purge Daily … 日足ライン表示/非表示設定
- Show Purge Weekly … 週足ライン表示/非表示設定
- Show Purge Monthly … 月足ライン表示/非表示設定
- Show Purge 1H … 1時間足ライン表示/非表示設定
- Show Purge 4H … 4時間足ライン表示/非表示設定
- MARKET STRUCTURE BREAK - MBS
- Loopback … High/Lowを探索する期間
- DISPLACEMENT FOR FVG
- Require FVG … FVG発生時のみ描画する
- Displacement Type … openからcloseまでの変位か?highからlowまでの変位か?
- Displacement Length … 標準偏差を計算する期間
- Displacement Strength … 変位の強さ(数字が大きいほど強い変位を検出)

ICT Macros [LuxAlgo]The ICT Macros indicator aims to highlight & classify ICT Macros, which are time intervals where algorithmic trading takes place to interact with existing liquidity or to create new liquidity.
🔶 SETTINGS
🔹 Macros
Macro Time options (such as '09:50 AM 10:10'): Enable specific macro display.
Top Line , Mid Line , Bottom Line and Extending Lines options: Controls the lines for the specific macro.
🔹 Macro Classification
Length : A length to detect Market Structure Brakes and classify macro type based on detection.
Swing Area : Swing or Liquidity Area selection, highest/lowest of the wick or the candle bodies.
Accumulation , Manipulation and Expansion color options for the classified macros.
🔹 Others
Macro Texts : Controls both the size and the visibility of the macro text.
Alert Macro Times in Advance (Minutes) : This option will plot a vertical line presenting the start of the next macro time. The line will not appear all the time, but it will be there based on remaining minutes specified in the option.
Daylight Saving Time (DST) : Adjust time appropriate to Daylight Saving Time of the specific region.
🔶 USAGE
A macro is a way to automate a task or procedure which you perform on a regular basis.
In the context of ICT's teachings, a macro is a small program or set of instructions that unfolds within an algorithm, which influences price movements in the market. These macros operate at specific times and can be related to price runs from one level to another or certain market behaviors during specific time intervals. They help traders anticipate market movements and potential setups during specific time intervals.
To trade these effectively, it is important to understand the time of day when certain macros come into play, and it is strongly advised to introduce the concept of liquidity in your analysis.
Macros can be classified into three categories where the Macro classification is calculated based on the Market Structure prior to macro and the Market Structure during the macro duration:
Manipulation Macro
Manipulation macros are characterized by liquidity being swept both on the buyside and sellside.
Expansion Macro
Expansion macros are characterized by liquidity being swept only on the buyside or sellside. Prices within these macros are highly correlated with the overall trend.
Accumulation Macro
Accumulation macros are characterized by an accumulation of liquidity. Prices within these macros tend to range.
The script returns the maximum/minimum price values reached during the macro interval alongside the average between the maximum/minimum and extends them until a new macro starts. These levels can act as supports and resistances.
🔶 DETAILS
All required data for the macro detection and classification is retrieved using 1 minute data sets, this includes candles as well as pivot/swing highs and lows. This approach guarantees the visually presented objects are same (same highs/lows) on higher timeframes as well as the macro classification remain same as it is in 1 min charts.
8 Macros can be displayed by the script (4 are enabled by default):
02:33 AM 03:00 London Macro
04:03 AM 04:30 London Macro
08:50 AM 09:10 New York Macro
09:50 AM 10:10 New York Macro
10:50 AM 11:10 New York Macro
11:50 AM 12:10 New York Launch Macro
13:10 PM 13:40 New York Macro
15:15 PM 15:45 New York Macro
🔶 ALERTS
When an alert is configured, the user will have the ability to be notified in advance of the next Macro time, where the value specified in 'Alert Macro Times in Advance (Minutes)' option indicates how early to be notified.
🔶 LIMITATIONS
The script is supported on 1 min, 3 mins and 5 mins charts.
🔶 RELATED SCRIPTS

ICT Macro Tracker - Study Version (Original by toodegrees)This indicator is a modified study version of the ICT Algorithmic Macro Tracker by toodegrees, based on the original open-source script available at The original indicator plots ICT Macro windows on the chart, corresponding to specific time [ periods when the Interbank Price Delivery Algorithm undergoes checks/instructions (aka "macros") for the price engine to reprice to an area of liquidity or inefficiency.
This study version adds functionality to hide bars outside macro periods. When enabled, the indicator draws boxes that cover the full chart height during non-macro periods, obscuring those bars so only macro periods are visible. This helps focus on macro-only price action. The feature is configurable, allowing users to enable or disable it and customize the box color. All original functionality remains intact.

ICT Macro w/ AlertsWhat it does :
- Highlights the exact 20-minute ICT Macro windows (09:50–10:10, 10:50–11:10, etc.) in real New York time
- One-click “ALL xx:50–xx:10 every hour” mode for London, Asian, or full-day trading
- Optional orange background + black “ICT MACRO” label
- Powerful alert functions that only fire from Sunday 6:00pm to Friday 5:00 PM EST.
How to use it as a perfect filter:
1) Add this script to your chart
2) Add your main strategy (FVG, Order Block, Silver Bullet, etc.)
3) Create alert on your main strategy → in the condition dropdown choose
“Inside Active ICT Macro”
Result: dramatically higher win rate because you only trade when institutions are most active.

ICT Turtle Soup (Riz)The ICT Turtle Soup Complete System is an advanced implementation of the Inner Circle Trader's interpretation of the classic Turtle Soup pattern, designed to identify and trade liquidity sweeps at key market levels. This strategy capitalizes on the systematic stop-loss hunting behavior of institutional traders by detecting when price temporarily breaches significant support/resistance levels to trigger retail stop-losses, then quickly reverses direction.
Core Trading Logic
Liquidity Sweep Detection Method
The strategy monitors five critical liquidity pools where retail traders commonly place stop-loss orders:
⦁ Yesterday's High/Low: Previous daily session extremes
⦁ Daily High/Low: Rolling 20-day period extremes
⦁ 4-Hour High/Low: 30-period extremes on 4H timeframe
⦁ 1-Hour High/Low: 50-period extremes on hourly timeframe
⦁ Recent High/Low: Current timeframe extremes (20-40 bars based on trading mode)
Entry Signal Generation Process
Buy Signal (Sell-Side Liquidity Sweep):
1. Price penetrates below a key support level by a minimum threshold (5-15 ticks depending on signal quality settings)
2. The penetration bar must show strong rejection with at least 30-50% of the candle's range closing back above the swept level
3. Multi-timeframe confirmation checks for structure shift on lower timeframe (break of recent swing high)
4. Confluence scoring system evaluates 7 factors, requiring minimum 3 confirmations:
⦁ Liquidity sweep detected (weighted 2x)
⦁ Higher timeframe bullish market structure
⦁ Lower timeframe bullish break of structure
⦁ Bullish Fair Value Gap presence
⦁ Bullish Order Block formation
⦁ ICT Kill Zone timing alignment
Sell Signal (Buy-Side Liquidity Sweep):
Mirror opposite of buy signal logic, detecting sweeps above resistance levels with bearish rejection.
Risk Management & Position Sizing
Stop Loss Placement:
⦁ Calculated using ATR (Average True Range) multiplied by an adaptive factor
⦁ Base multipliers: Scalping (1.0x), Day Trading (1.5x), Swing Trading (2.0x)
⦁ Further adjusted by signal quality: Conservative (-20%), Balanced (0%), Aggressive (+20%)
⦁ Positioned beyond the liquidity sweep point to avoid re-sweeping
Take Profit Targets:
⦁ TP1: 2.0R (Risk-Reward ratio)
⦁ TP2: 3.5R
⦁ TP3: 5.0R
⦁ All levels rounded to tick precision for accurate order placement
Advanced Features & Filters
Multi-Timeframe Structure Analysis
The system performs top-down analysis across three timeframes:
⦁ Higher Timeframe (HTF): Determines primary trend bias
⦁ Medium Timeframe (MTF): Confirms intermediate structure
⦁ Lower Timeframe (LTF): Identifies precise entry triggers
ICT Kill Zones
Incorporates time-based filtering for optimal trading sessions:
⦁ Asian Session (8PM-12AM UTC)
⦁ London Session (2AM-5AM UTC)
⦁ New York Session (7AM-10AM UTC)
⦁ London Close (10AM-12PM UTC)
Smart Money Concepts Integration
⦁ Fair Value Gaps (FVG): Identifies and displays price inefficiencies that act as magnets
⦁ Order Blocks: Marks institutional accumulation/distribution zones
⦁ Mitigation Detection: Automatically removes FVGs and Order Blocks when price fills them
⦁ Duplicate Sweep Prevention: 10-bar lookback prevents multiple signals at same level
Adaptive Trading Modes
Three pre-configured modes automatically adjust all parameters:
⦁ Scalping: Tight stops, quick targets, 15-minute to 1-hour focus
⦁ Day Trading: Balanced approach, 4-hour to daily analysis
⦁ Swing Trading: Wide stops, extended targets, daily to weekly perspective
⦁ Custom Mode: Full manual control of all parameters
Signal Quality Management
⦁ Conservative: Requires 5/7 confluence factors, tighter sweep threshold (5 ticks), 50% minimum rejection
⦁ Balanced: Standard 3/7 confluence, moderate threshold (10 ticks), 30% rejection
⦁ Aggressive: Only 2/7 confluence needed, wider threshold (15 ticks), 20% rejection
Visual Components & Dashboard
Real-Time Information Panel
Displays current market conditions including:
⦁ Active trading mode and quality settings
⦁ Timeframe configuration (HTF/MTF/LTF)
⦁ Market bias from higher timeframes
⦁ Current kill zone status
⦁ Liquidity sweep detection status
⦁ Confluence scoring for both directions
⦁ Risk parameters and targets
Trade Visualization
⦁ Entry, stop-loss, and three take-profit levels with precise price labels
⦁ Automatic cleanup when targets are hit or new signals appear
⦁ Maximum of one active setup displayed for chart clarity
⦁ Color-coded boxes for Fair Value Gaps and Order Blocks
How to Use This Indicator
Recommended Timeframes
⦁ Scalping Mode: 1-minute to 5-minute charts
⦁ Day Trading Mode: 5-minute to 15-minute charts
⦁ Swing Trading Mode: 1-hour to 4-hour charts
Optimal Market Conditions
⦁ Works best in ranging or trending markets with clear support/resistance levels
⦁ Most effective during high-liquidity sessions (London/New York overlap)
⦁ Avoid using during major news events unless specifically targeting news-driven sweeps
Signal Interpretation
1. Wait for triangle signal (up/down) with confluence score
2. Verify the swept level shown in the dashboard
3. Confirm risk-reward ratios match your trading plan
4. Enter at market or set limit order at indicated entry level
5. Place stop-loss and take-profit orders at displayed levels
Customization Tips
⦁ Adjust Signal Quality based on market volatility (Conservative for volatile, Aggressive for quiet)
⦁ Modify sweep threshold if getting too many/few signals
⦁ Toggle individual liquidity levels based on their relevance to your timeframe
⦁ Use Kill Zone filter for session-specific trading
Risk Disclaimer
This indicator identifies potential trade setups based on liquidity sweep patterns but does not guarantee profitable outcomes. Past performance does not indicate future results. Always use proper risk management and never risk more than you can afford to lose. The indicator should be used as part of a comprehensive trading plan that includes your own analysis and risk tolerance assessment.

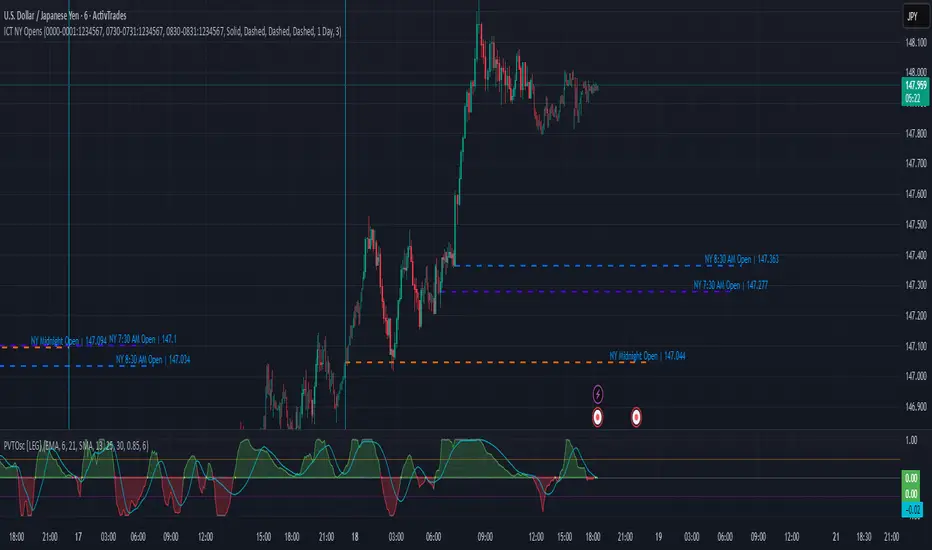
ICT NY Opens (Midnight, 7:30 & 8:30) True📌 ICT NY Opens Fixed (Midnight, 7:30 & 8:30) TRUE
This indicator is designed for traders following ICT (Inner Circle Trader) concepts and provides precise reference levels for the most relevant New York session opens. It automatically captures and plots the opening price for Midnight (00:00 NY), 7:30 AM, and 8:30 AM (configurable), letting you use them as liquidity anchors, manipulation zones, or institutional reference points.
🔑 Key Features
Fixed New York Opens (configurable)
Midnight (00:00 NY), 7:30 AM (NY), 8:30 AM (NY) — each open is captured from the first bar of the configured session.
Sessions are editable: the indicator exposes input.session fields for each open, so you can change the exact hour/minute (e.g., set 00:00 → 23:30 or 08:30 → 08:00). The lines and levels will follow the chosen session times.
Extension & Custom Hours (explicit)
Preset extensions: 1 Day or 2 Days (the horizontal line spans that period).
Directional extension: Right (extend to the right) or Both (left & right).
Custom Hours option: enable a custom-hours toggle and enter a specific number of hours (1–23). When enabled, horizontal lines extend for the exact number of hours you enter instead of the preset day lengths.
Labels are positioned relative to the extension setting (anchored at the open or after the extension depending on the selected mode).
Customizable visuals
Show/hide each open individually.
Independent color and line-style (solid / dotted / dashed) for each open.
Separate text color for labels.
Automatic Labels & Vertical Line
Each drawn level includes an automatic label with the open name and the exact opening price.
A dedicated vertical line option exists for the Midnight open (visual daily separator).
⚙️ How it behaves (precision & workflow)
The script detects the first bar inside the session you configure and records that bar's open as the session Open price.
If you change the session string/time in settings, the indicator will use the new time going forward and draw the corresponding level at that session's opening bar.
Extensions respect either the preset days or the custom hours you specify, so you can make lines last a precise number of hours (useful for intraday setups).
🧭 Use Cases
Pinpoint liquidity clusters and anticipate stop hunts near session opens.
Use as range anchors to measure intraday deviations.
Monitor reactions around economic releases and futures opens (7:30 / 8:30).
Integrate into ICT-based scalping or swing setups where precise session timing matters.
ICT Entry Models (Riz)The ICT Entry Models Indicator is a complete framework built to help traders visualize and apply multiple Institutional concepts on a single chart. Instead of relying on one entry technique, this tool combines 14+ ICT entry models and evaluates them under a unified structure. Each model is detected independently but filtered through a multi-factor confluence engine that considers liquidity, higher-timeframe structure, premium/discount zones, and session context. This ensures only high-probability setups are highlighted.
What This Indicator Does
⦁ Detects and plots ICT-based entry models such as: Fair Value Gaps, Order Blocks, Breakers, Liquidity Grabs, Stop Hunts, Asian Range Breakouts, Silver Bullet setups, Power of Three, Judas Swing, Unicorn model, Market Maker models, Previous Day High/Low breaks, and others.
⦁ Automatically validates entries using higher timeframe confirmation and confluence filters.
⦁ Provides risk management tools with structural stop-loss, ATR-based SL, TP1/TP2 targets, and R:R calculations.
⦁ Displays visual trade labels showing direction, strength, and expected risk/reward.
⦁ Includes a performance dashboard that tracks win rates, session stats, and risk outcomes.
How It Works
Each entry model is activated through custom detection logic. The script checks for key conditions like displacement, imbalance, BOS/CHoCH, liquidity sweeps, and premium/discount zones. When multiple models align, the indicator assigns a signal strength rating.
⦁ Weak setups: Highlighted but marked lower confidence.
⦁ Strong setups: Require confluence of liquidity, structure, and time-based filters (e.g., killzones).
⦁ The indicator then calculates a safe stop-loss placement (always on the correct side of price) and take-profit levels based on Goldbach ratios and volatility expansion.
Inputs
⦁ Model Toggles: Enable/disable individual entry models (e.g., FVG only, OB only, or full confluence).
⦁ Confluence Filters: Higher-timeframe structure, premium/discount zones, volatility thresholds.
⦁ Risk Management Settings: ATR multiplier, fixed SL/TP options, R:R target adjustments.
⦁ Dashboard & Visuals: Choose which stats, labels, and levels appear on chart.
How to Use
1. Apply the indicator to any forex, crypto, or index chart.
2. Select your timeframe. For scalping, use 1–5m with HTF confirmation. For day/swing trades, use 15m–1H with HTF overlays.
3. Toggle your preferred entry models (e.g., FVG + Liquidity Sweep) or enable all for confluence.
4. Watch for strong confluence signals: entry marker + calculated SL/TP + dashboard confirmation.
5. Use the signals as decision support not as automated buy/sell triggers.
Notes & Tips
Best used in liquid markets (Majors, Gold, Indices, BTC/ETH).
HTF confirmation greatly improves accuracy e.g., align 1m entries with 15m structure.
Combining time-based models (Silver Bullet, Killzones) with structural models improves precision.
Disclaimer
This tool is for educational and research purposes only. It is not financial advice, nor does it guarantee profitability. All trading involves risk, and users should test thoroughly before applying live.

ICT FVG Buy/Sell SignalsThis bot is built on ICT (Inner Circle Trader) concepts such as:
Fair Value Gaps (FVGs) – imbalance zones between candles.
Consequent Encroachment (CE) – the midpoint of a gap.
Premium / Discount Arrays – dealing ranges split into premium (sell-side) and discount (buy-side) zones.
Displacement candles – strong impulsive moves that confirm intent.
The bot scans for FVGs, marks CE levels, and waits for price to return to these levels.
When price revisits a valid FVG zone with displacement confirmation and in the correct PD array, the bot generates a BUY or SELL signal.
✅ Signal Rules
Buy Signal
Price trades back into a Bullish FVG.
Current bar shows bullish displacement (large bullish body relative to ATR).
Price is in discount territory of the current dealing range (if PD filter is enabled).
Close is above the CE line of the FVG.
Sell Signal
Price trades back into a Bearish FVG.
Current bar shows bearish displacement.
Price is in premium territory of the current dealing range.
Close is below the CE line of the FVG.
🎯 What You’ll See on the Chart
Green “BUY” labels below candles when long signals trigger.
Red “SELL” labels above candles when short signals trigger.
Shaded background:
Red = Premium zone (sell side).
Teal = Discount zone (buy side).
Yellow line = dealing range midpoint (equilibrium).
Dots on CE lines = midpoints of the latest bullish/bearish FVG.
🔔 Alerts
ICT Buy → Triggers when a bullish setup confirms.
ICT Sell → Triggers when a bearish setup confirms.
You can connect these alerts to:
TradingView notifications.
Webhooks (for brokers or bots like MetaTrader, NinjaTrader, or Discord).
⚙️ Settings
Swing length – how many bars to use when detecting swing highs/lows for the dealing range.
Use PD filter – toggle ON/OFF for requiring discount/premium alignment.
Displacement ATR multiple – how strong the candle body must be compared to ATR to count as a displacement.
ATR length – used for displacement filter.
📈 Supported Markets
Works on all symbols and timeframes.
Commonly applied to:
NASDAQ (NQ, QQQ)
S&P500 (ES, SPX, SPY)
Forex pairs
Crypto (BTC, ETH, etc.)
⚠️ Disclaimer
This bot is for educational purposes only. It does not guarantee profits and should be tested on demo accounts first.
Always apply proper risk management before trading live.

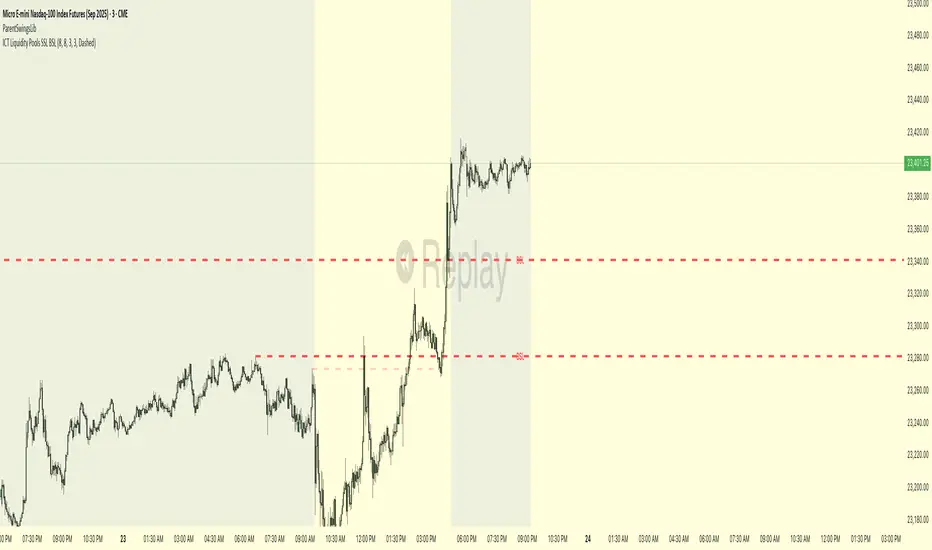
ICT Liquidity Pools SSL BSLParent Swings - ICT Liquidity Pools (BSL & SSL)
This indicator is designed to cut through the noise of the market and identify truly significant swing points. Instead of marking every minor high and low, it uses the powerful logic of ICT (Inner Circle Trader) breaker patterns to validate and draw only the "Parent Swings" that matter. These are the key liquidity pools that often act as the market's next target.
The Concept: Price Moves from Pool to Pool
A core concept taught by ICT is that price doesn't move randomly; it moves with purpose. The market is engineered to move from one pool of liquidity to the next.
Buy Side Liquidity (BSL): This is a pool of stop-loss orders resting just above a significant swing high. The market is often drawn upwards to "sweep" this liquidity.
Sell Side Liquidity (SSL): This is a pool of stop-loss orders resting just below a significant swing low. The market is often drawn downwards to sweep this liquidity.
This indicator identifies these key BSL and SSL levels after they have been confirmed by a shift in market structure, giving you a clear map of potential targets.
How It Works
The indicator doesn't just look for any swing high or low. It waits for a specific sequence of events to confirm that a swing is a "Parent Swing" and a valid liquidity pool:
Liquidity Sweep: First, it looks for a classic liquidity raid. For a significant high (BSL), it needs to see a swing high get taken out by a higher high. For a significant low (SSL), it needs to see a swing low get taken out by a lower low.
Market Structure Shift (MSS): After the liquidity sweep, the indicator waits for confirmation that the market's intention has changed. This happens when price breaks aggressively in the opposite direction, creating a breaker block pattern.
Confirmation: Only when both the liquidity sweep and the market structure shift are confirmed does the indicator draw the line, marking the swing as a valid BSL or SSL level.
How to Use This Indicator
The primary use for this indicator is to identify targets. Once a BSL (red line) or SSL (green line) is established, you can anticipate that the market will eventually make a run for that level.
If you are in a long position, the next BSL line above you can serve as a logical take-profit target.
If you are in a short position, the next SSL line below you can serve as a logical take-profit target.
The labels (BSL/SSL) will always stay with the current price action for active levels, making it easy to see your targets at a glance.
Settings
Pivot Lookback: Controls the sensitivity of the swing detection. A higher number will find larger, more significant liquidity pools.
Invalidation Threshold (Crossings): This is a key feature. It sets how many times the price must cross through a liquidity level before it's considered "used up" or invalidated. Once invalidated, the line will dim and the label will disappear, keeping your chart clean.
Disclaimer: This is a tool for technical analysis and should not be considered financial advice. Always use proper risk management and integrate this indicator with your own trading strategy.
ICT SMT (fadi)The ICT SMT (fadi) Indicator is a powerful indicator inspired by the Inner Circle Trader (ICT) methodology, designed to identify Smart Money Technique (SMT) divergences between correlated assets. This indicator helps traders spot potential reversal points or trend shifts by comparing price action of a user-defined symbol (e.g., “ES1!” for E-mini S&P 500 futures) against the current chart’s price structure. Ideal for forex, indices, futures, and crypto markets, it highlights discrepancies in correlated asset behavior to enhance trading decisions.
These discrepancies occur when one asset shows signs of strength—such as holding support or rallying—while the other weakens or drops, signaling potential manipulation or a shift in smart money activity. This is relevant because it reveals where institutional traders may be accumulating or distributing positions, giving insight into impending trend changes. This indicator offers higher accuracy and detects nearly every SMT present on the chart by calculating multiple possibilities.
Features
• Smart Algorithmic detection of high probability SMTs
• Detect SMT with two other symbols
• Detect 2-Candle SMT as an additional configurable option
• Confirmation and Invalidation levels
• Expand or narrow the detection range by changing the number of pivots to use
• Raise alerts when SMT has been detected
Usage
1. Apply the indicator to your chart.
2. In the settings, input a correlated symbol (e.g., “NQ1!” for Nasdaq futures if charting “ES1!”, or “EURUSD” if analyzing “GBPUSD”).
3. Monitor the plotted markers and labels:
• Green markers for bullish divergences.
• Red markers for bearish divergences.
4. Combine with other ICT concepts (e.g., order blocks, liquidity zones) for higher-probability setups.
Best Practices
• Pair with strongly correlated assets (e.g., ES vs. NQ, EURUSD vs. GBPUSD) for reliable signals.
• Backtest on your chosen market to confirm effectiveness.

ICT Setup 02 [TradingFinder] Breaker Blocks + Reversal Candles🔵 Introduction
The "Breaker Block" concept, widely utilized in ICT (Inner Circle Trader) technical analysis, is a crucial tool for identifying reversal points and significant market shifts. Originating from the "Order Block" concept, Breaker Blocks help traders pinpoint support and resistance levels. These blocks are essential for understanding market trends and recognizing optimal entry and exit points.
A Breaker Block is essentially a failed Order Block that changes its role when price action breaks through it. When an Order Block fails to hold as a support or resistance level, it reverses its function, becoming a Breaker Block.
There are two primary types : Bullish Breaker Blocks and Bearish Breaker Blocks. These Breaker Blocks align with the prevailing market trend and indicate potential entry points after a liquidity sweep or a shift in market structure.
Understanding and applying the Breaker Block strategy enables traders to capitalize on the behavior of institutional investors, enhancing their trading outcomes.
Bullish Setup :
Bearish Setup :
🔵 How to Use
The ICT Setup 02 indicator designed to automate the identification of Bullish and Bearish Breaker Blocks. This tool enables traders to easily spot these blocks on a chart and utilize them for entering or exiting trades. Below is a breakdown of how to use this indicator in both bullish and bearish setups.
🟣 Bullish Breaker Block Setup
A Bullish Breaker Block setup is identified in an uptrend, where it serves as a potential entry point. This setup occurs when a Bearish Order Block fails and the price moves above the high of that Order Block. In this scenario, the previously bearish Order Block turns into a Bullish Breaker Block, which now acts as a support level for the price.
To trade a Bullish Breaker Block, wait for the price to retest this newly formed support level. Confirmation of the uptrend can be achieved by analyzing lower time frames for further market structure shifts or other bullish indicators.
A successful retest of the Bullish Breaker Block provides a high-probability entry point for a long trade, as it signals institutional support. Traders often place their stop-loss below the low of the Breaker Block zone to minimize risk.
🟣 Bearish Breaker Block Setup
A Bearish Breaker Block setup, conversely, is used in a downtrend to identify potential sell opportunities. This setup forms when a Bullish Order Block fails, and the price moves below the low of that Order Block.
Once this Order Block is broken, it reverses its role and becomes a Bearish Breaker Block, providing resistance to the price as it pushes downward. For a Bearish Breaker Block trade, wait for the price to retest this resistance level.
A confirmation of the downtrend, such as a market structure shift on a lower time frame or additional bearish signals, strengthens the setup. The Bearish Breaker Block retest provides an opportunity to enter a short position, with a stop-loss placed just above the high of the Breaker Block zone.
🔵 Settings
Pivot Period : This setting controls the look-back period used to identify pivot points that contribute to the detection of Order Blocks. A higher period captures longer-term pivots, while a lower period focuses on more recent price action. Adjusting this parameter allows traders to fine-tune the indicator to match their trading time frame.
Breaker Block Validity Period : This setting defines how long a Breaker Block remains valid based on the number of bars elapsed since its formation. Increasing the validity period keeps Breaker Blocks active for a longer duration, which can be useful for higher time frame analysis.
Mitigation Level BB : This option lets traders choose the level of the Order Block at which the price is expected to react. Options like "Proximal," "50% OB," and "Distal" adjust the zone where a reaction may occur, offering flexibility in setting up the entry and stop-loss levels.
Breaker Block Refinement : The refinement option refines the Breaker Block zone to display a more precise range for aggressive or defensive trading approaches. The "Aggressive" mode provides a tighter range for risk-tolerant traders, while the "Defensive" mode expands the zone for those with a more conservative approach.
🔵 Conclusion
The Breaker Block indicator provides traders with a sophisticated tool for identifying key reversal zones in the market. By leveraging Breaker Blocks, traders can gain insights into institutional order flow and predict critical support and resistance levels.
Using Breaker Blocks in conjunction with other ICT concepts, like Fair Value Gaps or liquidity sweeps, enhances the reliability of trading signals. This indicator empowers traders to make informed decisions, aligning their trades with institutional moves in the market.
As with any trading strategy, it is crucial to incorporate proper risk management, using stop-losses and position sizing to minimize potential losses. The Breaker Block strategy, when applied with discipline and thorough analysis, serves as a powerful addition to any trader’s toolkit.

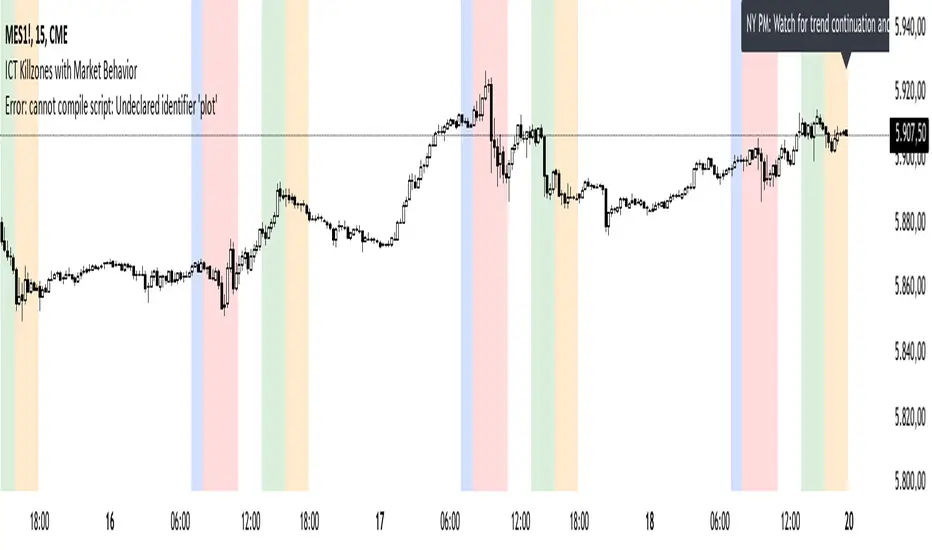
ICT Killzones with Market BehaviorIndicator Title: ICT Killzones with Market Behavior
Description:
Introducing the ICT Killzones with Market Behavior indicator, a powerful tool designed for traders looking to capitalize on key trading timeframes in the New York session.
Key Features:
Visual Timeframes: This indicator highlights essential trading periods, including Pre-Market, NY Open, NY Lunch, and NY PM sessions. These visual markers help you quickly identify when the market is likely to experience heightened activity and liquidity.
Real-Time Insights: Stay informed with dynamic text displayed at the top of your chart. The indicator updates in real-time, providing actionable insights on what to expect during each session—whether it’s volatility, consolidation, or potential trend continuation.
Custom Color Options: Tailor the color settings for each killzone to fit your personal trading style and enhance the visual clarity of your chart.
User-Friendly Design: Built with simplicity in mind, this indicator integrates seamlessly into TradingView, making it easy for traders of all experience levels to utilize.
How to Use:
Add to Your Chart: Integrate the ICT Killzones with Market Behavior indicator into your TradingView setup.
Monitor Market Conditions: Keep an eye on the highlighted timeframes and the real-time insights displayed at the top. This information can guide your trading strategy effectively.
Adjust Your Approach: Use the insights from the indicator to modify your trading decisions based on the expected market behavior during each session.
Note: This indicator is for educational purposes only and should not be interpreted as financial advice. Always perform your own research and assess risks before making any trading decisions.
ICT Market Structure Screener (Zeiierman)█ Overview
The ICT Market Structure Screener (Zeiierman) is designed to identify and display key market structure levels and patterns based on Smart Money Concepts. It highlights bullish and bearish structures, premium and discount levels, and generates alerts for significant market structure changes, making it a valuable tool for traders looking to understand institutional trading behaviors and market trends. A key feature of this indicator is its screener function, which allows traders to monitor multiple symbols simultaneously. This feature provides a consolidated view of the market structure for various assets, making it easier to identify trading opportunities across a diverse portfolio.
█ How It Works
The ICT Market Structure Screener operates by identifying high and low pivot points within a specified period, then analyzing these pivots to determine changes in market structure. The indicator tracks price movements and categorizes them into bullish or bearish structures, indicating potential trend reversals or continuations. By plotting premium and discount levels, it helps traders identify overbought and oversold conditions. The indicator also provides real-time updates and alerts for significant changes in the market structure.
█ Terminology
ChoCH (Change of Character): Indicates a potential reversal in market direction. It is identified when the price breaks a significant high or low, suggesting a shift from a bullish to bearish trend or vice versa.
SMS (Smart Money Shift): Represents the transition phase in market structure where smart money begins accumulating or distributing assets. It typically follows a BMS and indicates the start of a new trend.
BMS (Bullish/Bearish Market Structure): Confirms the trend direction. Bullish Market Structure (BMS) confirms an uptrend, while Bearish Market Structure (BMS) confirms a downtrend. It is characterized by a series of higher highs and higher lows (bullish) or lower highs and lower lows (bearish).
Premium: A zone where the price is considered overbought. It is calculated as the upper range of the current market structure and indicates a potential area for selling or shorting.
Mid Range: The midpoint between the high and low of the market structure. It often acts as a support or resistance level, helping traders identify potential reversal or continuation points.
Discount: A zone where the price is considered oversold. It is calculated as the lower range of the current market structure and indicates a potential area for buying or going long.
█ How to Use
The ICT Market Structure Screener allows traders to follow smart money moves in the market more effectively. By identifying key market levels and monitoring bullish and bearish structures, traders can easily spot trend changes and strong trends. The indicator's premium and discount levels help identify overbought and oversold conditions, providing valuable entry and exit points. Alerts for ChoCH, SMS, and BMS keep traders informed about significant market changes, enabling real-time adjustments to trading strategies.
The screener functionality is particularly valuable for monitoring multiple markets simultaneously. The screener table displays critical information such as current price, trend direction, signal type, and premium/discount levels for each symbol. This makes it easier to track the market structure of various assets at a glance and quickly identify trading opportunities across different markets.
Example Strategies:
⚪ Trend Following: Use the indicator to identify the current market trend (bullish or bearish) and trade in the direction of the trend. Enter trades on pullbacks to premium (for shorts) or discount (for longs) levels.
⚪ Reversal Trading: Look for ChoCH signals to identify potential trend reversals. Enter trades when the price breaks a significant high or low and confirms a change in market structure, or wait for a retest of the nearest Orderblock that was formed.
⚪ Support and Resistance: Utilize the mid-range, premium, and discount levels as support and resistance zones. Enter trades when the price approaches these levels and shows signs of reversal or continuation.
⚪ Multi-Symbol Analysis: Use the screener table to monitor multiple symbols and quickly assess their market structure. This helps in diversifying trading opportunities and managing a portfolio of assets efficiently.
█ Settings
Period: The pivot period for calculating the structure. Increasing the period captures broader trends, making the structure more representative of long-term movements. Decreasing the period focuses on shorter-term trends, increasing sensitivity.
Response: Enabling this option uses the response period instead of the pivot period, providing more flexibility in capturing short-term or long-term structures. The period for the response, which determines the structure's sensitivity. Increasing the response period smoothens the structure, making it less reactive to short-term fluctuations. Decreasing the response period makes the structure more responsive to short-term changes.
Structure Display: Choose between displaying the active range or the previous range. 'Active Range' shows real-time premium, discount, and mid-range levels based on the current structure. 'Previous Range' displays past ranges, useful for analyzing historical support/resistance levels.
Ticker Symbols: List of symbols to include in the screener. Enabling the option includes the symbol in the screener, allowing the user to track its structure. Disabling it excludes the symbol from the screener, reducing the number of tracked symbols.
-----------------
Disclaimer
The information contained in my Scripts/Indicators/Ideas/Algos/Systems does not constitute financial advice or a solicitation to buy or sell any securities of any type. I will not accept liability for any loss or damage, including without limitation any loss of profit, which may arise directly or indirectly from the use of or reliance on such information.
All investments involve risk, and the past performance of a security, industry, sector, market, financial product, trading strategy, backtest, or individual's trading does not guarantee future results or returns. Investors are fully responsible for any investment decisions they make. Such decisions should be based solely on an evaluation of their financial circumstances, investment objectives, risk tolerance, and liquidity needs.
My Scripts/Indicators/Ideas/Algos/Systems are only for educational purposes!

ICT IPDA Liquidity Matrix By AlgoCadosThe ICT IPDA Liquidity Matrix by AlgoCados is a sophisticated trading tool that integrates the principles of the Interbank Price Delivery Algorithm (IPDA), as taught by The Inner Circle Trader (ICT). This indicator is meticulously designed to support traders in identifying key institutional levels and liquidity zones, enhancing their trading strategies with data-driven insights. Suitable for both day traders and swing traders, the tool is optimized for high-frequency and positional trading, providing a robust framework for analyzing market dynamics across multiple time horizons.
# Key Features
Multi-Time Frame Analysis
High Time Frame (HTF) Levels : The indicator tracks critical trading levels over multiple days, specifically at 20, 40, and 60-day intervals. This functionality is essential for identifying long-term trends and significant support and resistance levels that aid in strategic decision-making for swing traders and positional traders.
Low Time Frame (LTF) Levels : It monitors price movements within 20, 40, and 60-hour intervals on lower time frames. This granularity provides a detailed view of intraday price actions, which is crucial for scalping and short-term trading strategies favored by day traders.
Daily Open Integration : The indicator includes the daily opening price, providing a crucial reference point that reflects the market's initial sentiment. This feature helps traders assess the market's direction and volatility, enabling them to make informed decisions based on the day's early movements, which is particularly useful for day trading strategies.
IPDA Reference Points : By leveraging IPDA's 20, 40, and 60-period lookbacks, the tool identifies Key Highs and Lows, which are used by IPDA as Draw On Liquidity. IPDA is an electronic and algorithmic system engineered for achieving price delivery efficiency, as taught by ICT. These reference points serve as benchmarks for understanding institutional trading behavior, allowing traders to align their strategies with the dominant market forces and recognize institutional key levels.
Dynamic Updates and Overlap Management : The indicator is updated daily at the beginning of a new daily candle with the latest market data, ensuring that traders operate with the most current information. It also features intelligent overlap management that prioritizes the most relevant levels based on the timeframe hierarchy, reducing visual clutter and enhancing chart readability.
Comprehensive Customization Options : Traders can tailor the indicator to their specific needs through an extensive input menu. This includes toggles for visibility, line styles, color selections, and label display preferences. These customization options ensure that the tool can adapt to various trading styles and preferences, enhancing user experience and analytical capabilities.
User-Friendly Interface : The tool is designed with a user-friendly interface that includes clear, concise labels for all significant levels. It supports various font families and sizes, making it easier to interpret and act upon the displayed data, ensuring that traders can focus on making informed trading decisions without being overwhelmed by unnecessary information.
# Usage Note
The indicator is segmented into two key functionalities:
LTF Displays : The Low Time Frame (LTF) settings are exclusive to timeframes up to 1 hour, providing detailed analysis for intraday traders. This is crucial for traders who need precise and timely data to make quick decisions within the trading day.
HTF Displays : The High Time Frame (HTF) settings apply to the daily timeframe and any shorter intervals, allowing for comprehensive analysis over extended periods. This is beneficial for swing traders looking to identify broader trends and market directions.
# Inputs and Configurations
BINANCE:BTCUSDT
Offset: Adjustable setting to shift displayed data horizontally for better visibility, allowing traders to view past levels and make informed decisions based on historical data.
Label Styles: Choose between compact or verbose label formats for different levels, offering flexibility in how much detail is displayed on the chart.
Daily Open Line: Customizable line style and color for the daily opening price, providing a clear visual reference for the start of the trading day.
HTF Levels: Configurable high and low lines for HTF with options for style and color customization, allowing traders to highlight significant levels in a way that suits their trading style.
LTF Levels: Similar customization options for LTF levels, ensuring flexibility in how data is presented, making it easier for traders to focus on the most relevant intraday levels.
Text Utils: Settings for font family, size, and text color, allowing for personalized display preferences and ensuring that the chart is both informative and aesthetically pleasing.
# Advanced Features
Overlap Management : The script intelligently handles overlapping levels, particularly where multiple timeframes intersect, by prioritizing the more significant levels and removing redundant ones. This ensures that the charts remain clear and focused on the most critical data points, allowing traders to concentrate on the most relevant market information.
Real-Time Updates : The indicator updates its calculations at the start of each new daily bar, incorporating the latest market data to provide timely and accurate trading signals. This real-time updating is crucial for traders who rely on up-to-date information to execute their strategies effectively and make informed trading decisions.
# Example Use Cases
Scalpers/Day traders: Can utilize the LTF features to make rapid decisions based on hourly market movements, identifying short-term trading opportunities with precision.
Swing Traders: Will benefit from the HTF analysis to identify broader trends and key levels that influence longer-term market movements, enabling them to capture significant market swings.
By providing a clear, detailed view of key market dynamics, the ICT IPDA Liquidity Matrix by AlgoCados empowers traders to make more informed and effective trading decisions, aligning with institutional trading methodologies and enhancing their market understanding.
# Usage Disclaimer
This tool is designed to assist in trading decisions, but it should be used in conjunction with other analysis methods and risk management strategies. Trading involves significant risk, and it is essential to understand the market conditions thoroughly before making trading decisions.

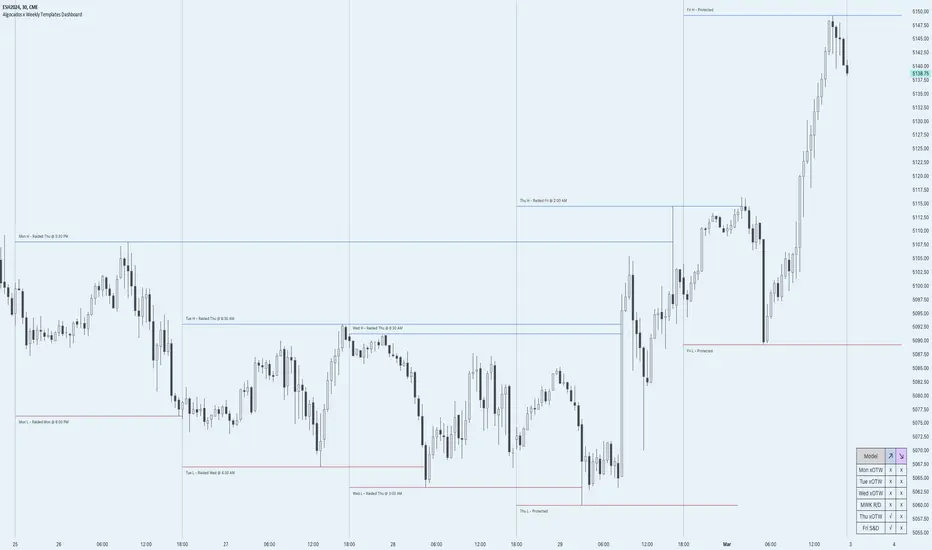
ICT Weekly Profile Templates Dashboard by AlgoCadosThe ICT Weekly Profile Templates Dashboard is a tool meticulously crafted to integrate ICT Weekly Profiles and enrich your trading approach with profound insights. It provides a real-time analysis of market sessions, Daily Session Opens openings, and potential Points of Interest (POI) within the week, It outlines 12 profiles, serving as a roadmap with enhanced precision. By breaking down the trading week into specific profiles, it provides a clear framework to navigate market fluctuations.
# Key Features
Weekly Templates Dashboard : An advanced feature supported by an easy-to-understand table that lists all 12 profiles, simplifying the process of identifying current market scenarios and potential future movements.
Intraweek POI : Identifies key intraweek levels of interest (Daily Highs / Daily Lows) with configurable visual styles. Distinguish between buyside and sellside POIs with solid, dotted, or dashed lines in colors that stand out or blend in, according to your preference.
POI Raids Insights : Automatically updates the lines and label of a key level once it gets broken, highlighting the time when the high or low was taken out,.to provide a comprehensive overview of weekly market dynamics.
Customization at its Core : With inputs for line styles, colors, and even font specifications for text and labels, the dashboard is fully customizable to fit your charting needs. Whether you prefer solid lines for emphasis or dotted lines for a more subdued look, the choice is yours.
Utility and Style : The script doesn't just offer functional benefits; it also considers aesthetics. Choose from Monospace or Sans Serif fonts and adjust the size to ensure that your dashboard is not only informative but also visually pleasing.
# ICT Weekly Pattern
"xOTW" serves as placeholder for "LOTW" (Low of the Week) and "HOTW" (High of the Week). This visual shorthand allows traders to quickly interpret market conditions, with a combination of "xOTW" alongside directional arrows "↗" (Bullish) and "↘" (Bearish).
Bullish Patterns Analyzed
Mon LOTW: Monday Low Of The Week / Classic Buy Week;
Tue LOTW: Tuesday Low Of The Week / Classic Buy Week;
Wed LOTW: Wednesday Low of the Week;
MWK R: Consolidation Midweek Rally;
Thu LOTW: Thursday Low Of The Week / Consolidation Thursday Reversal (Bullish);
Fri S&D: Seek and Destroy Bullish Friday;
Bearish Patterns Analyzed
Mon HOTW: Monday High Of The Week / Classic Sell Week;
Tue HOTW: Tuesday High Of The Week / Classic Sell Week;
Wed HOTW: Wednesday High of the Week;
MWK D: Consolidation Midweek Decline;
Thu HOTW: Thursday High Of The Week / Consolidation Thursday Reversal (Bearish);
Fri S&D: Seek and Destroy Bearish Friday;
# Inputs
Offset: Adjusts the offset for the daily open marker, allowing users to shift the position of the session start visual cue on the chart.
Show Historic Data: Toggles the display of historical session data, enabling traders to either keep a continuous record of sessions throughout the chart or reset data at the start of each new week.
CME_MINI:ESH2024
Show Session Start: Activates vertical dividers at the start of each trading session, providing a clear demarcation of session boundaries.
Show Session Open: Displays the opening price for each session, offering immediate visual cues to the session's starting strength or weakness.
Extend Session Open: Extends the session's opening price line to the current bar, giving a persistent reference point throughout the trading session.
CME_MINI:ESH2024
Intraweek POI Styles and Colors
Start Line Style: Customizes the style of session start lines with options for solid, dotted, or dashed appearances.
Start Line Color: Chooses the color for session start lines, enhancing chart readability.
Daily Open Style and Color: Sets the style and color for the daily open lines, distinguishing them from other chart elements.
Buyside Line Style and Color: Adjusts the visualization of potential buyside areas of interest with customizable line styles and colors.
Sellside Line Style and Color: Configures the display for potential sellside points of interest, allowing for distinct visual differentiation.
Utils for Aesthetics and Clarity
Font Family and Size: Selects the font family and size for text elements within the indicator, ensuring clarity and consistency with your chart's aesthetic.
Text and Background Colors: Defines the color for text and background elements, facilitating a harmonious integration with the chart's overall color scheme.
CME_MINI:ESH2024
Embrace the essence of smarter trading where every insight is "Healthy For Your Trading."
ICT Unicorn Model [LuxAlgo]The ICT Unicorn Model indicator highlights the presence of "unicorn" patterns on the user's chart which is derived from the lectures of "The Inner Circle Trader" (ICT) .
Detected patterns are followed by targets with a distance controlled by the user.
🔶 USAGE
At its core, the ICT Unicorn Model relies on two popular concepts, Fair Value Gaps and Breaker Blocks. This combination highlights a future area of support/resistance.
A Bullish Unicorn Pattern consists out of:
A Lower Low (LL), followed by a Higher High (HH)
A Fair Value Gap (FVG), overlapping the established Breaker Block
A successful re-test of the FVG which confirms the pattern.
A Bearish Unicorn Pattern consists of:
A Higher High (HH), followed by a Lower Low (LL)
A Fair Value Gap (FVG), overlapping the established Breaker Block
A successful re-test of the FVG which confirms the pattern
The pattern detection depends on detected swings, which can be controlled by the Swing setting. Using higher values of this setting will return longer-term breaker blocks.
🔹 Using Risk/Reward Targets
A confirmed Unicorn pattern will show a blue ( Target ) / grey ( Stop Loss) "Risk/Reward" areas (RR).
When the Stop Loss or Target is hit, a white line is shown on the concerned side.
The Risk/Reward ratio can be adjusted in the "Targets" settings.
🔹 Trailing Stop
As seen in the previous snapshots, besides the RR areas, this indicator also includes an optional Trailing Stop .
This can be helpful to lower your risk, by exiting earlier than if you would wait until the Stop Loss is hit.
This example shows a successful bullish and bearish Unicorn Pattern . In this scenario, the Trailing Stop could be used for partial Take Profit.
The goal of this publication is to show confirmed Unicorn Patterns . To increase the chance of success, it is important to evaluate the bigger picture & use this in confluence with your price action analysis. For example, look for potential areas of liquidity, consider this pattern only during certain market sessions, avoid trading during heavy impact news, &/or incorporate other aspects of technical analysis rather than just following this pattern blindly.
🔶 DETAILS
🔹 Combine
When disabled, all potential Unicorn Patterns will delete previous unconfirmed patterns:
Enabling Combine ensures the last Unicorn Patterns in the opposite direction will remain.
While the latter bullish pattern became invalid, another one formed.
The combination of the previous bearish pattern, and looking at the big picture, the bullish pattern did not have much chance to be successful.
While disabling 'combine' helps minimize clutter, enabling this feature can give a pattern more chance to hit the SL/Target level.
🔹 Mitigated FVG
Users can determine if a pattern becomes invalid due to a mitigated FVG, causing the pattern to be deleted.
🔹 New pattern detected
When a new pattern is detected, the previous unconfirmed pattern in the same direction (bullish - bullish or bearish - bearish) will be deleted. This will always be the case, whether "Combine' is enabled or disabled.
When the previous pattern was confirmed but no SL or Target level was hit, this pattern will stop updating.
🔶 SETTINGS
🔹 Unicorn
Swings: This sets the length of swings, used for the underlying ZigZag and Unicorn Patterns detection.
Bull: Enable/disable Bullish patterns, and set the color of FVG box and Trailing Stop .
Bear: Enable/disable Bearish patterns, and set the color of FVG box and Trailing Stop .
Combine: When enabled, patterns in opposite directions (bullish/bearish) can exist at the same time. disabling this feature tends to give less clutter. See the "Usage" section for more information.
🔹 Targets
Risk/Reward: Sets the Risk/Reward ratio.
Trailing Stop: Set the length of small swings, which is used for the Trailing Stop .

ICT HTF MSS & Liquidity (fadi)ICT HTF MSS & Liquidity provides higher timeframe view of where the liquidity may reside and when higher timeframe market structure shift has occurred.
In his 2022 mentorship, ICT has advocated used the 15m chart to watch for liquidity and looking for lower timeframes for entry (5m,4m,3m,2m,1m).
Liquidity will reside above pivot points and ICT pivot points are based on 3 candle formation for the short term, three short term formation for intermediate, and three intermediate formation for the long terms.
Options
Timeframe Timeframe to monitor
Use the Short, Intermediate, or Long Term highs and lows
Liquidity Styles
Open liquidity line style, size, and color
Claimed liquidity line style, size, and color
Extend the open liquidity line beyond the current candle
Number of lines to display, this includes claimed and open

ICT Killzones + Pivots [TFO]Designed with the help of TTrades and with inspiration from the ICT Everything indicator by coldbrewrosh, the purpose of this script is to identify ICT Killzones while also storing their highs and lows for future reference, until traded through.
There are 5 Killzones / sessions whose times and labels can all be changed to one's liking. Some prefer slight alterations to traditional ICT Killzones, or use different time windows altogether. Either way, the sessions are fully customizable. The sessions will auto fit to keep track of the highs and lows made during their respective times, and these pivots will be extended until they are invalidated.
There are also 4 optional Open Price lines and 4 vertical Timestamps, where the user can change the time and style of each one as well.
To help maintain a clean chart, we can implement a Cutoff Time where all drawings will stop extending past a certain point. The indicator will apply this logic by default, as it can get messy with multiple drawings starting and stopping throughout the day at different times.
Given the amount of interest I've received about this indicator, I intend to leave it open to suggestions for further improvements. Let me know what you think & what you want to see added!

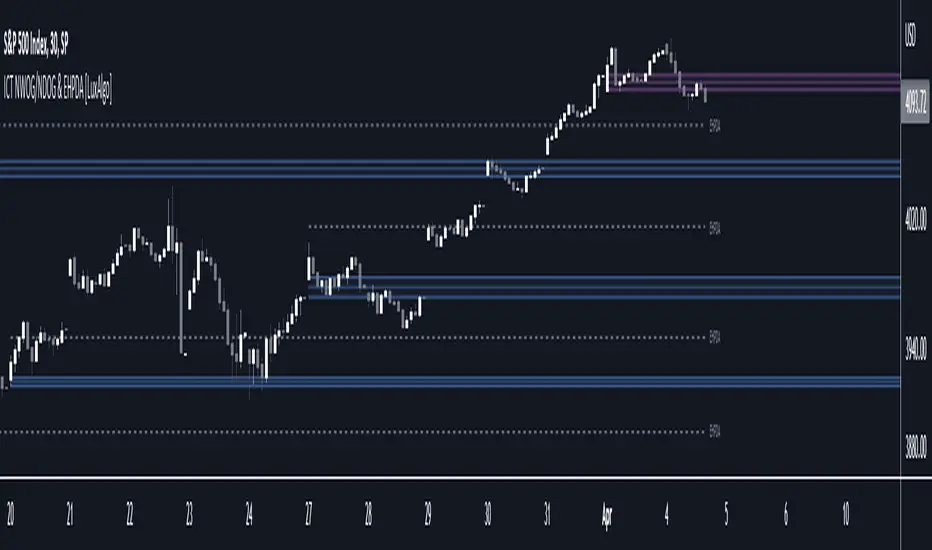
ICT NWOG/NDOG & EHPDA [LuxAlgo]This indicator displays New Week/Day Opening Gaps alongside Event Horizon PD Arrays which were conceptualized by a trader, ICT.
🔶 SETTINGS
Show: Determines if new week opening gaps (NWOG) or new day opening gaps (NDOG) are shown.
Amount: Controls the amount of most recent NWOGs/NDOGs to display on the chart.
Show EHPDA: Displays Event Horizons PD arrays.
🔶 USAGE
New Week/Day Opening Gaps are generally used as potential support or resistance areas.
Trader ICT describes that under consolidating market conditions, price tends to revert towards the opening gap area. This is consistent with other analysis suggesting that price has a tendency to come back toward gaps, ultimately looking to fill them.
ICT also introduces a novel concept, the "Event Horizon PD Array" (EHPDA) which are intermediary levels constructed from the average between the neighboring NWOGs or NDOGs.
EHPDA's are described by ICT as levels that "will not allow price to escape to the NWOG that will create a surge towards the NWOG it got too "close" to but has not yet reached."