ICT HTF FVGs (fadi)ICT HTF FVGs displays the higher timeframe FVGs on current chart. This allows the trader to easily visualize the higher timeframe FVGs without having to mark them manually and see when price reaches point of interest for possible reversals or reaction.
This indicator attempts to provide as much flexibility possible by being able to define the following:
Higher Timeframe Settings
Timeframe to monitor
Bullish FVG color for this timeframe
Bearish FVG color for this timeframe
Maximum number of FVGs to display for this timeframe
Distance from current bar. This prevents overcrowding of FVGs
Hide Lower Timeframes from current chart. If this option is turned off, 5m timeframe FVGs will be displayed on an hourly chart as an example.
Show Border for the FVGs. Border color is derived from the FVG color
Show Mitigated FVG on the chart. The labels are removed to prevent the labels from overlapping with the candles on the chart/
Show C.E. Draws a line at the middle point of the FVG. This is usually an area of interest.
Show Label Shows the label with label color, background color, and label size.
Cari dalam skrip untuk "ict"

ICT Daily BiasThis indicator is based on ICT's teaching - Daily Bias. Indicator tries to predict which direction (bias) the price will move in the near future and it can tell you in which direction should you take trades on the lower timeframe (buy or sell). It works on every timeframe but best to use on 1D timeframe. It can also show historical Daily Biases. Daily Bias can be BUY, SELL or NEUTRAL. If there is NEUTRAL Daily Bias then you should not take any trade because following price direction is not clear until the Daily Bias changes to BUY or SELL.
Current Daily Bias is shown in the right bottom corner.
Daily Bias can be calculated by 2 types: Previous H/L or Previous Swing H/L.
Previous H/L:
This calculation is based on previous H/L. If actual candle reaches previous high (red line by default) or low (green line by default) with wick then price should reverse into opposite direction. If actual candle closes with body above previous high (green line by default) or below previous low (red line by default) then price should continue in current direction. There are also colorful arrows showing the following daily bias based on previous candle.
Previous Swing H/L:
This calculation is based on previous untested swing H/L. If actual candle reaches previous untested swing high (red line by default) or low (green line by default) with wick then price should reverse into opposite direction. If actual candle closes with body above previous untested swing high (green line by default) or below previous untested swing low (red line by default) then price should continue in current direction. Lookleft and lookright period (default: 3) for swing H/L can be set in indicator settings. This period tells you how many candles left and right from the swing H/L need to be higher (swing low) or lower (swing high). Previous tested swing H/L are labeled by colorful (yellow by default) diamonds. There are also colorful arrows showing the following daily bias based on previous tested swing H/L.
All settings of this indicator should be self-explanatory and some of them have tooltips for better understanding.

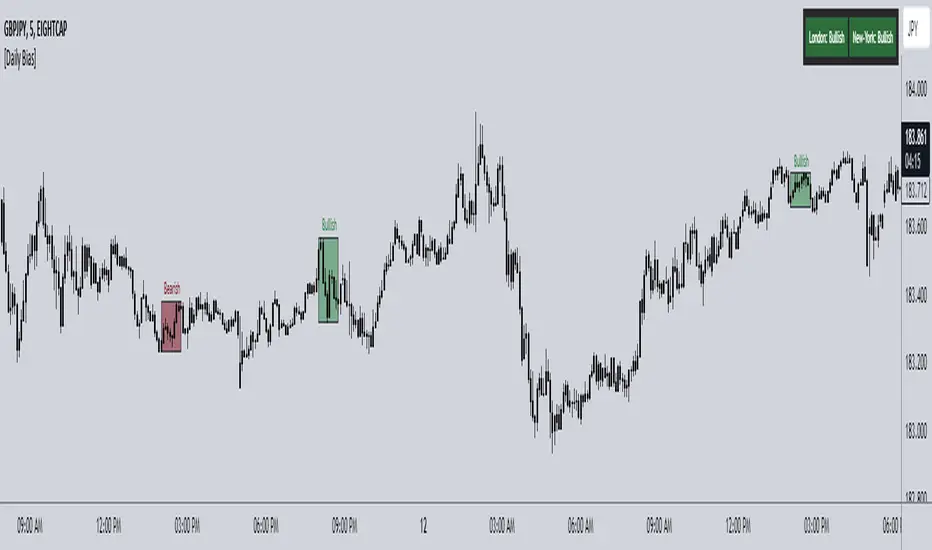
ICT Daily Bias Finder [DTCC]What is This?
The ICT Daily Bias Finder uses a method called "DTCC" to identify the London and New York session's bias, bullish or bearish. This indicator should only be relied on for 5 minute, and not other timeframes.
How do I use it?
Look at the previous days two boxes (labeled DTCC Bear/DTCC Bull), if both are bullish or both are bearish it is NOT recommended to rely on DTCC for that day. If the first one is bullish and second one is bearish, the DTCC for the next day says that London session will turn ABOVE midnight opening price, while New York will turn UNDER midnight opening price (longs in London, shorts in New York). If the second one is bearish and the first is bullish, the DTCC for the next day says that London session will turn UNDER midnight opening price, while New York will turn ABOVE midnight opening price (shorts in London, longs in New York)
Emoji guide to DTCC indicator:
🟢🟢: Don't trust DTCC for that day
🔴🔴: Don't trust DTCC for that day
🟢🔴: Longs in London above Midnight Opening Price, Shorts in New York under Midnight Opening Price
🔴🟢: Shorts in London under Midnight Opening Price, Longs in New York under Midnight Opening Price
Reminder: NEVER rely solely on DTCC, DTCC can be wrong and is not right 100% of times.
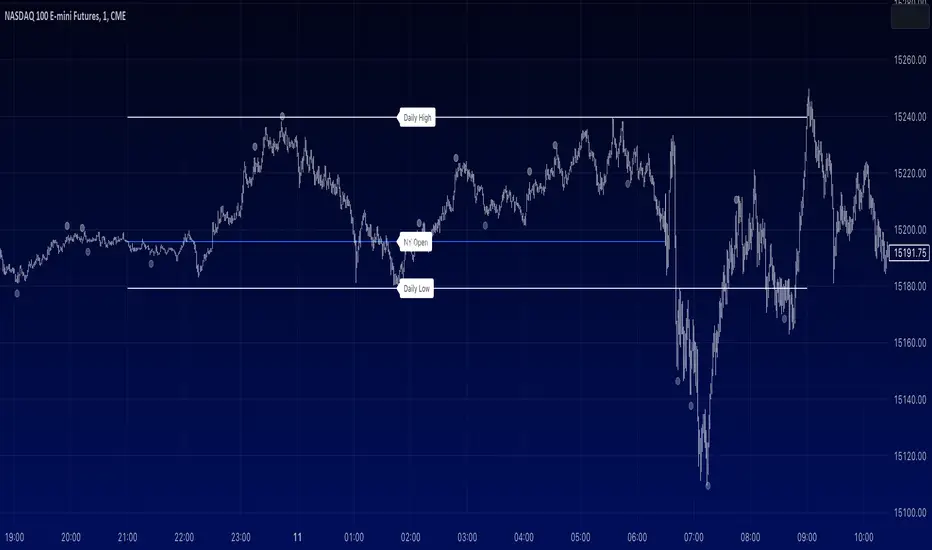
ICT - NY Session Open + Daily High/Low Markers [1m Chart]For ICT lovers, this marks the swing low, swing high of NY opening so you can scalp the open.
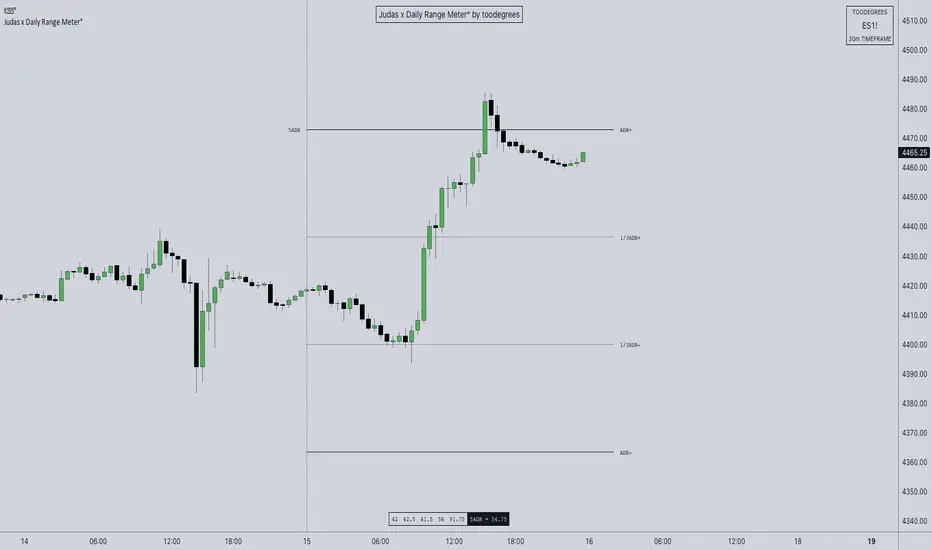
ICT ADR Levels - Judas x Daily Range Meter°The Average Daily Range (ADR) is a common metric used to measure volatility in an asset. It calculates the average difference between the highest and lowest price over a time interval – normally five days.
The Inner Circle Trader teaches the importance of this metric from an algorithmic point of view; in particular the 1/3ADR price level is deemed to be a threshold used to determine the area at which a Judas Swing – false move to trick market participants, protraction, manipulation – might exhaust. Another key difference in the ICT-use of this metric compared to the classic approach is that the average range is calculated from New York midnight Time, rather than the daily candle's open .
It is crucial to remember that the elements of Time are key when it comes to interpreting how price action will, or won't, react to this level: what Time of the day is it? what day of the week? what week of the month?
Let's consider the Time of the day. If one thinks about the Power of Three of the daily candle (Accumulation, Manipulation Distribution), it is highly unlikely that a Manipulation event will happen later in the day – whereas seeing the 1/3ADR hold in London session or New York open gives undeniable edge to an Analyst.
Apart from the 1/3ADR level seen from a Judas perspective, the opposing 1/3 level, and the full ADR projections, are excellent algorithmic levels at which we will see orderflow or reactions worth studying. These can be take profit targets, reversal opportunities, pyramid entries, ... Study them, and find what works for you!
Features:
Display a table with the previous N days' ranges and the current ADR value
Decide whether to consider daily candles, or New York (00:00 to 00:00 NY Time) for the basis of the calculation
See the ADR Range, the ADR price levels and 1/3ADR price levels by hovering over the text labels
Plot the ADR levels from the Midnight Anchor, or as offset markers on the side for a cleaner look
Show/Hide all elements individually
Examples:
– CBOT_MINI:YM1! at Equity Open
– INDEX:BTCUSD Perfect Buy Day Signature
– FX:EURUSD Clean Break = No Judas
– TSX:GC Repeated Attempts = Liquidity Engineering
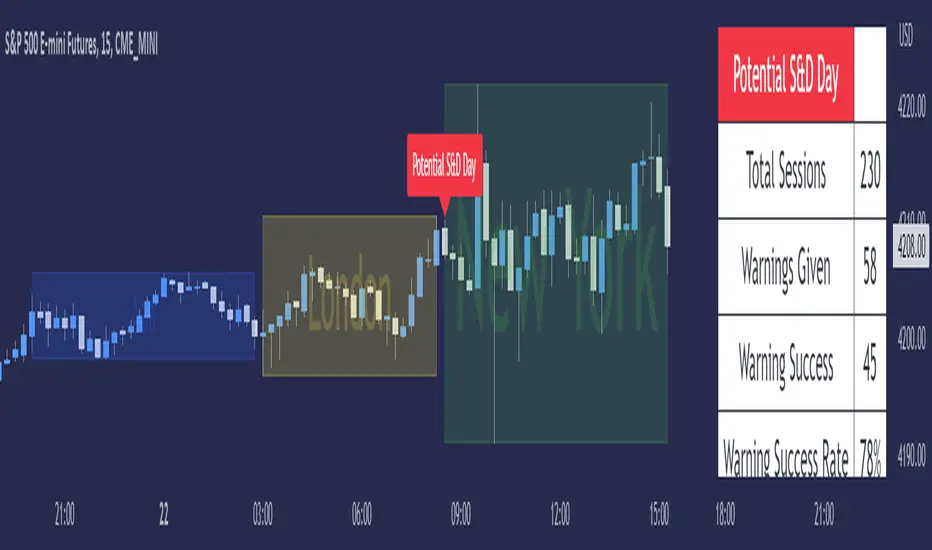
ICT Seek & Destroy Profile [TFO]The goal of this indicator is to anticipate potentially "choppy" New York trading sessions, based on what price does during the Asia and London trading sessions. Based on some user-defined success criteria, we can also track how successful these warnings are.
Many Inner Circle Trader (ICT) students have noted that choppy New York sessions are often preceded by erratic London sessions which take both the high and low of the Asian range.
When this criteria is true and warnings are enabled, a table will automatically populate with a custom warning message for the duration of the NY session, indicating to the user that it could be a choppy trading day.
We can measure and track the success rate of these warnings via the following success criteria:
- NY stays within London range
- NY exceeds London high and low
- NY closes within London range
- NY range is too small
The first three criteria should be self explanatory - the NY range either stays within the London high & low, exceeds them both, or closes within them.
The last criteria is a measure of the New York range compared to a user defined standard deviation of all historical ranges (for the number of sessions that the current chart can load). The default value of 1.5 would imply that a "successful" S&D day could be if the NY range (from high to low) was less than or equal to 1.5 standard deviations of all past ranges.
All these options can be toggled on/off as well, for those that only want to consider certain success criteria and not others. When any of the selected success criteria are true, that essentially indicates that the current session's warning was successful.
ICT Commitment of Traders° by toodegreesDescription:
The Commitment of Traders (COT) is a valuable raw data report released weekly by the Commodity Futures Trading Commission (CFTC). This report offers insights into the current long and short positions of three key market entities:
Commercial Traders ( usually represented in red )
Large Traders ( typically depicted in green )
Small Speculator Traders ( commonly shown in blue )
The concept of utilizing the COT data as a strategic trading tool was first introduced by Larry Williams, who emphasized the importance of monitoring Commercial Speculators – large corporate producers or consumers of commodities.
The Inner Circle Trader (ICT) prompts us to delve deeper into this data. While we can easily determine their Net Position (also referred to as the Main Program) by subtracting Commercial Short Positions from the Commercial Long Positions, this calculation doesn't reveal their ongoing Hedge Program .
Merely following the Main Program won't provide a trading edge. Aligning with the Hedge Program can be an invaluable weapon in your trading arsenal.
The Commercial Speculators' Hedge Program can be unveiled by examining the highest and lowest reading of their Net Position over a chosen time period and setting a new "zero line" between these extremes. This process generates a novel "COT Graph" providing a detailed understanding of the Commercial Speculators' current market activity.
When the Hedge Program, Seasonality, and Open Interest are cross-referenced with Institutional Orderflow, a trader can construct a very clear medium-to-long-term market narrative.
Features:
Access COT Data for the Commercial Speculators via Tradingview's reliable data source
Automate calculations and display the 3-month, 6-month, 12-month, 2-year, and 3-year Hedge Program
Define your own Custom Time Range for the Hedge Program
Display the Main Program and all Hedge Programs in an easy-to-understand table format
Additionally, by following the included instructions, you can augment your table with COT data from multiple markets. This extra information can help monitor correlated markets and develop a more robust market narrative:

ICT Time Windows by Scuba SteveJust an easy to use time based indicator that allows you to track ICT London Open Killzone, New York Open killzone, AM session Silver Bullet time window & PM Session Silver Bullet Time Window, and last but not least the Last Hour of trading which often has nice moves.

ICT SessionsThis script plots the timewindows of the ICT killzones (for forex) and trading session + makros below the chart. Individual components can be switched of to your liking
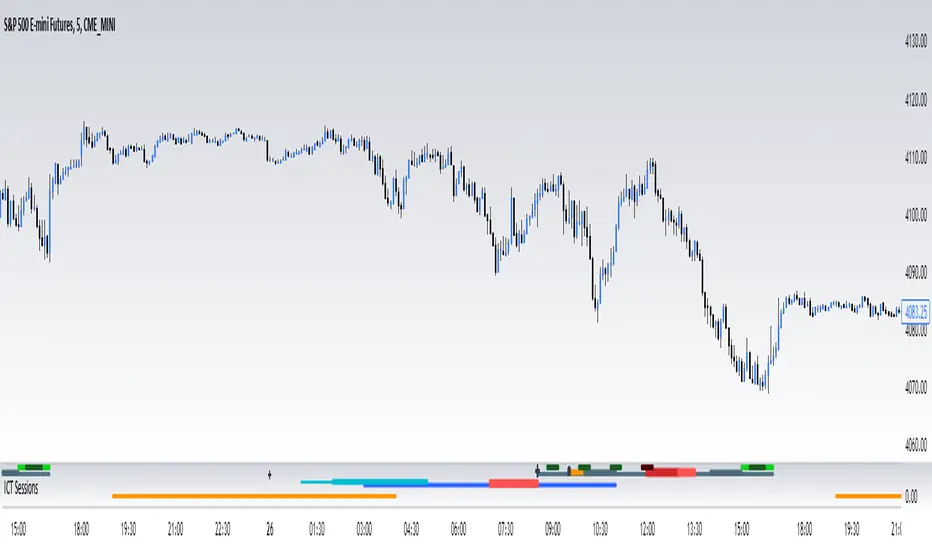
ICT MakrosThis script highlights the ICT trading makros and silverbullet timewindows with different background colors on your chart. The drawings are only visible on the timeframe 1min - 5min because they become useless above and i didnt code the logic for below 1min
ICT Session Opening FVG / Silver Bullet [MK]Students of ICT concepts will know that the first FVG found within particular session periods can identify an important price level for intraday traders.
"Find the first FVG at the start of the session and drag a box from it to the right"....ICT
The script finds the first FVG (either bull or bear) within the following periods:
London Killzone (0200 - 0500) EST
02:00 - 0259
03:00 - 0359
0400 - 0459
Dead Zone (05-00 - 0600) EST
05-00 - 0559
0600 - 0659
NY AM Killzone (0700 - 1100) EST
0700 - 0759
0830 - 0929
0929 - 0959
1000 - 1100 (Silver Bullet)
A chart higher timeframe can be chosen to detect the FVGs and they will be displayed on lower timeframe. Default is 5min for detection. I like to then following price reacting to 5mi FVGs on a 1 min chart.
FVG boxes can be extended to the end of the session, or to any time within the current days trading hours. Colors/Labels/ Session Periods can all be edited. A maximum timeframe for display is available and
timezone can be adjusted.
FVGs are only shown for the current days trading hours.

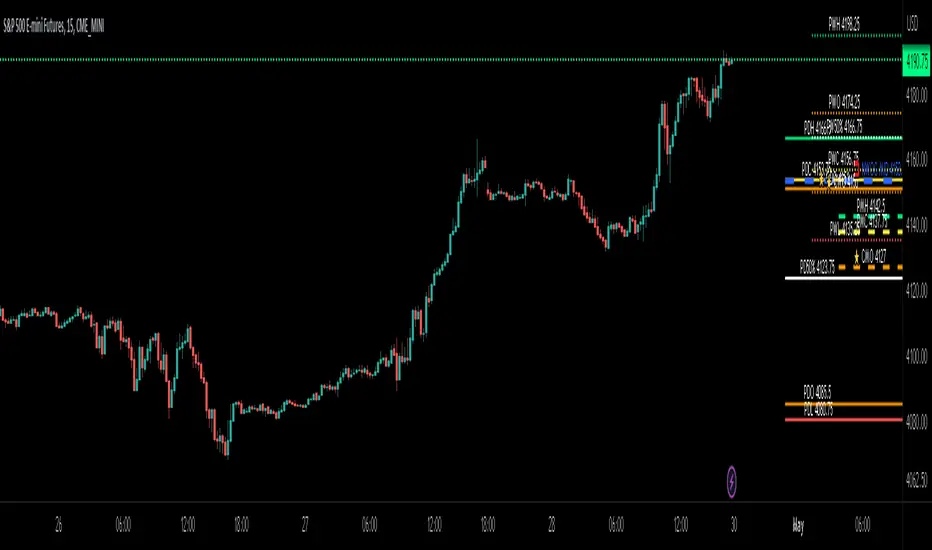
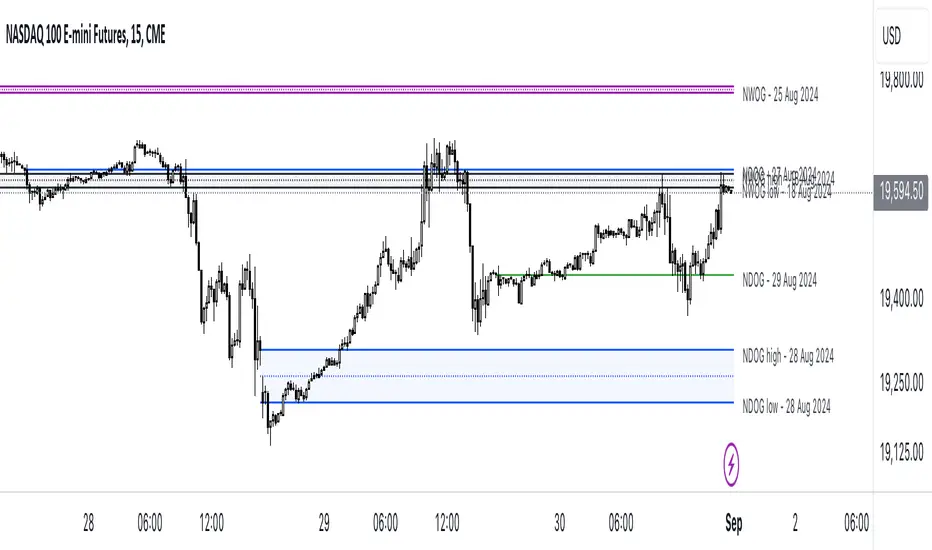
ICT Day/Week/Month Levels [MK]Displays Open, High, Low, Close and 50% levels for the Previous Day/Week/Month.
Also shows the Open for the Current Day/Week/Month
Also shows the Current New Week Opening Gap Midline (NWOG)
These levels are key to teachings by ICT as well as other trading strategies. There are lots of scripts available for this data, however this one plots the levels to the right of price on the chart to keep the chart as clean as possible. The line styles, colors and text can be customised. The offset to the right of the chart for the start of line and label offsets can also be adjusted.
Labels are abbreviated to PDH (previous day high), CMO (current month open), PW50% (previous week 50% from high to low) ..etc
ICT HTF Candles (fadi)Plotting a configurable higher timeframe on current chart's timeframe helps visualize price movement without changing timeframes. It also plots FVG and Volume Imbalance on the higher timeframe for easier visualization.
With ICT concepts, we usually wait for HTF break of structure and then find an entry on a lower timeframe. With this indicator, we can set it to the HTF and watch the develop of price action until the break of structure happens. We can then take an entry on the current timeframe.
Settings
HTF Higher timeframe to plot
Number of candles to display The number of higher timeframe candles to display to the right of current price action
Body/Border/Wick The candle colors for the body, border, and wick
Padding from current candles The distance from current timeframe's candles
Space between candles Increase / decrease the candle spacing
Candle width The size of the candles
Imbalance
Fair Value Gap Show / Hide FVG on the higher timeframe
Volume Imbalance Show / Hide Volume Imbalance on the higher timeframe
Trace
Trace lines Extend the OHLC lines of the higher timeframe and the source of each
Label Show/Hide the price levels of the OHLC

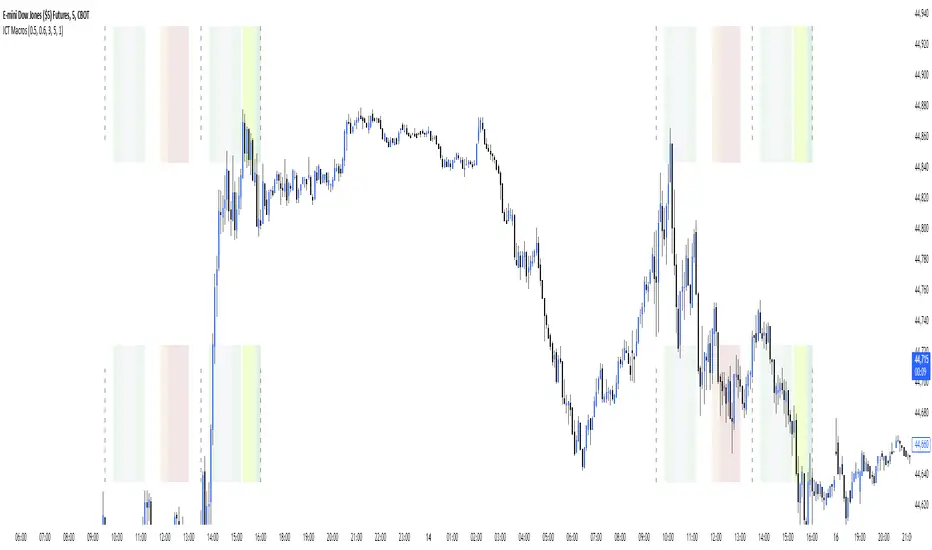
ICT Macros by CryptoforICT Macros by Cryptofor
Time periods in which the price is most volatile. At this time, the algorithm is programmed to attack liquidity or fill a significant FVG from which the OF can continue.
Plots of macros:
1. London Macros:
02:33 - 03:00
04:03 - 04:30
2. New York AM Macros:
08:50 - 09:10
09:50 - 10:10
10:50 - 11:10
3. New York Lunch + PM Macros:
11:50 - 12:10
13:10 - 13:40
15:15 - 15:45
Features:
Flexible line settings
Flexible text settings
Display data for all time or for the last 24 hours
Switch for each type of macro
Macro background color settings

ICT NWOG/NDOG (fadi)New Week Opening Gap (NWOG) and New Day Opening Gap (NDOG) are areas on the chart where price tend to react to and has the potential of moving from one gap to the next. These gaps can act as support and resistance zones where price can bounce of, or go through and retest. Areas of interest are the high, low, the Consequent Encroachment (C.E.), which is the middle between high and low of each gap.
Event Horizon is the 50% distance between two NWOGs and price tend to react to, and could act as Premium/ Discount between two NWOGs.
New Week Opening Gap (NWOG)
The difference between Friday close, and Sunday open. Consequent Encroachment (C.E.) is the area between two NWOGs.
Settings NWOG
- The Colors in the form of Current/Previous and line style for NWOG
- Background color to use for Current/Previous
- Number of NWOGs to use by the indicator (ICT recommends using minimum of 5)
- Extend Configuration:
-- Always Extend all NWOGs
-- Above and below only Shows the immediate two NWOGs that are above and below current price. These two NWOGs are recalculated as price moves
-- Any that is near current price Any NWOG that is near the current price, this can result in multiple NWOGs being displayed, with some overlapping
- Event Horizon only applicable when using the "Above and below only settings"
New Day Opening Gap (NDOG)
The difference between Yesterday's close and Today's open.
Settings NDOG
- The Colors in the form of Current/Previous and line style for NDOG
- Background color to use for Current/Previous
- Number of NDOGs to use by the indicator, default is 1 but price tend to react to previous ones as well
- Extend Configuration:
-- Always Extend all NDOGs
-- Above and below only Shows the immediate two NDOGs that are above and below current price. These two NDOGs are recalculated as price moves
-- Any that is near current price Any NDOG that is near the current price, this can result in multiple NDOGs being displayed, with some overlapping
Other Settings
Number of candles to use in calculation is used to calculate the size of the candles in order to derive the distance from current price. If current candle sizes is more important than over longer period of time then use 14 or near that number
Factor multiplier for distance test is the number above times X value. Lower timeframes require a higher number than a larger timeframe. If day trading, a value between 10 and 20 is probably best. If swing trading, a value between 5 and 10 is probably best.
Buffer How many candles beyond current price to extend the gaps by. this is helpful to provide cleaner view of the price action
ICT MTF FVG [MK]FVGs (Fair Value Gaps) are significant levels that may act as support or resistance to price. The script finds FVGs as per ICT trading system, then plots the full FVG to the right side of the chart. FVG boxes do not change size when they are semi-mitigated as its important to know where the original FVG midpoint lies. Plotting to the right side of price allows for a cleaner chart. The script is MTF and can display FVG boxes for the following timeframes. Chart, 5,10,15,30,1hr,4hr,8hr,12hr,D,W,M.
Below shows 1hr FVGs marked out. NOTE: this is not what the script does, this is for explanation only.
Below shows what the script will do. 1hr FVGs shown on 15min chart

ICT MTF Order Block Wicks [MK]Order Blocks are significant levels that may act as support or resistance to price. Often the wick area is where price may react. The script finds order blocks as per ICT trading system, then plots either the top or bottom wick area to the right side of price. Plotting to the right side of price allows for a cleaner chart. The script is MTF and can display order block boxes for the following timeframes. 5,10,15,30,1hr,4hr,8hr,12hr,D,W,M. Only order blocks of a higher timeframe than the current chart can be shown.
Below shows how order block wicks should be drawn on a 1hr chart NOTE: this is not what the indicator does, its only for explanation.
Below shows the same 1hr order blocks, but shown on a 15min chart NOTE: this is the function of this indicator.
ICT Implied Fair Value Gap (IFVG) [LuxAlgo]An Implied Fair Value Gap (IFVG) is a three candles imbalance formation conceptualized by ICT that is based on detecting a larger candle body & then measuring the average between the two adjacent candle shadows.
This indicator automatically detects this imbalance formation on your charts and can be extended by a user set number of bars.
The IFVG average can also be extended until a new respective IFVG is detected, serving as a support/resistance line.
Alerts for the detection of bullish/bearish IFVG's are also included in this script.
🔶 SETTINGS
Shadow Threshold %: Threshold percentage used to filter out IFVG's with low adjacent candles shadows.
IFVG Extension: Number of bars used to extend highlighted IFVG's areas.
Extend Averages: Extend IFVG's averages up to a new detected respective IFVG.
🔶 USAGE
Users of this indicator can primarily find it useful for trading imbalances just as they would for trading regular Fair Value Gaps or other imbalances, which aims to highlight a disparity between supply & demand.
For trading a bullish IFVG, users can find this imbalance as an area where price is likely to fill or act as an area of support.
In the same way, a user could trade bearish IFVGs by seeing it as a potential area to be filled or act as resistance within a downtrend.
Users can also extend the IFVG averages and use them as longer-term support/resistances levels. This can highlight the ability of detected IFVG to provide longer term significant support and resistance levels.
🔶 DETAILS
Various methods have been proposed for the detection of regular FVG's, and as such it would not be uncommon to see various methods for the implied version.
We propose the following identification rules for the algorithmic detection of IFVG's:
🔹 Bullish
Central candle body is larger than the body of the adjacent candles.
Current price low is higher than high price two bars ago.
Current candle lower shadow makes up more than p percent of its total candle range.
Candle upper shadow two bars ago makes up more than p percent of its total candle range.
The average of the current candle lower shadow is greater than the average of the candle upper shadow two bars ago.
where p is the user set threshold.
🔹 Bearish
Central candle body is larger than the body of the adjacent candles.
Current price high is higher than low price two bars ago.
Current candle upper shadow makes up more than p percent of its total candle range.
Candle lower shadow two bars ago makes up more than p percent of its total candle range.
The average of the candle lower shadow 2 bars ago is greater than the average of the current candle higher shadow.
where p is the user set threshold.
🔶 SUPPLEMENTARY MATERIAL
You can see our previously posted script that detects various imbalances as well as regular Fair Value Gaps which have very similar usability to Implied Fair Value Gaps here:

ICT Liquidty H/L [MK]indicator shows liquidity levels at pivot highs and lows on the chart timeframe. Levels are drawn as a horizontal line up to the last active bar. Once a level has been passed through, the level is highlighted. The liquidity level will remain highlighted until a pre determined amount of bars have closed after the level was passed. These liquidity levels can be used as targets for trades, or as potential reversal points. Liquidity (or resting orders) at key pivot points form a key part of the ICT trading system. Users can configure the indicator to display the untapped liquidity levels, or they can be completely hidden until they are passed through.
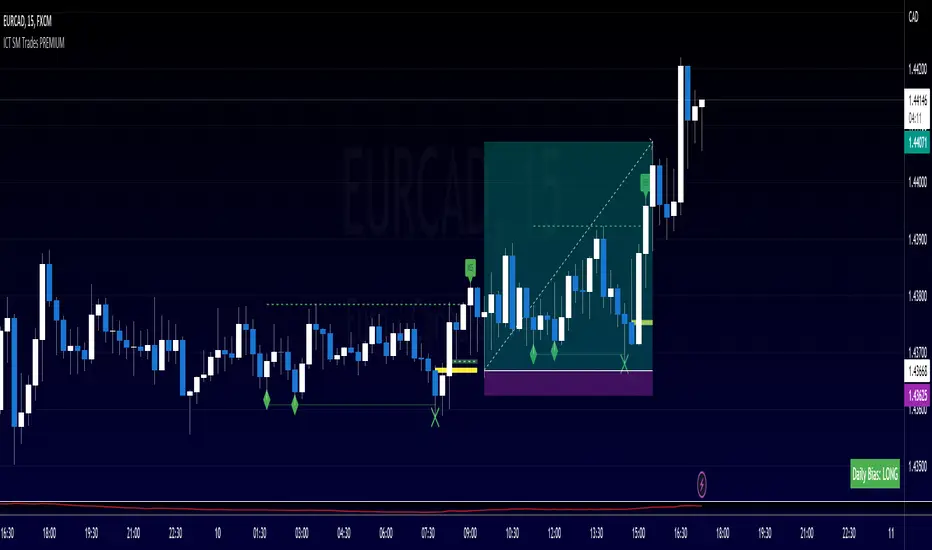
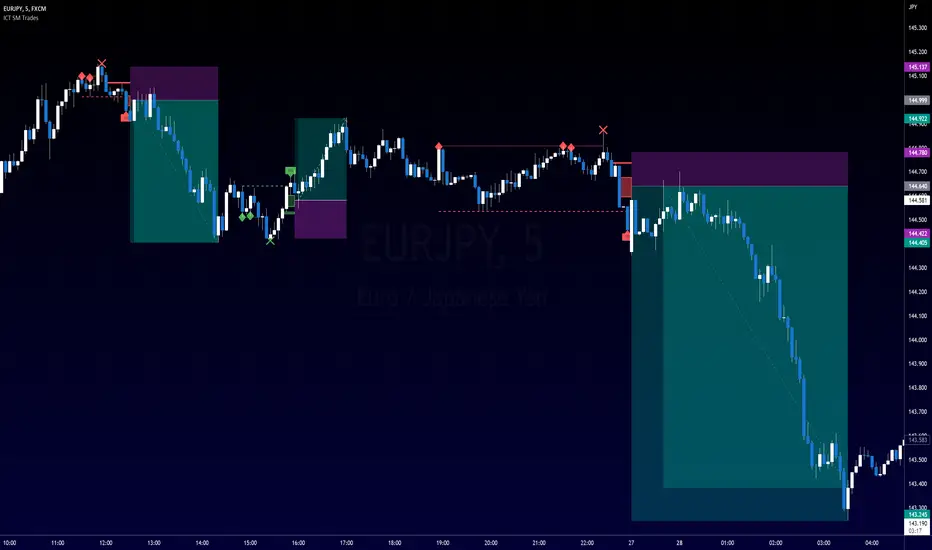
ICT SM Trades PREMIUMIndicator looks for ICT & Smart Money trades on any timeframe. These types of trades reveal how the big institutions, banks and hedge funds trade with big money. If they want their very big positions to be filled they need to find areas in chart where the majority of the money is sitting. Where is it? Where is the majority of orders placed? Right below supports or right above resistance, these orders are stoplosses or stop orders. So they need to push the price to these areas, take all the available stoplosses and trigger all the available stop orders in order to fill their positions and then push the price to the opposite side to make profit (and retail to lose).
Indicator looks for support or resistance (S/R) areas which are represented by dotted lines. This S/R areas are created by minimum of 2 pivot high/low (H/L). Every pivot H/L that creates the S/R area is marked with diamond label. This S/R area is called liquidity. After liquidity is created, indicator looks for liquidity grab (mostly represented by fast spike to this area - it is labeled with x-cross) and then price should go fast to the opposite side of the created structure. Indicator considers as a created structure everything that was created on the other side of the candles from the oldest pivot H/L which creates particular liquidity. For example, if liquidity is created with 3 pivot highs, indicator looks at the oldest pivot high and from there it is looking for the lowest low. Under this lowest low is dashed line which means that this level should be broken with closed candle. This action is called market structure shift (MSS), when the price shifted very fast from highs to lows. After MSS, when the price went fast to one direction, there were some imbalances in prices, in our example selling pressure was a lot bigger than buying pressure and there were created some long untested bearish candles. This untested areas in candles are called imbalances or gaps of fair value gaps (FVG). These are labeled with rectangles. It is expected that these gaps will be tested in near future to "balance the market".
We can put limit orders into these gaps (or into order blocks in PREMIUM indicator) and await some retracement after MSS to open our positions and after the positions are opened we can expect trend continuation in the direction where market structure shift was made (away from liquidity grab). So stoplosses can be placed above/below liquidity grab candle (marked with x-cross).
Alerts can be set for MSS to Long & Short and for liquidity grabs to Long & Short.
All settings of this indicator should be self-explanatory and most of them have tooltips for better understanding.
ICT 2022 Mentorship Model [TFO]An attempt at programming the logic from the Inner Circle Trader (ICT) 2022 Mentorship Model. It's not perfect by any means, and NOT intended as a substitute for learning the model itself. I just wanted to share what I’ve been able to make thus far. PLEASE read this description thoroughly before reaching out with questions.
How it works, as of the initial release (bullish example):
When major Sell Side Liquidity (SSL) is taken, this script will start looking for displacement through a recent swing high, marking a potential Market Structure Shift (MSS)
From the bar that created the MSS, displacement is deemed valid if the range of that bar is greater than the standard deviation of recent price history, multiplied by the “Displacement Strength” parameter. Valid displacement also requires that a Fair Value Gap (FVG) was created
Once the above conditions are met, the script will assume we are now seeking Buy Side Liquidity (BSL), and will continue to look for long entries in an FVG after subsequent displacement through swing highs. *This script will keep looking for long entries until price takes out BSL*
Similarly, if price took out BSL and displaced through a swing low, the script will only look for short entries in an FVG until an SSL pivot is reached (alerts can be configured to show these potential entries)
Settings:
Show Structure Breaks: show breaks of structure on the current timeframe
Show Liquidity Taken: show when major liquidity has been traded through
Show Liquidity Pivots: show all pivots that are being considered as liquidity
Structure Pivot Strength: determines how strong a local high/low must be for structural pivots on the current timeframe
Liquidity Multiplier: this number, multiplied by Structure Pivot Strength, will determine the pivot strength used to find valid liquidity, which should always be greater than the Structure Pivot Strength
BOS Type: “Close” will only count structure breaks when price closes through a prior pivot, whereas “Wick” will include structure breaks even if price only wicks through the prior pivot
Show Displacement: show bar coloring for valid displacement through a swing high/low
Show Displacement FVG: show FVGs that results from valid displacement
Displacement Type: use “Open to Close” to look for displacement using only the body of a candle, or “High to Low” to use the candle’s entire price range
Displacement Strength: higher values will look for more significant displacement candles, and vice versa
Max Bars to Extend FVG: if an FVG has not been overwritten or invalidated, it will extend to the right for a maximum of this many bars
I recommend lowering the values for Structure Pivot Strength and Liquidity Multiplier for larger chart timeframes, and increasing the values for smaller timeframes. I prefer keeping the displacement strength to >= 3, which would be 3 times the standard deviation of recent price history.

ICT SM Trades (liquidity find & grab, MSS, FVG, killzones)Indicator looks for ICT & Smart Money trades on any timeframe. These types of trades reveal how the big institutions, banks and hedge funds trade with big money. If they want their very big positions to be filled they need to find areas in chart where the majority of the money is sitting. Where is it? Where is the majority of orders placed? Right below supports or right above resistance, these orders are stoplosses or stop orders. So they need to push the price to these areas, take all the available stoplosses and trigger all the available stop orders in order to fill their positions and then push the price to the opposite side to make profit (and retail to lose).
Indicator looks for support or resistance (S/R) areas which are represented by dotted lines. This S/R areas are created by minimum of 2 pivot high/low (H/L). Every pivot H/L that creates the S/R area is marked with diamond label. This S/R area is called liquidity. After liquidity is created, indicator looks for liquidity grab (mostly represented by fast spike to this area - it is labeled with x-cross) and then price should go fast to the opposite side of the created structure. Indicator considers as a created structure everything that was created on the other side of the candles from the oldest pivot H/L which creates particular liquidity. For example, if liquidity is created with 3 pivot highs, indicator looks at the oldest pivot high and from there it is looking for the lowest low. Under this lowest low is dashed line which means that this level should be broken with closed candle. This action is called market structure shift (MSS), when the price shifted very fast from highs to lows. After MSS, when the price went fast to one direction, there were some imbalances in prices, in our example selling pressure was a lot bigger than buying pressure and there were created some long untested bearish candles. This untested areas in candles are called imbalances or gaps of fair value gaps (FVG). These are labeled with rectangles. It is expected that these gaps will be tested in near future to "balance the market".
We can put limit orders into these gaps and await some retracement after MSS to open our positions and after the positions are opened we can expect trend continuation in the direction where market structure shift was made (away from liquidity grab). So stoplosses can be placed above/below liquidity grab candle (marked with x-cross).
In settings of the indicator you can set whether only long or only short trades will be shown. Long trades are green and short trades are red. You can set if fair value gaps will be shown as well. The last thing in settings is session. You can set custom session which will be shown as background color on your chart.
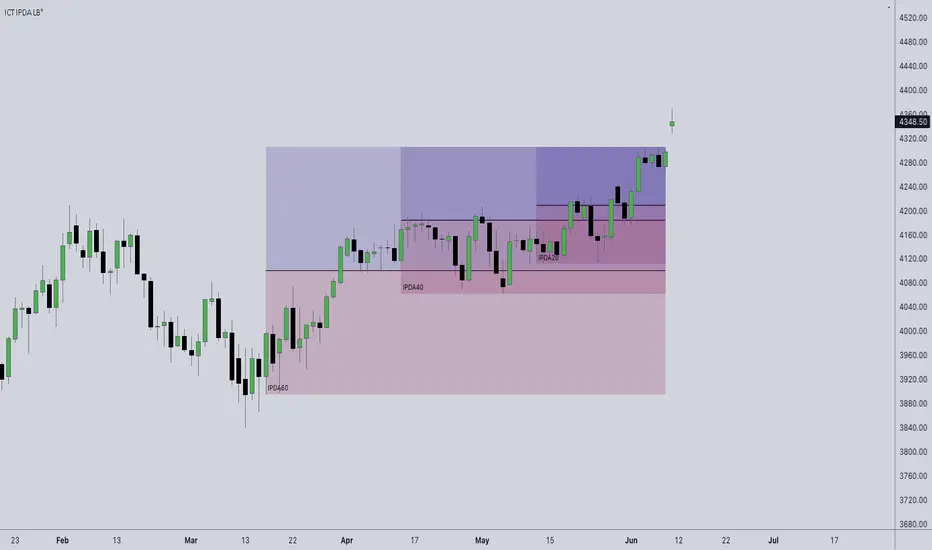
ICT IPDA Look BackThis script automatically calculates and updates ICT's daily IPDA look back time intervals and their respective discount / equilibrium / premium, so you don't have to :)
IPDA stands for Interbank Price Delivery Algorithm. Said algorithm appears to be referencing the past 20, 40, and 60 days intervals as points of reference to define ranges and related PD arrays.
Intraday traders can find most value in the 20 Day Look Back box, by observing imbalances and points of interest.
Longer term traders can reference the 40 and 60 Day Look Back boxes for a clear indication of current market conditions.