ICT Implied Fair Value Gap (IFVG) [LuxAlgo]An Implied Fair Value Gap (IFVG) is a three candles imbalance formation conceptualized by ICT that is based on detecting a larger candle body & then measuring the average between the two adjacent candle shadows.
This indicator automatically detects this imbalance formation on your charts and can be extended by a user set number of bars.
The IFVG average can also be extended until a new respective IFVG is detected, serving as a support/resistance line.
Alerts for the detection of bullish/bearish IFVG's are also included in this script.
🔶 SETTINGS
Shadow Threshold %: Threshold percentage used to filter out IFVG's with low adjacent candles shadows.
IFVG Extension: Number of bars used to extend highlighted IFVG's areas.
Extend Averages: Extend IFVG's averages up to a new detected respective IFVG.
🔶 USAGE
Users of this indicator can primarily find it useful for trading imbalances just as they would for trading regular Fair Value Gaps or other imbalances, which aims to highlight a disparity between supply & demand.
For trading a bullish IFVG, users can find this imbalance as an area where price is likely to fill or act as an area of support.
In the same way, a user could trade bearish IFVGs by seeing it as a potential area to be filled or act as resistance within a downtrend.
Users can also extend the IFVG averages and use them as longer-term support/resistances levels. This can highlight the ability of detected IFVG to provide longer term significant support and resistance levels.
🔶 DETAILS
Various methods have been proposed for the detection of regular FVG's, and as such it would not be uncommon to see various methods for the implied version.
We propose the following identification rules for the algorithmic detection of IFVG's:
🔹 Bullish
Central candle body is larger than the body of the adjacent candles.
Current price low is higher than high price two bars ago.
Current candle lower shadow makes up more than p percent of its total candle range.
Candle upper shadow two bars ago makes up more than p percent of its total candle range.
The average of the current candle lower shadow is greater than the average of the candle upper shadow two bars ago.
where p is the user set threshold.
🔹 Bearish
Central candle body is larger than the body of the adjacent candles.
Current price high is higher than low price two bars ago.
Current candle upper shadow makes up more than p percent of its total candle range.
Candle lower shadow two bars ago makes up more than p percent of its total candle range.
The average of the candle lower shadow 2 bars ago is greater than the average of the current candle higher shadow.
where p is the user set threshold.
🔶 SUPPLEMENTARY MATERIAL
You can see our previously posted script that detects various imbalances as well as regular Fair Value Gaps which have very similar usability to Implied Fair Value Gaps here:
Cari dalam skrip untuk "imbalance"

Trishul Tap Signals (v6) — Liquidity Sweep + Imbalanced RetestTrishul Tap Signals — Liquidity Sweep + Imbalanced Retest
Type: Signal-only indicator (non-repainting)
Style: Price-action + Liquidity + Trend-following
Best for: Intraday & Swing Trading — any liquid market (stocks, futures, crypto, FX)
Timeframes: Any (5m–1D recommended)
Concept
The Trishul Tap setup is a liquidity-driven retest play inspired by order-flow and Smart Money Concepts.
It identifies one-sided impulse candles that also sweep liquidity (grab stops above/below a recent swing), then waits for price to retest the origin of that candle to enter in the trend direction.
Think of it as the three points of a trident:
Trend filter — Only signals with the prevailing trend.
Liquidity sweep — Candle takes out a recent swing high/low (stop-hunt).
Imbalanced retest — Price taps the candle’s open/low (bull) or open/high (bear).
Bullish Setup
Trend Filter: Price above EMA(200).
Impulse Candle:
Green close.
Upper wick ≥ (wickRatio × lower wick).
Lower wick ≤ (oppWickMaxFrac × full range).
Liquidity Sweep: Candle’s high exceeds the highest high of the last sweepLookback bars (excluding current).
Tap Entry: Buy signal triggers when price later taps the candle’s low or open (user choice) within expireBars.
Bearish Setup
Trend Filter: Price below EMA(200).
Impulse Candle:
Red close.
Lower wick ≥ (wickRatio × upper wick).
Upper wick ≤ (oppWickMaxFrac × full range).
Liquidity Sweep: Candle’s low breaks the lowest low of the last sweepLookback bars (excluding current).
Tap Entry: Sell signal triggers when price later taps the candle’s high or open (user choice) within expireBars.
Inputs
Trend EMA Length: Default 200.
Sweep Lookback: Number of bars for liquidity sweep check (default 20).
Wick Ratio: Required size ratio of dominant wick to opposite wick (default 2.0).
Opposite Wick Max %: Opposite wick must be ≤ this fraction of the candle’s range (default 25%).
Tap Tolerance (ticks): How close price must come to the level to count as a tap.
Expire Bars: Max bars after setup to allow a valid tap.
One Signal per Level: If ON, a base is “consumed” after first signal.
Plot Tap Levels: Show horizontal lines for active bases.
Show Setup Labels: Mark the origin sweep candle.
Plots & Visuals
EMA Trend Line — trend filter reference.
Tap Levels —
Green = bullish base (origin candle’s low/open).
Red = bearish base (origin candle’s high/open).
Labels — Show where the setup candle formed.
Signals —
BUY: triangle-up below bar at bullish tap.
SELL: triangle-down above bar at bearish tap.
Alerts
Two built-in conditions:
BUY Signal (Trishul Tap) — triggers on bullish tap.
SELL Signal (Trishul Tap) — triggers on bearish tap.
Set via Alerts panel → Condition = this indicator → Choose signal type.
How to Trade It
Use in liquid markets with clean price structure.
Confirm with HTF structure, volume spikes, or other confluence if desired.
Place stop just beyond the tap level (or ATR-based).
Target 1–2R or trail behind structure.
Why It Works
Liquidity sweep traps traders entering late (breakout buyers or panic sellers) and forces them to exit in the opposite direction, fueling your entry.
Wick imbalance confirms directional aggression by one side.
Trend filter keeps you aligned with the market’s dominant flow.
Retest entry lets you enter at a better price with reduced risk.
Non-Repainting
Setups form only on confirmed bar closes.
Signals trigger only on later bars that tap the stored level.
No lookahead functions are used.
Disclaimer
This script is for educational purposes only and does not constitute financial advice. Test thoroughly in a simulator or demo before using in live markets. Trading involves risk.

Luma Signals – Orderflow ImbalanceLuma Signals – Imbalance Detector
The Luma Signals – Imbalance Detector highlights price inefficiencies where buying or selling pressure dominates, causing rapid market movements. These imbalances can act as potential support and resistance zones or indicate areas where liquidity needs to be filled.
🔹 Key Features:
✔ Identifies Bullish & Bearish Imbalances – Blue candles indicate strong buying pressure, red candles indicate strong selling pressure.
✔ Clear Market Structure – Normal bullish candles appear in light gray, normal bearish candles in white.
✔ Dynamic Orderflow Analysis – Helps traders spot high-volatility price movements and potential reversals.
✔ No repainting & lightweight – The indicator works in real-time without altering past data.
📊 How to Use:
Trend Confirmation: If an imbalance aligns with a strong trend, it may indicate trend continuation.
Liquidity Gaps: Price often revisits imbalances before continuing its movement.
Scalping & Intraday Trading: Identify key reaction points for short-term trades.
Fair Value Gap█ OVERVIEW
This indicator displays the Fair Value Gap of the current timeframe and an additional higher timeframe. For each FVG the gaps act as targets creating bullish and bearish gaps that are often filled.
█ FEATURES
MTF Options
MidPoint FIll
Delete Old On Fill
Label FVG Timeframe
MTF Options
Enabling the MTF Options will allow the user to use the "MTF Timeframe" setting to choose what HTF Fair Value Gap to display
MidPoint FIll
A line plot at the Half way point will be included in the Fair Value Gap, this will be used to delete the gap when reached instead of a full fill.
Delete Old On Fill
Deletes historical Fair Value Gaps when filled.
Label FVG Timeframe
Labels Every Fair Value gap with there relevant timeframe to make it easier to determine which gap is being filled.
█ HOW TO USE IT
The indicator is quite straight forward in its application, providing users with targets that are often filled as they are seen as market imbalance.
Just applying it to your chart will provide the existing Fair Value Gaps. MTF Confluence is helpful in seeing what is happening on the macro perspective.
█ SUGGESTION
My suggestion for clarity is to use a different color to some degree between the MTF and Current TF as Opposed to text, keeps the chart clear.
█ LIMITATIONS OF PINE (Please read)
I see many users going on different indicators with MTF in mind and trying to use it for LTF data e.g. 1hour chart, and selecting 5min in chart settings.
This is not recommended by the team themselves and should be noted for use always use HTF: www.tradingview.com
To understand how to use fair value gaps I recommend learning about the subject some more, searching online will provide you resources. The internet is your friend when learning. All the best.

YM Ultimate SNIPER# YM Ultimate SNIPER - Documentation & Trading Guide
## 🎯 Unified GRA + DeepFlow | YM-Optimized for Low Volatility
**TARGET: 3-7 High-Confluence Trades per Day**
> **Philosophy:** *YM's lower volatility is not a weakness—it's our edge. Predictability + precision = consistent profits.*
---
## ⚡ QUICK REFERENCE CARD
```
┌─────────────────────────────────────────────────────────────────────────────┐
│ YM ULTIMATE SNIPER - QUICK REFERENCE │
├─────────────────────────────────────────────────────────────────────────────┤
│ │
│ 💰 YM BASICS: │
│ ═════════════ │
│ • 1 tick = 1 point = $5/contract │
│ • Typical daily range: 150-400 points │
│ • 30-40% less volatile than NQ │
│ • More institutional, less retail noise │
│ │
├─────────────────────────────────────────────────────────────────────────────┤
│ │
│ 🎯 TIER THRESHOLDS (YM-OPTIMIZED): │
│ ══════════════════════════════════ │
│ S-TIER: 50+ pts = $250+/contract → HOLD (Institutional sweep) │
│ A-TIER: 25-49 pts = $125-245/contract → SWING (Strong momentum) │
│ B-TIER: 12-24 pts = $60-120/contract → SCALP (Quick grab) │
│ │
├─────────────────────────────────────────────────────────────────────────────┤
│ │
│ ⏰ SESSION WINDOWS: │
│ ═══════════════════ │
│ LDN → 3:00-5:00 AM ET (European flow) │
│ NY → 9:30-11:30 AM ET (US opening drive) │
│ PWR → 3:00-4:00 PM ET (End-of-day rebalancing) │
│ │
│ Expected Trades: 1-2 LDN | 2-3 NY | 1-2 PWR = 4-7 total │
│ │
├─────────────────────────────────────────────────────────────────────────────┤
│ │
│ 📊 CONFLUENCE SCORING (MAX 10 POINTS): │
│ ═══════════════════════════════════════ │
│ Tier Signal: S=3, A=2, B=1 points │
│ In Active Zone: +2 points │
│ POC Aligned: +1 point (POC at body extreme) │
│ Imbalance Support:+1 point (supporting IMB nearby) │
│ Strong Volume: +1 point (2x+ average) │
│ Strong Delta: +1 point (70%+ dominance) │
│ CVD Momentum: +1 point (CVD trending with signal) │
│ │
│ MINIMUM SCORE: 5/10 to show signal (adjustable) │
│ IDEAL SCORE: 7+/10 for highest probability │
│ │
├─────────────────────────────────────────────────────────────────────────────┤
│ │
│ 🚨 SIGNAL TYPES: │
│ ═════════════════ │
│ S🎯 / A🎯 / B🎯 → GRA Tier Signals (Full confluence) │
│ Z🎯 → Zone Entry (At DFZ zone + delta + volume) │
│ SP → Single Print (Institutional impulse) │
│ │
├─────────────────────────────────────────────────────────────────────────────┤
│ │
│ ✓ ENTRY CHECKLIST: │
│ ═══════════════════ │
│ □ Signal appears (check Score ≥5) │
│ □ Session active (LDN!/NY!/PWR!) │
│ □ Table: Vol GREEN, Delta colored, Body GREEN │
│ □ CVD arrow (▲/▼) matches direction │
│ □ Note stop/target lines on chart │
│ □ Check Zone status (bonus if IN ZONE) │
│ □ Execute at signal candle close │
│ │
├─────────────────────────────────────────────────────────────────────────────┤
│ │
│ 🎯 POSITION SIZING BY TIER: │
│ ═══════════════════════════ │
│ S-TIER (50+ pts): Full size, hold 2-5 min, target 2.5:1 R:R │
│ A-TIER (25-49): 75% size, hold 1-3 min, target 2.0:1 R:R │
│ B-TIER (12-24): 50% size, hold 30-90 sec, target 1.5:1 R:R │
│ │
├─────────────────────────────────────────────────────────────────────────────┤
│ │
│ ⛔ DO NOT TRADE WHEN: │
│ ════════════════════ │
│ ✗ Session shows "---" │
│ ✗ Score < 5/10 │
│ ✗ Vol shows RED (<1.8x) │
│ ✗ Delta < 62% │
│ ✗ Multiple conflicting signals │
│ ✗ Just before major news (FOMC, NFP, etc.) │
│ │
└─────────────────────────────────────────────────────────────────────────────┘
```
---
## 📋 WHY YM? LEVERAGING LOW VOLATILITY
### The YM Advantage
Most traders avoid YM because "it doesn't move enough." This is precisely why it's perfect for precision scalping:
| Factor | NQ | YM | Advantage |
|--------|----|----|-----------|
| **Daily Range** | 300-600 pts | 150-400 pts | More predictable moves |
| **Tick Value** | $5/tick (4 ticks/pt) | $5/tick (1 tick/pt) | Simpler math |
| **Retail Noise** | High | Low | Cleaner signals |
| **Whipsaws** | Frequent | Rare | Fewer fakeouts |
| **Trend Persistence** | Short | Long | Easier holds |
| **Fill Quality** | Variable | Consistent | Better execution |
### Why 3-7 Trades is the Sweet Spot
```
YM SESSION BREAKDOWN:
════════════════════
LONDON (3-5 AM ET): 1-2 trades
├── Why: European institutions positioning for US open
├── Character: Slow build-up, clean trends
└── Best signals: Zone entries + A/B tier
NY OPEN (9:30-11:30 AM ET): 2-3 trades
├── Why: Highest volume, most institutional activity
├── Character: Initial balance formation, breakouts
└── Best signals: S/A tier, zone confluence
POWER HOUR (3-4 PM ET): 1-2 trades
├── Why: End-of-day rebalancing, MOC orders
├── Character: Mean reversion or trend acceleration
└── Best signals: Zone entries, B tier quick scalps
TOTAL: 4-7 high-quality setups per day
```
---
## 🔧 YM-SPECIFIC OPTIMIZATIONS
This unified indicator has been specifically tuned for YM's characteristics:
### Tier Thresholds
| Tier | NQ (Original) | YM (Optimized) | Rationale |
|------|---------------|----------------|-----------|
| S-Tier | 100 pts | **50 pts** | YM's daily range is ~50% of NQ |
| A-Tier | 50 pts | **25 pts** | Proportional scaling |
| B-Tier | 20 pts | **12 pts** | Still 5%+ of typical daily range |
### Filter Adjustments
| Filter | NQ Value | YM Value | Why |
|--------|----------|----------|-----|
| Volume Ratio | 1.5x | **1.8x** | Higher bar = less retail noise |
| Delta Threshold | 60% | **62%** | Tighter for cleaner signals |
| Body Ratio | 70% | **72%** | More conviction required |
| Range Multiplier | 1.3x | **1.4x** | Bigger move = real signal |
| Gap ATR% | 30% | **25%** | Smaller gaps still significant |
| Zone Age | 50 bars | **75 bars** | Zones last longer in slow market |
### Why These Changes Work
1. **Higher Volume Bar**: YM has more institutional flow. Requiring 1.8x volume ensures we're catching real moves, not retail chop.
2. **Tighter Delta**: With less noise, we can demand clearer buyer/seller dominance before entering.
3. **Longer Zone Life**: YM trends persist longer. A zone that would be stale in NQ is still viable in YM.
4. **Smaller Gap Threshold**: YM gaps are naturally smaller. 25% of ATR in YM is significant institutional activity.
---
## 📊 CONFLUENCE SCORING SYSTEM
The unified indicator uses a 10-point confluence scoring system to filter for only the highest-probability setups:
### Score Breakdown
```
CONFLUENCE SCORE CALCULATION:
═════════════════════════════
BASE POINTS (Tier):
├── S-Tier signal: +3 points
├── A-Tier signal: +2 points
└── B-Tier signal: +1 point
BONUS POINTS:
├── Inside Active Zone (DFZ): +2 points
│ └── Price within bull/bear zone = institutional level
│
├── POC Alignment: +1 point
│ └── POC at body extreme = strong conviction
│
├── Imbalance Support: +1 point
│ └── Supporting imbalance within 1 ATR
│
├── Strong Volume (2x+): +1 point
│ └── Exceptional institutional participation
│
├── Strong Delta (70%+): +1 point
│ └── Clear one-sided aggression
│
└── CVD Momentum: +1 point
└── CVD trending with signal direction
MAXIMUM POSSIBLE: 10 points
```
### Score Interpretation
| Score | Quality | Action | Expected Win Rate |
|-------|---------|--------|-------------------|
| 8-10 | 🥇 Elite | Full size, hold for target | 75-80% |
| 6-7 | 🥈 Strong | Standard size, manage actively | 65-70% |
| 5 | 🥉 Valid | Reduced size, quick scalp | 55-60% |
| <5 | ⚫ Filtered | No signal shown | N/A |
### Adjusting Minimum Score
- **Conservative (Score ≥6)**: Fewer trades, higher win rate
- **Standard (Score ≥5)**: Balanced approach, 3-7 trades/day
- **Aggressive (Score ≥4)**: More trades, requires active management
---
## 📐 SIGNAL TYPES EXPLAINED
### 1. GRA Tier Signals (S🎯, A🎯, B🎯)
These are the primary signals from the merged GRA system:
```
TIER SIGNAL REQUIREMENTS:
═══════════════════════════
ALL must be TRUE:
├── ✓ Point movement meets tier threshold
├── ✓ Volume ≥ 1.8x average
├── ✓ Delta ≥ 62% (buy or sell dominance)
├── ✓ Body ≥ 72% of candle range
├── ✓ Range ≥ 1.4x average
├── ✓ Small opposite wick (<50% of body)
├── ✓ CVD confirms direction (if enabled)
├── ✓ Active session (LDN/NY/PWR)
└── ✓ Confluence Score ≥ minimum (default 5)
```
### 2. Zone Entry Signals (Z🎯)
When price enters a DeepFlow zone with confirmation:
```
ZONE ENTRY REQUIREMENTS:
═══════════════════════════
ALL must be TRUE:
├── ✓ Price inside fresh/tested zone (not broken)
├── ✓ Delta ≥ 62% in zone direction
├── ✓ Volume ≥ 1.5x average
└── ✓ Active session
NOTE: Z🎯 only appears when NOT already showing tier signal
(prevents duplicate signals on same candle)
```
### 3. Single Print Markers (SP)
Mark institutional impulse candles for future S/R:
```
SINGLE PRINT REQUIREMENTS:
═══════════════════════════
ALL must be TRUE:
├── ✓ Range ≥ 1.6x average
├── ✓ Body ≥ 72% of range
├── ✓ Volume ≥ 1.8x average
├── ✓ Delta ≥ 62% confirms direction
└── ✓ Active session
USE: Horizontal lines at high/low act as future S/R
```
---
## 🎯 TRADING STRATEGIES
### Strategy 1: Zone + Tier Confluence (Highest Probability)
```
THE ULTIMATE YM SETUP:
═══════════════════════
Setup:
1. Active DeepFlow zone exists (green box below for long)
2. Price pulls back INTO the zone
3. Tier signal fires INSIDE the zone (S🎯/A🎯)
4. Score shows 7+/10
Entry: Signal candle close
Stop: Below zone bottom (for longs)
Target: Based on tier (1.5-2.5:1 R:R)
Why It Works:
• Zone = institutional limit orders
• Tier signal = momentum confirmation
• Double confirmation = high probability
Expected Win Rate: 70-75%
```
### Strategy 2: Pure Tier Signal with POC Stop
```
SNIPER TIER TRADE:
══════════════════
Setup:
1. Tier signal appears (preferably A or S)
2. Score ≥ 5/10
3. Note POC level on signal candle
4. Red/green stop/target lines appear
Entry: Signal candle close
Stop: Beyond POC (shown on chart)
Target: Auto-calculated based on tier
Key: POC placement matters
• POC near candle bottom (longs) = STRONG
• POC in middle = weaker signal
• POC at extreme = possible exhaustion
Expected Win Rate: 60-65%
```
### Strategy 3: Zone Bounce (Continuation)
```
ZONE BOUNCE TRADE:
══════════════════
Setup:
1. Fresh zone created during session
2. Price leaves zone, moves in zone direction
3. Price returns to test zone (within 15 bars)
4. Z🎯 signal appears or rejection candle forms
Entry: At CE line (middle of zone)
Stop: Beyond zone edge
Target: Previous swing high/low
Why It Works:
• Zones represent unfilled orders
• First retest often finds support/resistance
• Lower volatility = cleaner bounces
Expected Win Rate: 55-60%
```
### Strategy 4: Single Print Scalp
```
SINGLE PRINT SCALP:
═══════════════════
Setup:
1. Single Print (SP) marker appears
2. Note the gold/purple lines at high/low
3. Wait for price to return to SP level
4. Look for rejection or tier signal at level
Entry: At SP line with confirmation
Stop: Beyond the SP line
Target: Quick 1:1 or to next structure
Why It Works:
• SP = price moved too fast, orders unfilled
• Price often returns to "fill" these levels
• YM's slower pace makes retests likely
Expected Win Rate: 55-60%
```
---
## 📊 TABLE LEGEND
| Field | Reading | Color Meaning |
|-------|---------|---------------|
| **Pts** | Current candle points | Gold/Green/Yellow = Tiered |
| **Tier** | S/A/B/X | Tier color or white |
| **Vol** | Volume ratio | 🟢 ≥1.8x, 🔴 <1.8x |
| **Delta** | Buy/Sell % | 🟢 Buy dom, 🔴 Sell dom |
| **Body** | Body % of range | 🟢 ≥72%, 🔴 <72% |
| **CVD** | Trend direction | ▲ Bullish, ▼ Bearish |
| **Sess** | Active session | 🟡 LDN!/NY!/PWR!, ⚫ --- |
| **POC** | Point of Control | 🟡 Gold price level |
| **Zone** | Zone position | 🟢 BUY⬚, 🔴 SELL⬚, ⚫ --- |
| **Zones** | Active zone count | #B/#S format |
| **Score** | Confluence score | 🟢 7+, 🟡 5-6, ⚫ <5 |
| **IMB** | Recent imbalances | Count in last 10 bars |
| **R:R** | Risk/Reward | 🟢 On signal, ⚫ No signal |
---
## ⏰ SESSION-SPECIFIC PLAYBOOKS
### London Session (3:00-5:00 AM ET)
```
CHARACTER: Slow, methodical, trend-building
VOLUME: Medium (50-70% of NY)
BEST SETUPS: Zone entries, A/B tier with zones
PLAYBOOK:
• Enter on zone retests
• Expect 15-25 pt moves
• Don't fight early direction
• Watch for pre-NY positioning
TYPICAL TRADES: 1-2
```
### NY Open (9:30-11:30 AM ET)
```
CHARACTER: Fast, volatile, high-conviction
VOLUME: Highest of day
BEST SETUPS: S/A tier, zone confluence
PLAYBOOK:
• First 15 min: Observe Initial Balance
• 9:45-10:15: Best setups form
• S-tier signals = ride the wave
• Be aggressive on high scores
TYPICAL TRADES: 2-3
```
### Power Hour (3:00-4:00 PM ET)
```
CHARACTER: Rebalancing, MOC orders
VOLUME: Medium-high (70-80% of NY)
BEST SETUPS: B tier scalps, zone entries
PLAYBOOK:
• Watch for mean reversion setups
• Quick scalps around POC levels
• Don't hold through close
• Take profits at 1:1 R:R
TYPICAL TRADES: 1-2
```
---
## 🔧 RECOMMENDED SETTINGS
### Conservative (Fewer, Better Trades)
| Setting | Value | Notes |
|---------|-------|-------|
| Min Confluence Score | 6 | Only strong setups |
| Min Volume Ratio | 2.0 | Higher bar |
| Delta Threshold | 65% | Stricter dominance |
| Max Zones | 8 | Less clutter |
### Standard (Balanced)
| Setting | Value | Notes |
|---------|-------|-------|
| Min Confluence Score | 5 | Default |
| Min Volume Ratio | 1.8 | Default |
| Delta Threshold | 62% | Default |
| Max Zones | 12 | Default |
### Aggressive (More Opportunities)
| Setting | Value | Notes |
|---------|-------|-------|
| Min Confluence Score | 4 | More signals |
| Min Volume Ratio | 1.5 | Lower bar |
| Delta Threshold | 60% | Looser |
| Max Zones | 15 | More context |
---
## 🚨 ALERT SETUP
Configure these alerts in TradingView:
| Alert | Priority | Action |
|-------|----------|--------|
| 🎯 YM S-TIER LONG/SHORT | 🔴 CRITICAL | Drop everything, check immediately |
| 🎯 YM A-TIER LONG/SHORT | 🟠 HIGH | Evaluate within 15 seconds |
| 🎯 YM B-TIER LONG/SHORT | 🟡 MEDIUM | Check if available |
| 🎯 YM ZONE BUY/SELL | 🟢 STANDARD | Good context entry |
| 📦 NEW ZONE | 🔵 INFO | Mark on mental map |
| ⭐ SINGLE PRINT | 🔵 INFO | Note for future S/R |
| SESSION OPEN | ⚪ INFO | Prepare to trade |
### Alert Message Format
```
🎯 YM A-LONG | YM1! @ 42,150 | 68%B | Score: 7/10 | IN ZONE | POC: 42,125 | Stop: 42,098 | SWING
```
---
## ⚠️ COMMON MISTAKES TO AVOID
| Mistake | Why It's Bad | Solution |
|---------|-------------|----------|
| Trading outside sessions | Low volume = noise | Wait for LDN/NY/PWR |
| Ignoring score | Low scores = low probability | Require ≥5/10 |
| Fighting the zone | Zones are institutional | Trade WITH zones |
| Oversizing B-tier | Quick scalps, not holds | 50% size max |
| Holding through news | Volatility spike | Exit before FOMC, NFP |
| Chasing after signal | Entry on close only | Miss it = wait for next |
| Ignoring POC position | Middle POC = indecision | Strong = extreme POC |
---
## 📈 DAILY TRADE JOURNAL TEMPLATE
```
DATE: ___________
SESSION: □ LDN □ NY □ PWR
TRADE 1:
├── Time: _______
├── Signal: S🎯 / A🎯 / B🎯 / Z🎯
├── Score: ___/10
├── Entry: _______
├── Stop: _______
├── Target: _______
├── In Zone: □ Yes □ No
├── Result: +/- ___ pts ($_____)
└── Notes: _______________________
TRADE 2:
DAILY SUMMARY:
├── Total Trades: ___
├── Win Rate: ___%
├── Net P/L: $_____
├── Best Setup: _______
└── Improvement: _______________________
```
---
## 🏆 GOLDEN RULES FOR YM
> **"YM rewards patience. Wait for the confluence—it's worth it."**
> **"Low volatility means you can size up. One good trade beats five forced trades."**
> **"Score 7+ is your edge. Anything less is gambling."**
> **"The zone + tier combo is your bread and butter. Master it."**
> **"Leave every trade with money. YM gives you time to manage."**
---
## 📊 VISUAL GUIDE
```
PERFECT YM SNIPER SETUP:
═══════════════════════════════════════════════════════════════════
│ Current Price
│
┌─────────────────────────┴────────────────────────────┐
│ BEARISH ZONE (Red) │
│- - - - - - - CE Line (Entry for shorts) - - - - - - │
│ │
└──────────────────────────────────────────────────────┘
│
══════════════════╪══════════════════ SP High (Purple)
│
┌─────────────────────┤
│█████████████████████│ ← A🎯 LONG Signal
│█████████████████████│ Score: 8/10
│ ●──────────────────│ ← POC (Gold) near bottom = STRONG
│█████████████████████│
│█████████████████████│
└─────────────────────┤
│
══════════════════╪══════════════════ SP Low (Purple)
│
┌─────────────────────────┴────────────────────────────┐
│ BULLISH ZONE (Green) │
│- - - - - - - CE Line (Entry for longs) - - - - - - -│
│██████████████████████████████████████████████████████│
└──────────────────────────────────────────────────────┘
│
Stop Loss
CONFLUENCE CHECK:
✓ A-Tier signal (+2)
✓ At edge of bullish zone (+2)
✓ POC at bottom of candle (+1)
✓ Strong volume 2.3x (+1)
✓ Delta 72% buyers (+1)
✓ CVD bullish (+1)
TOTAL: 8/10 = ELITE SETUP
ACTION: Full size LONG at signal candle close
STOP: Below zone bottom
TARGET: 2:1 R:R (auto-calculated)
```
---
## 🔧 TROUBLESHOOTING
| Issue | Cause | Fix |
|-------|-------|-----|
| No signals appearing | Score too high | Lower min score to 4-5 |
| Too many signals | Score too low | Raise min score to 6+ |
| Zones cluttering chart | Max zones high | Reduce to 8-10 |
| POC not showing | Tiered filter on | Check "POC Only Tiered" |
| Session not highlighting | Wrong timezone | Verify timezone setting |
| Alerts not firing | Not configured | Set up in TradingView alerts |
---
## 📝 PINE SCRIPT V6 TECHNICAL NOTES
This indicator uses advanced features:
- **User Defined Types (UDT)**: Clean state management for zones/imbalances
- **`request.security_lower_tf()`**: Intrabar volume analysis
- **Dynamic Array Management**: Efficient memory for drawings
- **Confluence Scoring Engine**: Multi-factor signal qualification
- **Auto Stop/Target**: Dynamic risk management calculation
**Minimum TradingView Plan:** Pro (for intrabar data access)
---
*© Alexandro Disla - YM Ultimate SNIPER*
*Pine Script v6 | TradingView*
*Unified GRA v5 + DeepFlow Zones | YM-Optimized*

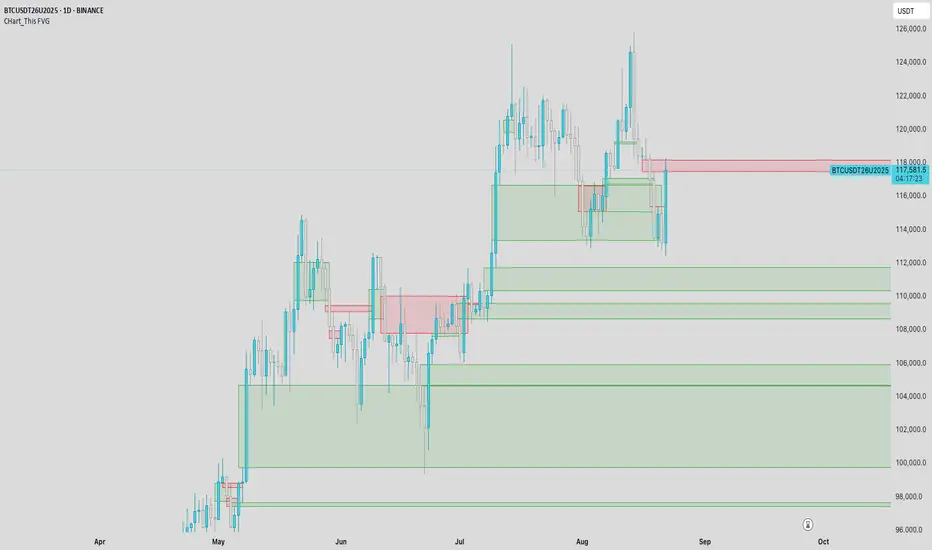
CHart_This FVGThis script will work on any time frame, and auto plots the classic ICT "fair value gaps", or imbalances, that result from a three candle formation wherein the middle candle body extends beyond the highs and lows of the end candles, leaving no overlap of the first and last candle wicks. Bullish imbalances are green, and bearish are red. Plotted zones will automatically close once a candle closure fully violates the imbalance zone with a close beyond its borders.
Price Imbalance as Consecutive Levels of AveragesOverview
The Price Imbalance as Consecutive Levels of Averages indicator is an advanced technical analysis tool designed to identify and visualize price imbalances in financial markets. Unlike traditional moving average (MA) indicators that update continuously with each new price bar, this indicator employs moving averages calculated over consecutive, non-overlapping historical windows. This unique approach leverages comparative historical data to provide deeper insights into trend strength and potential reversals, offering traders a more nuanced understanding of market dynamics and reducing the likelihood of false signals or fakeouts.
Key Features
Consecutive Rolling Moving Averages: Utilizes three distinct simple moving averages (SMAs) calculated over consecutive, non-overlapping windows to capture different historical segments of price data.
Dynamic Color-Coded Visualization: SMA lines change color and style based on the relationship between the averages, highlighting both extreme and normal market conditions.
Median and Secondary Median Lines: Provides additional layers of price distribution insight during normal trend conditions through the plotting of primary and secondary median lines.
Fakeout Prevention: Filters out short-term volatility and sharp price movements by requiring consistent historical alignment of multiple moving averages.
Customizable Parameters: Offers flexibility to adjust SMA window lengths and line extensions to align with various trading strategies and timeframes.
Real-Time Updates with Historical Context: Continuously recalculates and updates SMA lines based on comparative historical windows, ensuring that the indicator reflects both current and past market conditions.
Inputs & Settings
Rolling Window Lengths:
Window 1 Length (Most Recent) Bars: Number of bars used to calculate the most recent SMA. (Default: 5, Range: 2–300)
Window 2 Length (Preceding) Bars: Number of bars for the second SMA, shifted by Window 1. (Default: 8, Range: 2–300)
Window 3 Length (Third Rolling) Bars: Number of bars for the third SMA, shifted by the combined lengths of Window 1 and Window 2. (Default: 13, Range: 2–300)
Horizontal Line Extension:
Horizontal Line Extension (Bars): Determines how far each SMA line extends horizontally on the chart. (Default: 10 bars, Range: 1–100)
Functionality and Theory
1. Calculating Consecutive Simple Moving Averages (SMAs):
The indicator calculates three SMAs, each based on distinct and consecutive historical windows of price data. This approach contrasts with traditional MAs that continuously update with each new price bar, offering a static view of past trends rather than an ongoing one.
Mean1 (SMA1): Calculated over the most recent Window 1 Length bars. Represents the short-term trend.
Mean1=∑i=1N1CloseiN1
Mean1=N1∑i=1N1Closei
Where N1N1 is the length of Window 1.
Mean2 (SMA2): Calculated over the preceding Window 2 Length bars, shifted back by Window 1 Length bars. Represents the medium-term trend.
\text{Mean2} = \frac{\sum_{i=1}^{N_2} \text{Close}_{i + N_1}}}{N_2}
Where N2N2 is the length of Window 2.
Mean3 (SMA3): Calculated over the third rolling Window 3 Length bars, shifted back by the combined lengths of Window 1 and Window 2 bars. Represents the long-term trend.
\text{Mean3} = \frac{\sum_{i=1}^{N_3} \text{Close}_{i + N_1 + N_2}}}{N_3}
Where N3N3 is the length of Window 3.
2. Determining Market Conditions:
The relationship between the three SMAs categorizes the market condition into either extreme or normal states, enabling traders to quickly assess trend strength and potential reversals.
Extreme Bullish:
Mean3Mean2>Mean1
Mean3>Mean2>Mean1
Indicates a strong and sustained downward trend. SMA lines are colored purple and styled as dashed lines.
Normal Bullish:
Mean1>Mean2andnot in extreme bullish condition
Mean1>Mean2andnot in extreme bullish condition
Indicates a standard upward trend. SMA lines are colored green and styled as solid lines.
Normal Bearish:
Mean1Mean2>Mean1
Mean3>Mean2>Mean1
Normal Bullish:
Mean1>Mean2andnot in Extreme Bullish
Mean1>Mean2andnot in Extreme Bullish
Normal Bearish:
Mean1 Mean2 > Mean3
Visualization: All three SMAs are displayed as gold dashed lines.
Median Lines: Not displayed to maintain chart clarity.
Interpretation: Indicates a strong and sustained upward trend. Traders may consider entering long positions, confident in the trend's strength without the distraction of additional lines.
2. Normal Bullish Condition:
SMAs Alignment: Mean1 > Mean2 (not in extreme condition)
Visualization: Mean1 and Mean2 are green solid lines; Mean3 is gray.
Median Lines: A thin blue dotted median line is plotted between Mean1 and Mean2, with two additional thin blue dashed lines as secondary medians.
Interpretation: Confirms an upward trend while providing deeper insights into price distribution. Traders can use the median and secondary median lines to identify optimal entry points and manage risk more effectively.
3. Extreme Bearish Condition:
SMAs Alignment: Mean3 > Mean2 > Mean1
Visualization: All three SMAs are displayed as purple dashed lines.
Median Lines: Not displayed to maintain chart clarity.
Interpretation: Indicates a strong and sustained downward trend. Traders may consider entering short positions, confident in the trend's strength without the distraction of additional lines.
4. Normal Bearish Condition:
SMAs Alignment: Mean1 < Mean2 (not in extreme condition)
Visualization: Mean1 and Mean2 are red solid lines; Mean3 is gray.
Median Lines: A thin blue dotted median line is plotted between Mean1 and Mean2, with two additional thin blue dashed lines as secondary medians.
Interpretation: Confirms a downward trend while providing deeper insights into price distribution. Traders can use the median and secondary median lines to identify optimal entry points and manage risk more effectively.
Customization and Flexibility
The Price Imbalance as Consecutive Levels of Averages indicator is highly adaptable, allowing traders to tailor it to their specific trading styles and market conditions through adjustable parameters:
SMA Window Lengths: Modify the lengths of Window 1, Window 2, and Window 3 to capture different historical trend segments, whether focusing on short-term fluctuations or long-term movements.
Line Extension: Adjust the horizontal extension of SMA and median lines to align with different trading horizons and chart preferences.
Color and Style Preferences: While default colors and styles are optimized for clarity, traders can customize these elements to match their personal chart aesthetics and enhance visual differentiation.
This flexibility ensures that the indicator remains versatile and applicable across various markets, asset classes, and trading strategies, providing valuable insights tailored to individual trading needs.
Conclusion
The Price Imbalance as Consecutive Levels of Averages indicator offers a comprehensive and innovative approach to analyzing price trends and imbalances within financial markets. By utilizing three consecutive, non-overlapping SMAs and incorporating median lines during normal trend conditions, the indicator provides clear and actionable insights into trend strength and price distribution. Its unique design leverages comparative historical data, distinguishing it from traditional moving averages and enhancing its utility in identifying genuine market movements while minimizing false signals. This dynamic and customizable tool empowers traders to refine their technical analysis, optimize their trading strategies, and navigate the markets with greater confidence and precision.

CandelaCharts - Volume Imbalance (VI) 📝 Overview
Volume Imbalance occurs when there’s a noticeable gap between the bodies of two consecutive candlesticks, with no overlap between them. While the wicks of the candles might intersect, the candle bodies remain entirely separate. This phenomenon often signifies that the algorithm driving market activity did not evenly distribute prices between these two levels, leaving behind a small Volume Imbalance (VI).
A Bullish Volume Imbalance forms when the body of a green candlestick gaps above the previous candle’s body, with no overlap, indicating strong upward momentum and insufficient sell-side liquidity.
A Bearish Volume Imbalance forms when the body of a red candlestick gaps below the previous candle’s body, with no overlap, signaling intense downward pressure and a lack of buy-side liquidity.
This indicator can automatically identify volume imbalances by scanning candlestick patterns and detecting gaps between consecutive candle bodies. These volume imbalances act as price magnets, often attracting the market back to fill the gap before resuming its original direction. Recognizing and leveraging these gaps can be a powerful tool in technical analysis for predicting price movements.
📦 Features
MTF
Mitigation
Consequent Encroachment
Threshold
Hide Overlap
Advanced Styling
⚙️ Settings
Show: Controls whether VIs are displayed on the chart.
Show Last: Sets the number of VIs you want to display.
Length: Determines the length of each VI.
Mitigation: Highlights when a VI has been touched, using a different color without marking it as invalid.
Timeframe: Specifies the timeframe used to detect VIs.
Threshold: Sets the minimum gap size required for VI detection on the chart.
Show Mid-Line: Configures the midpoint line's width and style within the VI. (Consequent Encroachment - CE)
Show Border: Defines the border width and line style of the VI.
Hide Overlap: Removes overlapping VIs from view.
Extend: Extends the VI length to the current candle.
Elongate: Fully extends the VI length to the right side of the chart.
⚡️ Showcase
Simple
Mitigated
Bordered
Consequent Encroachment
Extended
🚨 Alerts
This script provides alert options for all signals.
Bearish Signal
A bearish alert triggers when a red candlestick gaps below the previous body, signaling downward pressure.
Bullish Signal
A bullish alert triggers when a green candlestick gaps above the previous body, indicating upward momentum.
⚠️ Disclaimer
Trading involves significant risk, and many participants may incur losses. The content on this site is not intended as financial advice and should not be interpreted as such. Decisions to buy, sell, hold, or trade securities, commodities, or other financial instruments carry inherent risks and are best made with guidance from qualified financial professionals. Past performance is not indicative of future results.

Liquidity Analysis🙏🏻 Liquidity Analysis is 1 of 2 structural layer / orderflow layer analysis scripts. Both are independent so can’t be released together as a single script, but should be used together. The second one which is called (Signed) Volume Analysis is incoming.
The same math used in this script can be applied on other types of profile-like data: orderbooks, trading volumes of all options for each strike.
Important: market or volume profile, just as orderbooks and options traded volume by strikes, are all liquidity ‘estimates’, showing where liquidity is more likely or less likely to be. These estimates however, especially combined with other info, are really useful and reliable.
This script works with inferred volumes vs the provided one. It's the better choice for equities, bonds; neutral choice for currencies; and suboptimal choice for natural & artificial commodities.
Contents:
Output description;
How to analyze & use the outputs;
How to use it together with upcoming (Signed) Volume Analysis script;
How did I use both scripts to finish The Leap profitably and skipped many losses.
1. Output description
Color of the profile reflects the liquidity imbalance state: red is negative, purple is neutral, blue is positive.
Bar coloring represents history values of liquidity imbalance for backtesting purposes. It can be turned on/off in the script's Style settings.
Two purple vertical lines represent calculated borders of excessive liquidity (HVN), scarce liquidity (LVN), and sufficient liquidity (NVN) zones.
Vertical dash line marks the moving window end, this way you can be certain over what exact data you see the profile was built.
2. How to analyze & use the outputs
Setup up the script:
Moving window length: set it to ~ ¼ of your data analysis window. E.g if you see on your charts and use ~ 256 bars, set the length to 64.
Native tick size multiplier: leave it at 0 to calculate optimal number of rows automatically, or set it manually to match native tick size multiples you desire.
Use 2 timeframes: main one and a far lower one 3 steps down, just like on the screenshot.
Native lot size multiplier allows to round profile rows themselves to nearest multiples of native lot size. I added this just in case any1 needs it.
Find out current liquidity imbalance state:
As mentioned before, based on profile color, it can be negative, neutral or positive. This is the state variable that changes slowly and denies/confirms the signals that would be explained in the minute.
I use my own statistically grounded imbalance metric (no hardcoded/learned thresholds), that unlike mainstream imbalance metrics (e.g orderbook imbalance as sum of bids vs sum of asks) provides a natural neutral zone, when liquidity imbalance is ofc there but not strong enough to be considered.
…
Profile-based signals: look at profile shape vs 2 vertical purple lines.
where profile rows exceed the left purple line, these prices are considered HVN. Too much potential liquidity is there.
where profile rows don’t exceed the right purple line, these prices are considered LVN. Potential thin/lack of liquidity is expected there.
where profile rows are in between these 2 purple lines, these are NVN, or neutral liquidity zones.
Trading ruleset itself is based on couple of simple rules:
Only! Use limit orders hence provide liquidity in LVNs and Only! use stop-market orders hence consume liquidity in HVNs;
These orders should be put in advance ‘only’. This is how you discover the direction or orders: you can only put sell limit orders above you and buy limit orders below you, and you can only put buy stop orders above you, and sell stop orders below you.
This is really it. It may look weird, but once you just try to follow these 2 rules letter by letter for 1 hour, you’ll see how liquidity trading works.
Now once you know that, just don’t open new trades against the liquidity imbalance state. So don’t open shorts when the profile is blue, and don’t open longs when it’s red.
The last part is multi-timeframe logic. Prefer to act when a lower timeframe is Not against the main timeframe. That’s all, no multiple higher timeframes are needed.
3. How to use it together with upcoming (Signed) Volume Analysis script.
That upcoming script would also have a mean to generate its own signals, and another state variable called volume imbalance.
So now you’re not only looking at liquidity imbalance but also at volume imbalance that would deny/confirm a profile based signal. You need at least one of these to favor your long or short.
This is the same logic widely used in HFT, where MM bots cancel/shift/resize orders when book is too onesided And ordeflow is one sided as well.
4. How did I use both scripts to finish The Leap profitably and skipped many losses.
Even tho you can use structural information as your main strategic layer, as many so-called orderflow traders do, I traded in objective style: my fade signals were volatility based in essence, and I used ordeflow for better entries and stops, but most importantly to skip losses.
When ‘both‘ liquidity imbalance and volume imbalance (in their main timeframes) were against my trades, I skipped them all, saving many ~$500 stop losses (that was my basis risk unit for the Leap). Unless I had a very strong objective signal, i.e confluence of several signals, or just one higher timeframe signal, I did all these skips.
I traded ~ intraweek timeframe, so I was analyzing either the last 230 30min bars or 1380 5min bars. Both Liquidity Analysis and (signed) Volume Analysis scripts were set to moving window length 46 or 276 for either granulary.
I finished the leap with 9% profit and max DD ~ 5%, a bit short of my goal of 12.5%. If not these 2 scripts I would’ve finished a bit above breakeven I think.
∞

Machine Learning-Inspired Supply & Demand Zones [AlgoPoint]This indicator is a Smart Supply & Demand Zone tool, developed with principles inspired by Machine Learning (ML). It intelligently filters out market noise, allowing you to focus only on the most significant zones where institutional order flow is likely present.
💡 How It Works: Why Is This Indicator "Smart"?
Unlike traditional indicators that only measure simple price movements, this script uses an algorithm that asks the same critical questions an experienced market analyst would to qualify a zone:
- 1. Price Imbalance: How fast and aggressively did the price leave the zone? Our algorithm measures the body size of the "departure candle" relative to the current market volatility (ATR). A zone is only considered if it was formed by an explosive move that is statistically significant, indicating a major imbalance between buyers and sellers.
- 2. Volume Confirmation: Did the "smart money" participate in this move? The script checks if the volume on the departure candle was significantly higher than the recent average volume. A spike in volume confirms that the move was backed by institutional interest, adding strength and validity to the zone.
- 3. Valid Pivot Structure: Did the zone originate from a meaningful swing high or low? The algorithm first identifies a valid pivot structure, ensuring that zones are not drawn from insignificant or random price fluctuations.
Only when a potential zone passes these three critical tests—our "quality filter"—is it drawn on your chart.
🚀 Features & How to Use
Using the indicator is straightforward. You will see two primary types of boxes on your chart:
* 🟥 Red Box (Supply Zone): An area of potential resistance where selling pressure is likely to be strong. Look for potential shorting opportunities as the price approaches this zone.
* 🟩 Green Box (Demand Zone): An area of potential support where buying pressure is likely to be strong. Look for potential long opportunities as the price pulls back into this zone.
Dynamic Zone Management
This indicator is not static; it lives and breathes with the market:
- Fresh Zone: A newly formed zone appears in its full, vibrant color. These are the highest-probability zones as they have not yet been re-tested.
- Broken / Flipped Zone: You have full control over what happens when a zone is broken! In the settings, you can choose:
- Delete Zone: The zone will be removed completely when the price closes through it.
- Show as Broken (Flip): When broken, the zone will turn gray, stop extending, and remain on your chart. This is extremely useful for identifying Support/Resistance Flips, where a broken demand zone becomes new resistance, or a broken supply zone becomes new support.
⚙️ Settings & Customization
Fine-tune the indicator to match your personal trading style via the settings menu:
- Breakout Behavior: The most powerful feature. Choose between Delete Zone and Show as Broken (Flip) to customize your chart.
- Zone Finding Logic: Control the indicator's sensitivity.
- Selective: Requires both strong imbalance and high volume. Finds fewer, but higher-quality, zones.
- Moderate: Requires either strong imbalance or high volume. Finds more potential zones.
- Sensitivity Settings: Adjust the ATR Multiplier and Volume Multiplier to make the criteria for a "strong" zone stricter or looser.

Unmitigated Liquidity Imbalances [AlgoAlpha]🎉 Introducing the Unmitigated Liquidity Imbalance Indicator by AlgoAlpha! 🎉
Dive into the depths of market analytics with our "Unmitigated Liquidity Imbalance" indicator. This tool harnesses unique algorithms to detect liquidity imbalances between bulls and bears, helping traders spot trends and potential entry and exit points with greater accuracy. 📈🚀
🔍 Key Features:
🌟 Advanced Analysis : Analyses candle direction and length to forecast market peaks and valleys.
🎨 Customizable Visuals : Tailor the chart with your choice of bullish green or bearish red to reflect different market conditions.
🔄 Real-Time Updates : Continuously updates to reflect live market changes.
🔔 Configurable Alerts : Set up alerts for key trading signals such as bullish and bearish reversals, as well as trend shifts.
📐 How to Use:
🛠 Add the Indicator : Add the indicator to your favourites and customize the settings to suite your needs.
📊 Market Analysis : Monitor the oscillator threshold; readings above 0.5 suggest bullish sentiment, while below 0.5 indicate bearish conditions. And reversal signals are displayed to show potential entry points.
🔔 Set Alerts : Enable notifications for reversal conditions or trend changes to seize trading opportunities without constant chart watching.
🧠 How It Works:
The core mechanism of the indicator is based on detecting changes in candlestick size and direction to identify bullish and bearish liquidity levels from the peak & valley indicator's logic. By comparing the length of a current candle to the previous one and checking the change in direction, it pinpoints moments where market sentiment could be shifting, indicating if the liquidity at that point is bullish or bearish. The script then looks at what percentage of the past few unmitigated levels are bullish or bearish based on a customizable lookback and determines the liquidity imbalance which can then be interpreted as trend.
Empower your trading with the Unmitigated Liquidity Imbalance indicator and navigate the markets with confidence and precision. 🌟💹
Happy trading, and may your charts be ever in your favour! 🥳✨
💎 Related Indicator

Footprint Imbalance Reversal ZonesThe script detects blowouts and displays buy and sell volume as levels.
Green lines = bullish zones (potential support / buying pressure)
Red lines = bearish zones (potential resistance / selling pressure)
---------------
Trade ideas:
---------------
Price approaching a green zone → potential bounce/support.
Price approaching a red zone → potential rejection/resistance.
Combine with other indicators or price action for confirmation.
-----------------
Configuration
-----------------
Inputs:
Imbalance Threshold (%) → higher = only very strong imbalances trigger zones
Bars to form cluster → number of consecutive imbalance bars needed
Zone Extend Bars → how far each zone line extends into the future
Minimum bar volume → ignore low-volume bars for cleaner zones
Use tick-rule volume estimate → leave true if no real bid/ask data
Max saved zones → max number of zones stored (oldest removed if exceeded)
------
Tips
------
Best used on intraday or short-term charts where volume imbalances are meaningful.
Adjust Minimum bar volume to filter out low-volume noise.
Combine with candlestick patterns, RSI, or moving averages for higher-probability trades.
For long-term charts, consider increasing Bars to form cluster to capture stronger levels.
Combine with price action, candlestick patterns, or other indicators for better trade signals.

Volume Analysis🙏🏻 (signed) Volume Analysis is 2 of 2 structural layer / ordeflow analysis scripts, while the first one is Liquidity Analysis. Both are independent so can’t be released together as a single script, but should be used together.
The same math used in this script can be applied to other types of aggressive volume data: non-aggregated flow of market orders, volume traded of put vs call options.
There’s no universal agreement about terminology, but this script works with volumes signed by the aggressor who initiated a transaction. Then these volumes get aggregated by time and a cumulative sum is calculated. Mostly this is widely known as Cumulative Volume Delta.
However this script works with 'inferred' volumes vs the provided ones. It’s the better choice for equities, bonds; neutral choice for currencies; and suboptimal choice for natural and artificial commodities.
Contents:
Output description;
How to analyze & use the outputs;
How to use it together with Liquidity Analysis script;
How did I use both scripts to finish The Leap profitably and skipped many losses.
1. Output description
Color of the CVD line reflects (signed) volume imbalance state: red is negative, purple is neutral, blue is positive.
3 purple lines are lower deviation (lower band), basis (middle band), upper deviation (upper band): used to generate signals by a ruleset that would be explained in a minute
Gray number in the script’s status line is the advised input you may put into Inferred volume multiplier in script’s setting, I will explain it
Vertical dash line marks the moving window end, this way you can be certain over what exact data you see the profile was built.
2. How to analyze & use the outputs
Setup up the script:
Moving window length: set it to ~ ¼ of your data analysis window. E.g if you see on your charts and use ~ 256 bars, set the length to 64.
Inferred volume multiplier: you can easily leave it 256, this is not a critical factor for the math, it’s mostly there if you want to ~ equate inferred volumes with real ones in scale. For this, use the gray number in the script status line, it’s calculated as ratio of long term real volumes weighted avg to long term inferred volumes weighted avg.
Again, changing the inferred volume multiplier won’t affect the math.
Use 2 timeframes: main one and a far lower one 3 steps down, just like on the screenshot.
Find out current volume imbalance state:
As mentioned before, based on CVD line color, it can be negative, neutral or positive. This is the state variable that changes slowly and denies/confirms the signals generated by crossovers of CVD line and 3 purple thresholds.
For this I use my own very fast and lightweight metric that is totally statistically grounded, utilizes temporal information, and calculates volume imbalance without using heavy math like regressions as it’s usually done. It also provides a natural neutral zone, when volume imbalance is not strong enough to be confirmed.
...
CVD-based signals:
First you need to understand what precisely a touch of a threshold is:
Touch: an event when either of these 2 happens:
One CVD datapoint is above the threshold, and the next CVD datapoint is below the threshold
One CVD datapoint is below the threshold, and the next CVD datapoint is above the threshold
These are usually called crossovers/crossunders.
Now with the 3 purple thresholds we follow this logic:
Monitor the last touched threshold;
Once another threshold is touched, here we may generate a signal but only once !, after the first generated signal at that threshold we can’t generate more signals on this threshold, we need to wait when CVD comes to another threshold.
If CVD touches one threshold, and then goes down and touches another threshold downwards, we wait when CVD makes a datapoint above this threshold. When it happens, we register a long signal
If CVD touches one threshold, and then goes up and touches another threshold upwards, we wait when CVD makes a datapoint below this threshold. When it happens, we register a short signal
However, don’t open new trades against the current volume imbalance state. So don’t open shorts when the CDV line is blue, and don’t open longs when CVD line is red.
Btw, this technique I call it “reclaim” of a level/threshold. It can be applied to horizontal levels, and it’s very powerful especially when you fade levels on very volatility assets like BTC. This technique allows you to Not fade a level straight away, but wait when price goes past the level a bit, and then comes back and reclaims it, only there you enter, and moreover you now have a very well defined risk point.
The last part is multi-timeframe logic. Prefer to act when a lower timeframe is Not against the main timeframe. That’s all, no multiple higher timeframes are needed.
3. How to use it together with Liquidity Analysis script.
That script also has a mean to generate its own signals, and another state variable called Liquidity Imbalance.
So now you’re not only looking at volume imbalance but also at liquidity imbalance that would deny/confirm the CVD based signal. You need at least one of these two to favor your long or short.
This is the same logic widely used in HFT, where MM bots cancel/shift/resize orders when book is too onesided And ordeflow is one sided as well.
4. How did I use both scripts to finish The Leap profitably and skipped many losses.
Even tho you can use structural information as your main strategic layer, as many so-called orderflow traders do, I traded in objective style: my fade signals were volatility based in essence, and I used ordeflow for better entries and stops, but most importantly to skip losses.
When ‘both‘ liquidity imbalance and volume imbalance (in their main timeframes) were against my trades, I skipped them all, saving many ~$500 stop losses (that was my basis risk unit for the Leap). Unless I had a very strong objective signal, i.e. confluence of several signals, or just one higher timeframe signal, I did all these skips.
I traded ~ intraweek timeframe, so I was analyzing either the last 230 30min bars or 1380 5min bars. Both Liquidity Analysis and (signed) Volume Analysis scripts were set to moving window length 46 or 276 for either granularity.
I finished the leap with 9% profit and max DD ~ 5%, a bit short of my goal of 12.5%. If not these 2 scripts I would’ve finished a bit above breakeven I think.
,,,
Another thing, I made these 2 scripts invite-only because they are made particularly for trading, particularly for certain types of market data. These are tools adapted for particular use case, not like my other posts with general math entities like Kernel Density Estimation or Kalman filter, that you can take and apply properly on any data you need yourself.
However these are made from general math entities like everything else. ‘All’ the components are available in my other scripts, ideas, and other sources related to me. If you want to reverse-engineer these, you can find all the components you need in my already posted open source work.
∞

SMC FVG/IFVG (Multi-TF x 4) [ZAUTEC]SMC FVG/IFVG (Multi-TF x 4): Multi-Timeframe Fair Value Gap with Inversed FVG Detection
This powerful Pine Script indicator is designed to help traders identify, track, and manage Fair Value Gaps (FVGs) and their respective Inversed Fair Value Gaps (IFVGs) across up to four different timeframes simultaneously.
Key Features
Multi-Timeframe Analysis (4x): Analyze and display FVGs from four distinct timeframes alongside your current chart, offering a comprehensive view of market imbalances across various scales.
Fair Value Gap (FVG) Detection: Automatically identifies classic three-candle FVGs (market inefficiencies).
Customizable FVG Length: Set how many bars the FVG boxes should initially extend for.
Minimum Gap Size: Filter out minor, insignificant gaps using a tick-based minimum size threshold.
Optional Box Extension: Dynamically extend FVG boxes to the current bar index or use a fixed extension for a cleaner chart.
Inversed FVG (IFVG) Logic: Detects a high-probability reversal pattern where a previously filled FVG zone is immediately followed by the formation of a new, opposite FVG within or adjacent to the same area. This confirms the old FVG has "flipped roles" (e.g., from support to resistance).
Lookback Period: Defines how long the indicator searches for a corresponding FVG breach to confirm the IFVG.
IFVG Minimum Size: Customizable minimum size threshold for the IFVG.
Dynamic Box Management:
Automatic Fill Deletion: FVGs are automatically removed from the chart when price action fully trades through the gap, signifying the imbalance has been "filled."
IFVG Tracking: IFVGs are tracked and removed from the chart after the configurable lookback period.
Full Customization: Control the visibility, colors, border styles (solid, dashed, dotted), and width for FVG, Bearish FVG, Bullish FVG, and IFVG boxes independently for each of the four timeframes.
How to Use
Select Timeframes: Choose up to four desired timeframes in the settings (e.g., "15" for 15-minute, "4H" for 4-hour, "D" for Daily). Leave the field empty to use the chart's current timeframe.
Toggle Visibility: Use the Show FVG and Show IFVG toggles to focus on the imbalances you wish to see.
Adjust Extension: Set Extend Boxes to bar index to true to keep all open FVG boxes drawn all the way to the current live price bar.
Interpret the Gaps:
FVG (Bullish/Bearish): Potential areas for price to return to and find support/resistance.
IFVG (Inverse FVG): Stronger signals that a previous zone of imbalance has been violated and is likely to act as a significant flip zone for future price movements.
This indicator is an essential tool for traders utilizing concepts like ICT (Inner Circle Trader) and SMC (Smart Money Concepts), providing a clear visual representation of market structure and liquidity voids.

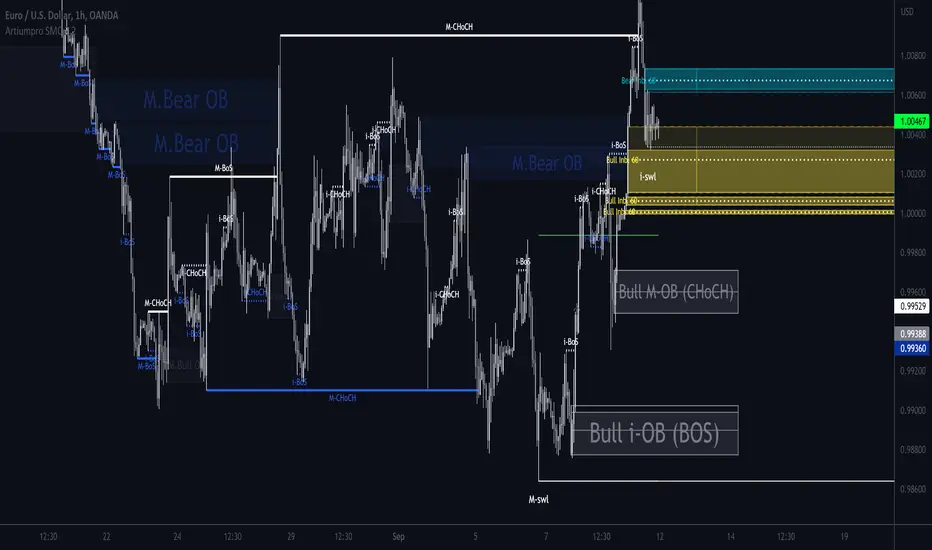
ArtiumPro Smart Money ConceptsSmart money concepts refer to the use of institutional trading strategies which align with the perspectives of Smart Money in the market. i.e. the composite man. Market Structure is the foundation of price action trading, understanding price action is fundamental to SMC.
ArtiumPro SMC 2.1 is an SMC (Smart Money Concepts) indicator full of features to aid SMC traders. Our aim is to save you time with automatic chart mark-up and help you spot areas of interest you may miss with the naked eye.
Fvg (Fair Value Gap) - is also known as an imbalance. An FVG is an imbalance of orders, for instance, for sellers to complete their trades, there must be buyers and vice versa so when a market receives too many of one kind of order buys or sells, and not enough of the order's counterpart. When the amount is not balanced and too many orders are put in for one direction, it creates an imbalance.
Multi timeframe FVG - this will show the same as above but on the higher timeframe you choose. It’ll show as 2 lines that show the higher timeframe fvg with a filled box that mitigates on entry.
Order Blocks - These are supply and demand zones, displayed typically as the last down/up candle before a move in the opposite direction. Great POI’s for entry and take profits.
Outside candle - this is a candle that sweeps the highs and lows of the previous candle, best used for the 1 hour or above these can indicate a change of price direction.
Previous day high & low
Not only does it show your previous day's low and high but it also shows your opening and close of the day. You have settings where you can turn off the open and close and just have daily highs and lows. It’s your choice within your settings.
Market Structure - We have packed this feature with options that are customizable for you,
Break of Structure (BOS) indicates a trend continuation.
Change of Character (CHoCH) indicates the first sign of a possible trend change.
Equal Highs/lows - this will mark your double/triple tops and bottoms.
Retracement - set this to your preferred retracement amount to customize your market structure to what you qualify as a valid pullback.
Elliott Wave ZigZag
Many people ask for the Elliott Waves. Well, here it is, inside this SMC. Just like your pivot highs and lows, the Elliott Wave is showing in real-time so you can see where your previous highs and lows are with the Elliott Wave break of structures that you can use in conjunction with the Smart Money Concepts Indicator of ArtiumPro.
Fib levels - for Premium & Discount areas - in this Instance the fib is used to determine if the price has pulled back into a premium or discount zone for optimal trade entry.
Trading Sessions
One of the most advanced trading session indicators out there and it’s included inside the most advanced SMC indicator on the market today. It has open breakout and settings to filter the opening range along with your pip daily range. You can select what timezone you are in and it automatically adjusts on the chart. Cool right? Hope you enjoy it, happy trading!
Directional Imbalance Index [BigBeluga]🔵 OVERVIEW
The Directional Imbalance Index is designed to track market strength by counting how often price sets new highs or lows over a defined lookback period. Every time a bar forms a new extreme, the indicator records a +1 count for either bullish (highs) or bearish (lows). These counts are aggregated into a rolling calculation, allowing traders to see which side dominates and how directional imbalance evolves.
🔵 CONCEPTS
Each new highest high → adds a bullish count (+1).
Each new lowest low → adds a bearish count (+1).
Counts are stored inside arrays over a user-defined Calculation Period .
for i = 0 to period-1
h = high
l = low
if h == upper
countUp.push(1)
if l == lower
countDn.push(1)
The balance between bullish and bearish counts highlights dominance and imbalance.
Normalized percentages help compare both sides (e.g., 65% bullish vs 35% bearish).
🔵 FEATURES
Counts new highs/lows over a chosen Highest/Lowest Length .
Aggregates values over a rolling Calculation Period .
Plots cumulative bullish vs bearish totals in the subchart.
Displays % share of bulls vs bears from total counts.
On-chart labels mark bars where a count was added.
Plots reference lines of the current upper (high) and lower (low) ranges.
Dynamic fill between bullish/bearish plots to visualize which side dominates.
🔵 HOW TO USE
Look for persistent bullish imbalance (bull % > bear %) as confirmation of upward momentum.
Look for persistent bearish imbalance (bear % > bull %) as confirmation of downward momentum.
Watch for shifts in % dominance — often early signs of trend reversal or weakening strength.
Use labels on the chart to visually confirm which bars contributed to directional bias.
Combine with trend or volume tools to confirm whether imbalance aligns with market direction.
🔵 CONCLUSION
The Directional Imbalance Index offers a systematic way to measure directional pressure. By counting how often price pushes into new territory, the indicator reveals whether bulls or bears are taking control. This makes it a valuable tool for detecting early signs of trend continuation or exhaustion, helping traders align with the side most likely to dominate.

Noise Footprint ImbalanceNoise Footprint Imbalance Indicator
The Noise Footprint Imbalance Indicator highlights areas of imbalance in price action, marking potential zones of support and resistance. This indicator helps traders visualize "footprints" of imbalance on the chart, allowing for better identification of areas where price moves significantly away from equilibrium. This can help traders pinpoint potential reversal points or zones where buyers or sellers may step in.
Features
Customizable Box Count: Choose the maximum number of imbalance zones displayed on the chart, keeping your workspace clear and focused.
Imbalance Detection: Highlights both top and bottom imbalances, identifying them based on price discrepancies between open/close and high/low levels.
Dynamic Zone Boxes: Draws boxes around imbalance zones with customizable colors and transparency, providing visual clarity without overwhelming the chart.
Usage
This indicator is beneficial for traders who:
Use imbalance zones as potential areas of interest for entries or exits.
Want to combine it with other indicators or price action analysis to improve trade setups.
Customization Options
Maximum Imbalance Zones: Adjusts the maximum number of imbalance boxes shown.
Imbalance Box Color: Customize the color and transparency of the imbalance zones to suit your chart's theme.
Add this script to your chart to enhance your technical analysis and bring more structure to your trading approach with the Noise Footprint Imbalance Indicator.

Price ImbalancePrice Imbalance, aka Fair value gap, Missing Price or Inefficiency are like blue foot prints of where price is most likely to visit before doing the next rally up or down. Knowing this is simple however pin pointing these spots can be nerve racking with this indicator you'll never have to worry about all the above mentioned.
How To Use The Price Imbalance Indicator
Load this indicator on your chart, and it will automatically print out a yellow box that's your Imbalance and you can find imbalance in every thing frame.
Which Of These Price Imbalance Is A Valid One To Use
For a Sell Bais the Imbalance with Order Blocks above and liquidity before it is a valid price imbalance. however you might want to take into consideration Market trend and confirmation too.

VOLUME PROFILE WITH FOOTPRINT AND IMBALANCEVOLUME PROFILE WITH FOOTPRINT AND IMBALANCE
A professional-grade market structure analysis tool that combines three powerful trading concepts into one comprehensive indicator: Volume Profile, Footprint Charts, and Imbalance detection. This script provides optimum-level market analysis for trading.
KEY FEATURES
1. Multi-Day Volume Profile
Customizable Row Density: Adjust price level granularity for precise volume distribution analysis
Point of Control (POC): Automatically identifies the price level with highest traded volume
Value Area Calculation: Highlights the price range containing 70% of the day's volume (customizable percentage)
Value Area High (VAH) & Low (VAL): Clear demarcation of institutional acceptance zones
Horizontal Volume Bars: Visual representation of buying vs. selling pressure at each price level
Color-Coded Volume: Distinguishes between value area volume and outlier volume for better visual clarity
2. Previous Day Reference Levels
Previous Day High/Low (PDH/PDL): Critical support/resistance levels from prior session
Previous Day POC: Yesterday's highest volume node - often acts as magnetic price level
Previous Day VAH/VAL: Prior session's value boundaries for gap analysis and mean reversion setups
All previous day levels extend into current session with customizable colors and line styles
3. Virgin Point of Control (VPOC)
Untouched POC Identification: Automatically tracks POC levels that haven't been revisited by price
Real-time Validation: Monitors whether subsequent price action has tested each historical POC
Multi-Day Tracking: Maintains VPOC levels across multiple sessions until filled
High-Probability Targets: Virgin POCs often act as magnets for future price action
4. Footprint Zone Analysis
Footprint Zone Detection: Identifies price levels touched only once during the session
Automated Ribbon Consolidation: Groups consecutive Footprint Zone into visual zones
Price Range Sensitivity: Automatically adjusts granularity based on instrument price
Historical Persistence: Consolidates previous day's footprint zones for multi-day context
Auction Failure Zones: Footprint Zone often indicate areas of poor liquidity and potential reversal points
5. Three-Candle Imbalance Detection
Bullish Imbalance
Bearish Imbalance
Visual Markers: Clear circular indicators on all three candles forming the imbalance
Customizable Colors: Separate colors for bullish and bearish imbalances
Gap Validation: Ensures meaningful price displacement before flagging imbalance

Multi Timeframe Fair Value Gap Indicator ProMulti Timeframe Fair Value Gap Indicator Pro | MTF FVG Imbalance Zones | Institutional Supply Demand Levels
🎯 The Most Comprehensive Multi-Timeframe Fair Value Gap (FVG) Indicator on TradingView
Transform Your Trading with Institutional-Grade Multi-Timeframe FVG Analysis
Keywords: Multi Timeframe Indicator, MTF FVG, Fair Value Gap, Imbalance Zones, Supply and Demand, Institutional Trading, Order Flow Imbalance, Price Inefficiency, Smart Money Concepts, ICT Concepts, Volume Imbalance, Liquidity Voids, Multi Timeframe Analysis
📊 WHAT IS THIS INDICATOR?
The Multi Timeframe Fair Value Gap Indicator Pro is the most advanced FVG detection system on TradingView, designed to identify high-probability institutional supply and demand zones across multiple timeframes simultaneously. This professional-grade tool automatically detects Fair Value Gaps (FVGs), also known as imbalance zones, liquidity voids, or inefficiency gaps - the exact areas where institutional traders enter and exit positions.
🔍 What Are Fair Value Gaps (FVGs)?
Fair Value Gaps are three-candle price formations that create imbalances in the market structure. These gaps represent areas where buying or selling was so aggressive that price moved too quickly, leaving behind an inefficient zone that price often returns to "fill" or "mitigate." Professional traders use these zones as high-probability entry points.
Bullish FVG: When the low of candle 3 is higher than the high of candle 1
Bearish FVG: When the high of candle 3 is lower than the low of candle 1
⚡ KEY FEATURES
📈 Multi-Timeframe Analysis (MTF)
- 12 Timeframes Simultaneously: 1m, 3m, 5m, 15m, 30m, 45m, 1H, 2H, 3H, 4H, Daily, Weekly
- Real-Time Detection: Instantly identifies FVGs as they form across all selected timeframes
- Customizable Timeframe Selection: Choose which timeframes to display based on your trading style
- Higher Timeframe Confluence: See when multiple timeframes align for stronger signals
🎨 Three Professional Visual Themes
1. Dark Intergalactic: Futuristic neon colors with high contrast for dark mode traders
2. Light Minimal: Clean, professional appearance for traditional charting
3. Pro Modern: Low-saturation colors for extended screen time comfort
📊 Advanced FVG Dashboard
- Live FVG Counter: Real-time count of active bullish and bearish gaps
- Total Zone Tracking: Monitor all active imbalance zones at a glance
- Theme-Adaptive Display: Dashboard automatically adjusts to your selected visual theme
- Strategic Positioning: Optimally placed to not interfere with price action
🔧 Smart Zone Management
- Dynamic Zone Updates: FVG boxes automatically adjust when price touches them
- Mitigation Detection: Visual feedback when zones are tested or filled
- Color-Coded Status: Instantly see untested vs tested zones
- Extended Projection: Option to extend boxes to the right for future reference
- Timeframe Labels: Optional labels showing which timeframe each FVG originated from
💡 Intelligent Features
- Automatic Zone Cleanup: Removes fully mitigated FVGs to keep charts clean
- Touch-Based Level Adjustment: Zones adapt to partial fills
- Maximum Box Management: Optimized to handle 500 simultaneous FVG zones
- Performance Optimized: Efficient code ensures smooth operation even with multiple timeframes
🎯 TRADING APPLICATIONS
Day Trading & Scalping
- Use 1m, 3m, 5m FVGs for quick scalp entries
- Combine with higher timeframe FVGs for directional bias
- Perfect for futures (ES, NQ, MNQ), forex, and crypto scalping
Swing Trading
- Focus on 1H, 4H, and Daily FVGs for swing positions
- Identify major support/resistance zones
- Plan entries at untested higher timeframe gaps
Position Trading
- Utilize Daily and Weekly FVGs for long-term positions
- Identify institutional accumulation/distribution zones
- Major reversal points at significant imbalance areas
Multi-Timeframe Confluence Trading
- Stack multiple timeframe FVGs for high-probability zones
- Confirm entries when lower and higher timeframe FVGs align
- Professional edge through timeframe confluence
📚 HOW TO USE THIS INDICATOR
Step 1: Add to Your Chart
Click "Add to Favorites" and apply to any trading instrument - works on all markets including stocks, forex, crypto, futures, and indices.
Step 2: Configure Your Timeframes
In settings, select which timeframes you want to monitor. Day traders might focus on 1m-15m, while swing traders might use 1H-Weekly.
Step 3: Choose Your Visual Theme
Select from three professional themes based on your preference and trading environment.
Step 4: Identify Trading Opportunities
For Long Entries:
- Look for Bullish FVGs (green/cyan zones)
- Wait for price to return to untested zones
- Enter when price shows rejection from the FVG zone
- Higher timeframe FVGs provide stronger support
For Short Entries:
- Look for Bearish FVGs (red/pink zones)
- Wait for price to return to untested zones
- Enter when price shows rejection from the FVG zone
- Higher timeframe FVGs provide stronger resistance
Step 5: Manage Risk
- Place stops beyond the FVG zone
- Use partially filled FVGs as trailing stop levels
- Exit when opposite FVGs form (reversal signal)
🏆 WHY THIS IS THE BEST MTF FVG INDICATOR
✅ Most Comprehensive
- More timeframes than any other FVG indicator
- Advanced features not found elsewhere
- Professional-grade visual presentation
✅ Institutional-Grade
- Based on smart money concepts (SMC)
- ICT (Inner Circle Trader) methodology compatible
- Used by professional prop traders
✅ User-Friendly
- Clean, intuitive interface
- Detailed tooltips and descriptions
- Works out-of-the-box with optimal defaults
✅ Continuously Updated
- Regular improvements and optimizations
- Community feedback incorporated
- Professional development by PineProfits
🔥 PERFECT FOR
- Scalpers seeking quick FVG fills
- Day Traders using multi-timeframe analysis
- Swing Traders identifying major zones
- ICT/SMC Traders following smart money
- Prop Firm Traders needing reliable setups
- Algorithmic Traders building systematic strategies
- Technical Analysts studying market structure
- All Experience Levels from beginners to professionals
💎 ADVANCED TIPS
1. Confluence is Key: The strongest signals occur when multiple timeframe FVGs align at the same price level
2. Fresh vs Tested: Untested FVGs (original color) are stronger than tested ones (gray/muted color)
3. Time of Day: FVGs formed during high-volume sessions (London/NY) are more reliable
4. Trend Alignment: Trade FVGs in the direction of the higher timeframe trend for best results
5. Volume Confirmation: Combine with volume indicators for enhanced reliability
📈 INDICATOR SETTINGS
Visual Settings
- Visual Theme: Choose between Dark Intergalactic, Light Minimal, or Pro Modern
- Show Branding: Toggle PineProfits branding on/off
General Settings
- Move box levels with price touch: Dynamically adjust FVG zones
- Change box color with price touch: Visual feedback for tested zones
- Extend boxes to the right: Project zones into the future
- Plot Timeframe Label: Show origin timeframe on each FVG
- Show FVG Dashboard: Toggle the summary dashboard
Timeframe Selection
Select any combination of 12 available timeframes (1m to Weekly)
🚀 GET STARTED NOW
1. Click "Add to Favorites" to save this indicator
2. Apply to your chart - works on any instrument
3. Join thousands of traders already using this professional tool
4. Follow PineProfits for more institutional-grade indicators
⚖️ DISCLAIMER
This indicator is for educational and informational purposes only. It should not be considered financial advice. Always do your own research and practice proper risk management. Past performance does not guarantee future results. Trade responsibly.
© PineProfits - Professional Trading Tools for Modern Markets
If you find this indicator valuable, please leave a like and comment. Your support helps me create more professional-grade tools for the TradingView community!

MTF Smart Money ConceptsOverview
This indicator displays major elements of Smart Money Concepts and price action trading with multi-timeframes(MTF) and layered market structures with color visualization.
What is Smart Money Concepts?
Smart Money Concepts(SMC) is one of the methodologies to interpret how financial market moves and to analyze it and execute trades, focusing on liquidity and order flow of financial institutions.
Smart money means the funds invested by large financial institutions such as banks, institutional traders/investors, market makers, hedge funds etc. contrary to retail traders/investors' money.
It is important to note that there is no proof or evidence that those institutions move the market as described in Smart Money Concepts.
Personally speaking, it is one of the interpretation of the market and another angle to view the market just like other technical analysis methodologies such as Elliott Wave Principle, Gann Theory, Wyckoff Method and even traditional price action trading.
Importance of MTF Analysis
MTF analysis(a.k.a Topdown analysis) is the foundation to technically analyze charts and the most fundamental skill in trading because lower timeframes are always influenced by upper timeframes where large financial institutions operate.
How to use
This indicator is designed to help traders analyze how the market moves in terms of SMC and price action with multi-timeframes and color visualization of the market structures, which makes this indicator unique and different from other indicators.
There is two key settings that you can use based on your trading style.
1.Upper timeframe selection
You have two options to determine upper timeframe; Auto mode and Manual mode.
When Auto mode selected, upper timeframe will be determined based on chart timeframe as follows.
Chart timeframe => Upper timeframe
1M=>15M
5M/15M=>1H
30M/1H=>4H
4H=>D
D=>W
W=>M
If you select Manual mode, you can fix an upper timeframe.
2.High/low settings
This affects all other settings of the indicator and most importantly designs the market structure.
This is the key setting to determine how you view the market as price action trading is all about highs and lows and story of how highs and lows have been created with the market structure.
You can specify left bars and right bars to identify swing highs/lows and these highs/lows become the basis to design the market structure and determine how SMC elements are displayed.
Example:
Left bar&right bar: 10
You can see bigger wave(magenta line) in the market structure(stepped line).
(Magenta line is a drawn object by manual)
Left bar&right bar: 4
With this setting, you can see smaller wave in the market structure.
Since market moves like wave as there is a lot of wave theories in financial investment/trading industry such as Elliott wave, Wolf wave etc., users can define market structure with this setting depending on what degree of wave they aim to trade.
Functions:
MTF Order Block
Concept
Order block is a block of orders where buying orders and selling orders are accumulated. Order blocks are created when the institutions move the market up and down, temporality placing orders in an opposite direction to the way they want to move, in order to match their own orders with counter-orders.
Visualization by the indicator
The indicator displays both chart timeframe's order blocks and upper timeframe's order blocks(MTF).
You can also select from two options how to display order blocks;
1. Show all order blocks
2. Show strong order blocks only
Note: Strong order blocks mean order blocks created at strong highs/lows. See also strong high/low below.
Alerts can be set when prices reach strong order blocks.
MTF Fair Value Gap(FVG)/Imbalance
Concept
Fair Value Gap(FVG)(Imbalance) is a void generated among three consecutive candlesticks.
FVG(s) is created when the market moves so rapidly generating buy side or sell side order imbalances.
FVG(s) is characterized by price action that prices tend to come back to the area where FVG(s) exists, filling in the space among the candlesticks.
Visualization by the indicator
The indicator displays both chart timeframe's FVG and upper timeframe's FVG.
MTF Liquidity Grab
Concept
Liquidity grab is price action to sweep liquidity for the institutions to move the market.
This price action often happens because the size of their orders is so huge and they need a bunch of counter-orders to match their orders. This is why prices sometimes come to areas where liquidity rest and swipe them before the market goes up/down.
Liquidity visualization
Where does liquidity rest?
The answer is above highs(buy side liquidity) and below lows(sell side liquidity).
Among all highs and lows, swing highs and lows are where liquidity is accumulated the most because swing highs and lows can be created only by the institutions, therefore massive liquidity is indicated.
Visualization by the indicator
The indicator displays liquidity dots so that users can easily identify where liquidity rests and liquidity grab of both a chart timeframe and an upper timeframe.
Alerts can be set when liquidity grab happens.
MTF Strong High/Low
Concept
Strong high/low literally means strong highs and lows among all highs and lows including swing highs and lows.
There is a few different definitions of strong high/low in price action trading and the definition in this indicator is as follows.
Strong high
A high that that breaks higher low or lower low
Strong low
A low that breaks lower high or higher high
Visualization by the indicator
The indicator displays strong highs and lows of both a chart timeframe and an upper timeframe.
MTF Market Structure Visualization
Concept
Market structure is a series of price movement with highs and lows which outlines the way the market directs. It is a basis to see trend occurrence, trend reversal and sideways and analyzing the market structures in multi-timeframes is the most fundamental technical skill in trading/investment.
Visualization by the indicator
The indicator displays market structures of both a chart timeframe and an upper timeframe and provide color visualization depending on bullish and bearish market structures.
The definition of bullish and bearish market structure is as follows.
Bullish market structure
When a price breaks a Lower High or Higher High
Bearish market structure
When a price breaks a Higher Low or Lower Low
Settings
All the functions above, colors and line settings are parameterized and can be turned on/off depending on users’ needs.
———————————————————————————
概要
Smart Money Concepts(SMC)およびプライスアクショントレードにおける重要な要素をマルチタイムフレームで表示することのできるインジケーターです。
相場構造(Market structure)をマルチタイムフレームで表示し、相場構造の強弱を色で可視化することができます。
Smart Money Concepts(スマートマネーコンセプト)とは?
Smart Money Concepts(以下SMC) は金融市場がどのように動くかを解釈し、分析し、取引を執行するための相場理論の一つであり、Liquidity(リクイディティ)および機関投資家のオーダーフロー(注文の流れ)に焦点を置いていることが特徴です。
Smart Money(スマートマネー)とは、銀行や機関投資家、マーケットメーカー、ヘッジファンドといった金融機関が動かす資金を意味し、個人投資家の資金と対をなす概念です。
重要な点は、実際に上記の金融機関がSmart Money Conceptsで語られているような相場の動かし方をしているかどうかを証明する明確なエビデンスはないということです。
個人的には、エリオット波動理論やギャン理論、ワイコフ理論、伝統的なプライスアクショントレーディングの方法論と同様に、マーケットの動きを解釈するための一つの方法論であり、マーケットの動きを別の角度から見る枠組みと捉えています。
マルチタイムフレーム(MTF)分析の重要性
MTF分析はチャートをテクニカルに分析する上での基礎であり、トレードにおいて最も重要なスキルです。なぜなら下位のタイムフレームは上記のような金融機関が資金運用を行う上位のタイムフレームの影響を常に受けるためです。
使い方
このインジケーターは、SMCまたはプライスアクショントレードの観点から、トレーダーがマーケットをマルチタイムフレームで分析することを支援するために開発しています。
相場構造(Market structure/マーケットストラクチャー)を方向性に応じて色で可視化することができるため、視覚的に相場の構造を判断できることがこのインジケータのユニークな点であり、他のインジケーターと異なる点です。
ユーザーのトレードスタイルに応じて、以下の二つの設定を行うことができます。
1.上位足の決定方法
ユーザーは上位足のタイムフレームを決定するにあたり、AutoモードとManualモードを選択することができます。
Autoモードを選択した場合、上位足はチャートのタイムフレームに応じて以下のように決定されます。
チャートタイムフレーム => 上位足タイムフレーム
1M=>15M
5M/15M=>1H
30M/1H=>4H
4H=>D
D=>W
W=>M
Manualモードを選択すると上位足のタイムフレームを固定することができます。
2.High/low(高値/安値) 設定
当設定はインジケーターの他の全ての機能に影響し、また最も重要である相場構造の定義に影響します。
当設定はユーザーがマーケットをどのように見るか(=どの程度の粒度)を決定する重要な設定です。なぜならプライスアクショントレードは、高値、安値とそれらが相場構造をどのように構築してきたかの一連の流れを分析することが全てだからです。
ユーザーは相場構造を決定付けるスイングハイ·スイングローを特定するためのバーの本数を設定することができます。ここで設定した内容が、相場構造を定義し、以下で説明するSMCの要素の表示を決定することになります。
例:
Left bar&right bar(左右のバーの数): 10
この場合、ステップラインで示した相場構造の中に大きな波(マゼンタの波)を見ることができます。
(マゼンタのラインは手動で描いたオブジェクト)
Left bar&right bar: 4
この設定では、上記に比べて小さい波を描いていることが確認できます。
相場理論の中にエリオット波動理論やウォルフ波動といった数多くの波動理論があることからわかるように、相場は波として動きます。どの粒度の波を狙うかというトレーダーのスタイルに応じて、設定を変更することができます。
機能
MTFオーダーブロック
コンセプト
オーダーブロックとは買い注文と売り注文が一連となって蓄積されたオーダー(注文)のブロックのことです。
オーダーブロックは機関投資家が相場を動かす際に、本来意図する方向とは一時的に逆に動かすことで、彼ら自身の注文をマッチングさせるための反対注文を発生させることで形成されます。
インジケーターによる表示
インジケーターはチャートタイムフレームのオーダーブロックと上位足のオーダーブロックの両方を表示することができます。
また、オーダーブロックの表示オプションとして、
1.全てのオーダーブロックを表示
2.Strong(ストロング)オーダーブロックのみを表示
を選択することが可能です。
注: StrongオーダーブロックはStrong High/Lowで形成されるオーダーブロックを指します。(下記参照)
また、オーダーブロック到達でのアラート設定も可能です。
MTFフェアーバリューギャップ(FVG)/インバランス
コンセプト
フェアーバリューギャップ(FVG)/インバランスとは連続する3つのローソク足の間に形成される溝(Gap)のことです。
フェアーバリューギャップはマーケットが非常に早く動いたことにより、買いオーダーと売りオーダーの需給バランスが崩れることによって発生します。
フェアーバリューギャップには、価格がフェアーバリューギャップが発生したエリアまで戻ってくる傾向があるという特徴が存在します。
インジケーターによる表示
インジケーターはチャートタイムフレームのフェアーバリューギャップと上位足のフェアーバリューギャップの両方を表示することができます。
MTF Liquidity Grab(リクイディティ·グラブ)
コンセプト
Liquidity(リクイディティ)とはマネー、つまり注文です。
Liquidity Grab(リクイディティ·グラブ)とは、機関投資家がマーケットを動かす際にLiquidityを取得するプライスアクションのことを指します。
このプライスアクションは、機関投資家が処理する注文サイズが非常に大きいため、自身の注文を出す際に大量の反対注文を必要とすることからしばしば発生します。
これが、価格がLiquidity(注文)の集まっているエリアに接近し、それら注文をスワイプ(狩り取る)した後に上昇·下落する理由です。
Liquidityの可視化
一般的にLiquidityは高値の上(buy side liquidity)、安値の下(sell side liquidity)に存在します。
全ての高値·安値の中で、スイングハイ·ローがliquidityが最も蓄積されているエリアということができます。なぜならスイングハイ·ローは機関投資家の注文によってのみ形成されるからです。
インジケーターによる表示
ユーザーがLiquidityポイントを簡単に識別できるようにLiquidityをドット表示することが可能です。またチャートタイムフレームと上位足の両方のLiquidity Grabを表示することができます。
Liquidity Grab発生時にアラートも設定可能です。
MTF Strong High/Low(ストロングハイ·ロー)
コンセプト
Strong high/lowは文字通り、強い高値·安値のことを指します。
トレーダーの間でいくつかの異なる定義が存在しますが、当インジケーターでの定義は以下の通りです。
Strong high
Higher low(ハイアーロー) または Lower low(ロワーロー)をブレイクした高値
Strong low
Lower higher (ロワーハイ) または Higher High(ハイアーハイ)をブレイクした安値
インジケーターによる表示
チャートタイムフレーム、上位足のStrong High/Lowを表示することが可能です。
相場構造可視化
コンセプト
相場構造(Market structure/マーケットストラクチャー)とは、相場の流れを成り立たせる高値と安値を元にした一連の値動きです。建物における骨組みに該当します。
トレンドの発生、転換、レンジを見極めるための基礎であり、マルチタイムフレームで相場構造を分析することは、投資·トレードにおいて最も重要なテクニカルスキルです。
インジケーターによる表示
チャートタイムフレームと上位足タイムフレーム両方の相場構造を表示することができます。
また、相場構造が強気の状態か弱気の状態かを色で可視化するため、上位足含めた相場の流れを視覚的に判断することが可能です。
相場構造の強弱の定義は以下の通りです。
強気の相場構造(Bullish market structure)
価格がLower HighまたはHigher Highをブレイクしたとき
弱気の相場構造(Bearish market structure)
価格がHigher LowまたはLower Lowをブレイクしたとき
設定
上記の全ての機能は色やライン設定含めパラメーターで設定が可能です。またユーザの必要に応じて表示·非表示を切り替えることができます。
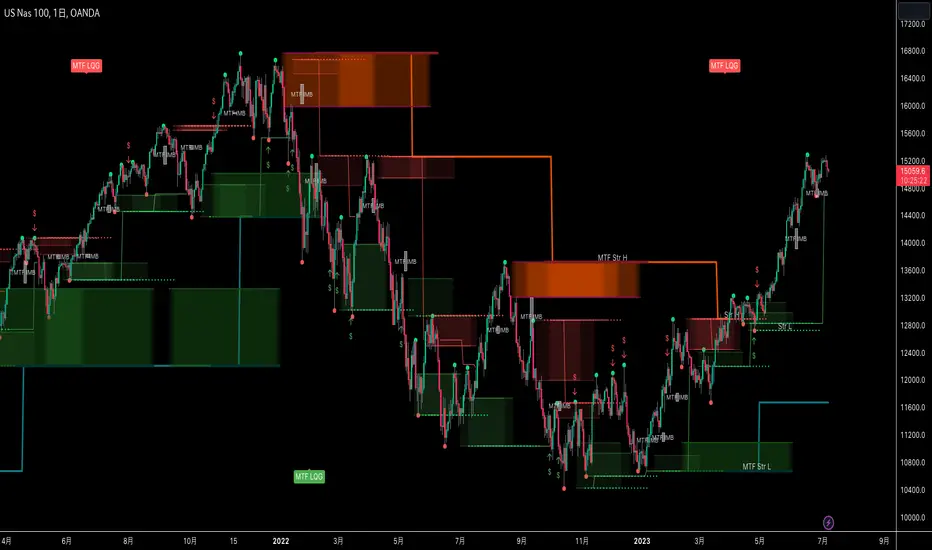
DUN Lines IndicatorThe DUN Lines indicator detects, filters and plots price imbalances (aka fair value gaps or fvgs/ifvgs). It is unique in the fact that it uses five timeframes and filters out overlapping, lower timeframe imbalances and fvgs below a user-definable size threshold.
Simply set your detection timeframes, colors and thresholds then set your chart to your preferred entry timeframe. When imbalances are mitigated, the FVG/IFVG is removed from the chart.
The indicator's default colors are my preferred ones for differentiating between timeframes, but these are easily changed. A single color with various levels of transparency to indicate timeframe strength is another approach that works nicely.
Volume Flow ImbalanceVolume Flow Imbalance (VFI) Indicator
The Volume Flow Imbalance (VFI) indicator is designed to provide traders with insights into the market's buying and selling pressure by calculating the imbalance between buy and sell volumes over a user-defined lookback period. This indicator is particularly useful for identifying potential pivot points and market sentiment shifts.
How to Use :
Setup Parameters :
Lookback Period: Set the number of bars over which the imbalance is calculated. Increasing this number provides a broader view of market trends.
Lower Timeframe Data: Optionally enable this feature to analyze volume data from lower timeframes, offering a more granified view of volume flows.
Interpreting the Indicator :
The VFI outputs a value that represents the net imbalance between buying and selling volumes. Positive values indicate a predominance of buying volume, suggesting bullish conditions, while negative values suggest bearish conditions with more selling volume.
The indicator also provides dynamic threshold lines based on the standard deviation of the calculated imbalances, helping to visually identify extreme conditions where reversals might occur.
Application :
Apply the VFI to any chart to assess the balance of trade volumes in real-time.
Use the indicator in conjunction with other technical analysis tools to confirm trends or potential reversals.
Tips :
Adjust the lookback period based on the volatility and trading volume of the asset to optimize performance.
The VFI is best used in liquid markets where volume data is a reliable indicator of market activity.
By providing a clear measure of how much buying and selling is occurring relative to the past, the VFI helps traders make informed decisions based on underlying market dynamics.
