Indicator: Vertical Horizontal Filter (VHF)VHF determines whether prices are in trending or congestion phase. Rising edge signifies a trend, falling edge signifies prices may be entering congestion phase.
Many use this as a contrarian indicator, which is my personal preference too.
I have added an option to plot EMA too, to see how strong the trend/no-trend values are.
Cari dalam skrip untuk "indicator"


Multi-EMA IndicatorIndicator Purpose
The "Multi EMA Indicator" is a clean, customizable script that plots up to four Exponential Moving Averages (EMAs) on the price chart simultaneously. It is designed for traders who want full control over which EMAs are displayed, their periods, colors, and visibility — without cluttering the chart or needing multiple separate EMA indicators.
User-Configurable Options (all adjustable from the indicator’s settings panel):Option
All EMAs are calculated using the close price and are plotted with a linewidth of 2 for clear visibility. Users can instantly show/hide any combination of the four EMAs and change their colors to match any charting style or strategy (e.g., 9/21 crossover, 50/200 golden cross, etc.).

Adjustable Bull Bear Candle Indicator (V1.2)Indicator Description: Adjustable Bull Bear Candle Indicator
This indicator, named "Adjustable Bull Bear Candle Indicator ," is designed to assist traders in identifying potential bullish and bearish signals within price charts. It combines candlestick pattern analysis, moving average crossovers, and RSI (Relative Strength Index) conditions to offer insights into potential trading opportunities.
Disclaimer:
Trading involves substantial risk and is not suitable for every investor. This indicator is a tool designed to aid in technical analysis, but it does not guarantee successful trades. Always exercise your own judgment and seek professional advice before making any trading decisions.
Key Features:
Preceding Candles Analysis:
The indicator examines the behavior of the previous 'n' candles to identify specific patterns that indicate bearish or bullish momentum.
Candlestick Pattern and Momentum:
It considers the relationship between the opening and closing prices of the current candle to determine if it's bullish or bearish. The indicator then assesses the absolute price difference and compares it to the cumulative absolute differences of preceding candles.
Moving Averages:
The indicator calculates two Simple Moving Averages (SMAs) – Close SMA and Far SMA – to help identify trends and crossovers in price movement.
Relative Strength Index (RSI):
RSI is used as an additional measure to gauge momentum. It analyzes the current price's magnitude of recent gains and losses and compares it to past data.
Time Constraint:
If enabled, the indicator operates within a specific time window defined by the user. This feature can help traders focus on specific market hours.
Customizable Alerts:
The indicator includes an alert system that can be enabled or disabled. You can also adjust the specific alert conditions to align with your trading strategy.
How to Use:
This indicator generates buy signals when specific conditions are met, including a bullish candlestick pattern, positive price difference, closing price above the SMAs, RSI above a threshold, preceding bearish candles, and optionally within a specified time window. Conversely, short signals are generated under conditions opposite to those of the buy signal.
Disclosure and Risk Warning:
Educational Tool: This indicator is meant for educational purposes and to aid traders in their technical analysis. It's not a trading strategy in itself.
Risk of Loss: Trading carries inherent risks, including the potential for substantial loss. Always manage risk and consider using proper risk management techniques.
Diversification: Do not rely solely on this indicator. A well-rounded trading approach includes fundamental analysis, risk management, and proper diversification.
Consultation: It's strongly advised to consult with a financial professional before making any trading decisions.
Conclusion:
The "Bullish Candle after Bearish Candles with Momentum Indicator" can be a valuable tool in your technical analysis toolkit. However, successful trading requires a deep understanding of market dynamics, risk management, and continual learning. Use this indicator in conjunction with other tools and strategies to enhance your trading decisions.
Remember that past performance is not indicative of future results. Always be cautious and informed when participating in the financial markets.

HYE Combo Market [Indicator] (Vwap Mean Reversion+Trend Hunter)Indicator version of the strategy:
* Alerts added.
TIPS AND WARNINGS
1-) The standard settings of this combo script is designed and tested with daily timeframe. For lower timeframes, you should change the indicator settings and find the best value for yourself.
2-) Only the mean vwap line is displayed on the graph. For a detailed view, you can delete the "//" marks from the plot codes in the script code.
3-) This is an indicator for educational and experimental purposes. It cannot be considered as investment advice. You should be careful and make your own risk assessment when opening real market trades using this indicator.

Indicator SummaryThis is a proof of concept for an indicator summary.
If the indicator color is green, it's bullish. Red is bearish.
This will be improved over time with more indicators.

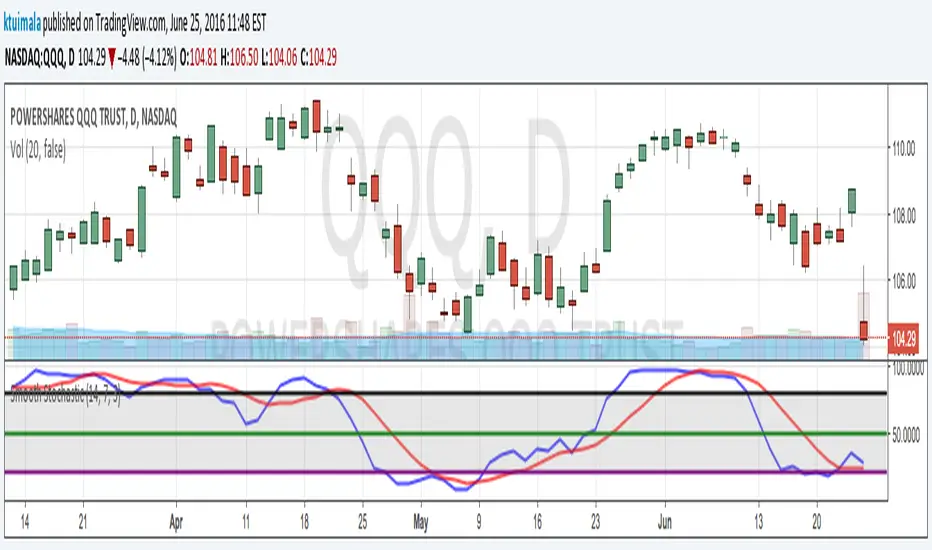
KT_Smooth_StochasticI normally don't publish my indicators. However, I couldn't find a smoothed stochastic on TradingView officially or unofficially. This is a standard implementation of a smoothed Fast Stochastic where %K and %D are calculated and then smoothed by n periods. This helps to reduce chop and gives better extreme signals.
I have defaulted the indicator to use commonly used settings where %K is over 14 periods, %D is over 7 period, and the smoothing factor is 3 periods. I have also defaulted the extreme lines to an upper band of 80, mid band of 50, and lower band of 20. However, my favorite settings are %K = 10, %D = 10, Smooth = 3, upper band = 75, mid band = 50, and lower band = 25.
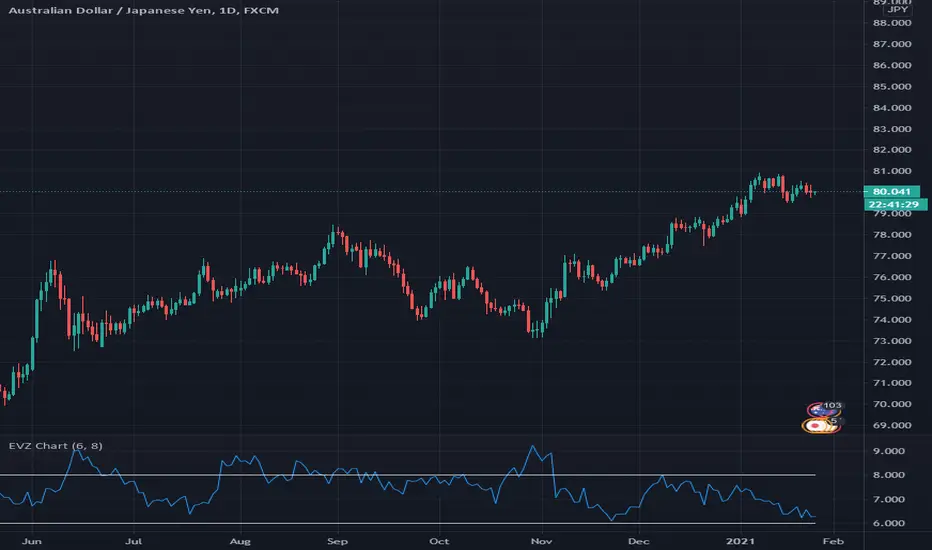
Indicator - EVZ Chart - DGHey Traders, this is the $EVZ chart plotted as an indicator. The $EVZ is the Euro Volatility Index, which can be used to measure volatility in markets.
The use of the $EVZ could be helpful for trend traders of FX. The concept developed by VP of no nonsense forex, we can use the value of the $EVZ to determine when we put on full risk if there is high volatility, half risk when there is medium volatility, or no risk if there is very low volatility.
This indicator has 2 adjustable horizontal lines, so you can put in the conditions or thresholds you need for your trading strategy.
Happy trading,
DG
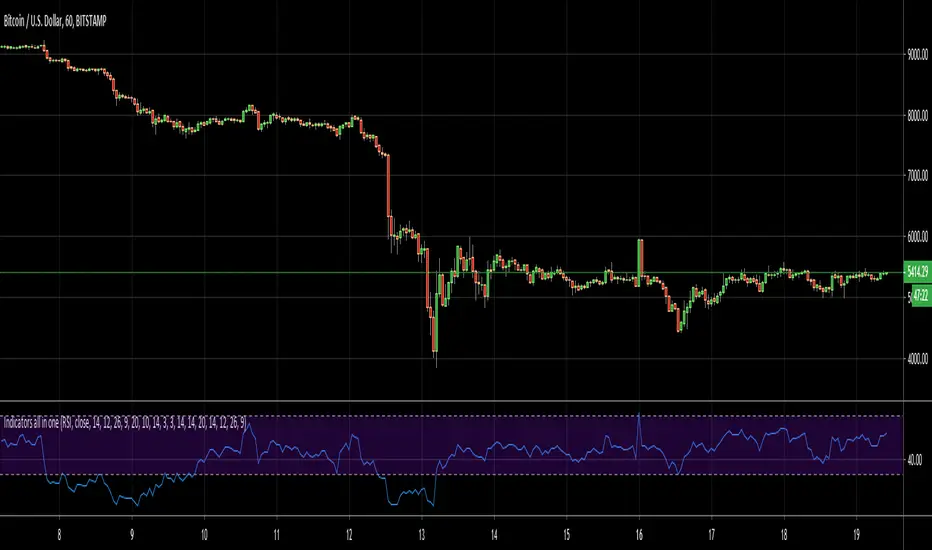
Indicators all in oneHello Everyone . Sometimes we need some indicators and each one needs seperated window. with this tool we can see indicators by choosing it from pull down menu, in the same window.
Currently you can choose RSI, MACD, Commodity Channel Index (CCI), Momentum, Stochastic, Stochastic RSI, Directional Movement Index (DMI), Chaikin Money Flow (CMF), On-Balance Volume (OBV), Average True Range (ATR), Volume Weigthed MACD (VWMACD).
some screen shots:
DMI:
MACD:
Stochastic RSI
Let me know if you need any other indicator in this tool.
Enjoy!
Indicator - Multiple Moving Averages 1.0Features:
- Each moving average has customizable length, type and source
- The ability to change the source of all moving averages with one input (changing an individual MA source will override the general for that MA)
- At a glance comparison of 20 SMA and 20 VWMA to gauge volume trend
Defaults: Four SMAs (20, 50, 100, 200) and a 20 VWMA.
Usage:
- Use Fibonacci levels, pivots .etc for confluence
- Personally, I like to set overall source to low in uptrends, to high in downtrends and then set alerts for when the price crosses any of the averages. Then pay particular attention to the candlesticks and other indicators.
TODO:
- Add alerts option so that it send alert on crossing up or down any alert lines.

Elder Impulse SystemQuickly Identify Trends with the Elder Impulse Indicator.
Pretty much the same as , but written from scratch to be simpler to use and the source code easier to read (no offense, LazyBear)
For more info, see stockcharts.com
Stochastic with False bar R2-2 by JustUncleLThis study project is an updated version of the implementation of the "Stochastic False BAR" indicator.
Description:
The standard Stochastic buy/sell indications come from Stochastic crosses about the standard overbought/oversold zones (80/20). This does not always work and you get stuck in the OB/OS zones with a trend continuation. Utilising a second much longer length Stochastic, the "False BAR" (Black) indicates when it is unsafe to take Stochastic cross over trades. Where the false bar does not appear (aqua, no background highlighing), the overbought / oversold conditions of the Stochastic can be considered higher-probability reversal areas and thus trading opportunities.
This Revision:
Added options to enable/disable False Bar lines and Stochastic trends.
Added options to modify upper and lower limits of false bar Stochastic and trading stochastic trend.
Added option to show the trading Stochastic as coloured Ribbon.
Added name titles for all plots
Added Background highlighting for False Bar.

Indicator Test with Conditions TableOverview: The "Indicator Test with Conditions Table" is a customizable trading strategy developed using Pine Script™ for the TradingView platform. It allows users to define complex entry conditions for both long and short positions based on various technical indicators and price levels.
Key Features:
Customizable Input Conditions:
Users can configure up to three input conditions for both long and short entries, each with its own logical operator (AND/OR) for combining conditions.
Input conditions can be based on:
Price Sources: Users can select any price data (e.g., close, open, high, low) for each condition.
Comparison Operators: Users can choose from a variety of operators, including:
Greater than (>)
Greater than or equal to (>=)
Less than (<)
Less than or equal to (<=)
Equal to (=)
Not equal to (!=)
Crossover (crossover)
Crossunder (crossunder)
Logical Operators:
The strategy provides options for combining conditions using logical operators (AND/OR) for greater flexibility in defining entry criteria.
Dynamic Condition Evaluation:
The strategy evaluates the defined conditions dynamically, checking whether they are enabled before proceeding with the comparison.
Users can toggle conditions on and off using boolean inputs, allowing for quick adjustments without modifying the code.
Visual Feedback:
A table is displayed on the chart, providing real-time status updates on the conditions and whether they are enabled. This enhances user experience by allowing easy monitoring of the strategy's logic.
Order Execution:
The strategy enters long or short positions based on the combined conditions' evaluations, automatically executing trades when the criteria are met.
How to Use:
Set Up Input Conditions:
Navigate to the strategy’s input settings to configure your desired price sources, operators, and logical combinations for long and short conditions.
Monitor Conditions:
Observe the condition table displayed at the bottom right of the chart to see which conditions are enabled and their current evaluations.
Adjust Strategy Parameters:
Modify the conditions, logical operators, and input sources as needed to optimize the strategy for different market scenarios or trading styles.
Execution:
Once the conditions are met, the strategy will automatically enter trades based on the defined logic.
Conclusion: The "Indicator Test with Conditions Table" strategy is a robust tool for traders looking to implement customized trading logic based on various market conditions. Its flexibility and real-time monitoring capabilities make it suitable for both novice and experienced traders.

Indicator Panel MTF (MACD, RSI, Momentum, Stoch, CCI)This script shows the values of MACD, RSI, Momentum, Stoch, CCI for current and higher time frames in a panel. if higher time frame is equal or smaller than current time frame and it doesn't show the values for HTF.
And also it shows if their values are increasing, decreasing or equal to last value with "▲", "▼", "="
The signal length for all indicators is 9 and used EMA.
histogram value is indicator value - it's signal value. with this value you can see that indicator and its signal getting closer or not. you may think it's as momentum.
Some functions and idea is used from following scripts:
Thanks to Lucf for the following script:
Thanks to Ricardo Santos for the following script:

Intraday TS ,BB + Buy/Sell +Squeeze Mom.+ adx-dmiIntraday 5+ min indicator/strategy. Mix of indicator as BB, Ema , Roc , adx/dmi with buy and TP/SL point. All in 1 indicator easy to use . Just look the color chnge and the shape add the the bars

Momentum Marks - Buy and Sell IndicatorsIndicator Overview
This tool is a multi‑factor entry signal system designed to highlight potential BUY and SHORT opportunities directly on the chart with hard‑anchored labels. It combines trend, momentum, volatility, and volume conditions to reduce noise and provide more reliable trade signals.
Core Components
- EMA Trend Filter
- Uses a fast EMA (9) and a slow EMA (21) to determine short‑term vs. medium‑term trend direction.
- Signals only trigger when price aligns with the EMA relationship (e.g., fast above slow for shorts, fast below slow for buys).
- RSI Extremes
- RSI thresholds (default 65/35) ensure signals occur only when momentum is stretched into overbought or oversold zones.
- Helps avoid false triggers during neutral conditions.
- Linear Regression Channel
- A regression line with ±2 standard deviation bands defines dynamic support and resistance.
- Signals require price to be near the top (for shorts) or bottom (for buys) of the channel, adding a structural filter.
- TTM Squeeze Histogram
- Measures momentum shifts by comparing price to its EMA.
- Signals require histogram confirmation: weakening momentum for shorts, strengthening momentum for buys.
- Volume Confirmation
- Volume must fade for shorts or surge for buys relative to a 20‑period average.
- Ensures signals align with participation strength.
Visual Output
- Red “SHORT” label above bars when all short conditions align.
- Green “BUY” label below bars when all buy conditions align.
- Optional plotshape arrows (triangles) as backup markers.
- Linear regression channel shaded between upper and lower bands.
- EMA lines plotted for trend context.
Key Features
- Hard‑anchored labels: Signals are locked to confirmed bars, preventing repainting or shifting.
- Multi‑layer confirmation: Requires trend, momentum, volume, and structure to align before firing.
- Customizable inputs: Users can adjust EMA lengths, RSI thresholds, regression length, and squeeze parameters.

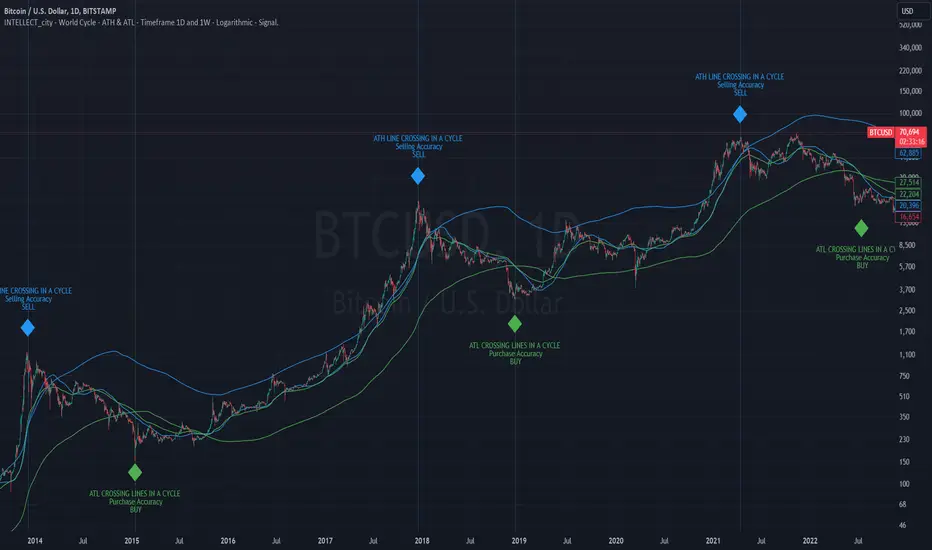
intellect_city - World Cycle - Ath & Atl - Logarithmic - Signal.Indicator Overview
INTELLECT_city - World Cycle - ATH & ATL - Timeframe 1D and 1W - Logarithmic - Signal - The Pi Cycle Top and Bottom Oscillator is an adaptation of the original Pi Cycle Top chart. It compares the 111-Day Moving Average circle and the 2 * 350-Day Moving Average circle of Bitcoin’s Price. These two moving averages were selected as 350 / 111 = 3.153; An approximation of the important mathematical number Pi.
When the 111-Day Moving Average circle reaches the 2 * 350-Day Moving Average circle, it indicates that the market is becoming overheated. That is because the mid time frame momentum reference of the 111-Day Moving Average has caught up with the long timeframe momentum reference of the 2 * 350-Day Moving Average.
Historically this has occurred within 3 days of the very top of each market cycle.
When the 111 Day Moving Average circle falls back beneath the 2 * 350 Day Moving Average circle, it indicates that the market momentum of that cycle is significantly cooling down. The oscillator drops down into the lower green band shown where the 111 Day Moving Average is moving at a 75% discount relative to the 2 * 350 Day Moving Average.
Historically, this has highlighted broad areas of bear market lows.
IMPORTANT: You need to set a LOGARITHMIC graph. (The function is located at the bottom right of the screen)
IMPORTANT: The INTELLECT_city indicator is made for signal purchases of sales, there is also a strategic one from INTELLECT_city
IMPORTANT: The Chart shows all cycles, both buying and selling.
IMPORTANT: Suitable timeframes are 1 daily (recommended) and 1 weekly
-----------------------------
Описание на русском:
-----------------------------
Обзор индикатора
INTELLECT_city - World Cycle - ATH & ATL - Timeframe 1D and 1W - Logarithmic - Signal - Логарифмический - Сигнал - Осциллятор вершины и основания цикла Пи представляет собой адаптацию оригинального графика вершины цикла Пи. Он сравнивает круг 111-дневной скользящей средней и круг 2 * 350-дневной скользящей средней цены Биткойна. Эти две скользящие средние были выбраны как 350/111 = 3,153; Приближение важного математического числа Пи.
Когда круг 111-дневной скользящей средней достигает круга 2 * 350-дневной скользящей средней, это указывает на то, что рынок перегревается. Это происходит потому, что опорный моментум среднего временного интервала 111-дневной скользящей средней догнал опорный момент импульса длинного таймфрейма 2 * 350-дневной скользящей средней.
Исторически это происходило в течение трех дней после вершины каждого рыночного цикла.
Когда круг 111-дневной скользящей средней опускается ниже круга 2 * 350-дневной скользящей средней, это указывает на то, что рыночный импульс этого цикла значительно снижается. Осциллятор опускается в нижнюю зеленую полосу, показанную там, где 111-дневная скользящая средняя движется со скидкой 75% относительно 2 * 350-дневной скользящей средней.
Исторически это высветило широкие области минимумов медвежьего рынка.
ВАЖНО: Выставлять нужно ЛОГАРИФМИЧЕСКИЙ график. (Находиться функция с правой нижней части экрана)
ВАЖНО: Индикатор INTELLECT_city сделан для сигнальных покупок продаж, есть также и стратегический от INTELLECT_сity
ВАЖНО: На Графике видны все циклы, как на покупку так и на продажу.
ВАЖНО: Подходящие таймфреймы 1 дневной (рекомендовано) и 1 недельный
-----------------------------
Beschreibung - Deutsch
-----------------------------
Indikatorübersicht
INTELLECT_city – Weltzyklus – ATH & ATL – Zeitrahmen 1T und 1W – Logarithmisch – Signal – Der Pi-Zyklus-Top- und Bottom-Oszillator ist eine Anpassung des ursprünglichen Pi-Zyklus-Top-Diagramms. Er vergleicht den 111-Tage-Gleitenden-Durchschnittskreis und den 2 * 350-Tage-Gleitenden-Durchschnittskreis des Bitcoin-Preises. Diese beiden gleitenden Durchschnitte wurden als 350 / 111 = 3,153 ausgewählt; eine Annäherung an die wichtige mathematische Zahl Pi.
Wenn der 111-Tage-Gleitenden-Durchschnittskreis den 2 * 350-Tage-Gleitenden-Durchschnittskreis erreicht, deutet dies darauf hin, dass der Markt überhitzt. Das liegt daran, dass der Momentum-Referenzwert des 111-Tage-Gleitenden-Durchschnitts im mittleren Zeitrahmen den Momentum-Referenzwert des 2 * 350-Tage-Gleitenden-Durchschnitts im langen Zeitrahmen eingeholt hat.
Historisch gesehen geschah dies innerhalb von 3 Tagen nach dem Höhepunkt jedes Marktzyklus.
Wenn der Kreis des 111-Tage-Durchschnitts wieder unter den Kreis des 2 x 350-Tage-Durchschnitts fällt, deutet dies darauf hin, dass die Marktdynamik dieses Zyklus deutlich nachlässt. Der Oszillator fällt in das untere grüne Band, in dem der 111-Tage-Durchschnitt mit einem Abschlag von 75 % gegenüber dem 2 x 350-Tage-Durchschnitt verläuft.
Historisch hat dies breite Bereiche mit Tiefstständen in der Baisse hervorgehoben.
WICHTIG: Sie müssen ein logarithmisches Diagramm festlegen. (Die Funktion befindet sich unten rechts auf dem Bildschirm)
WICHTIG: Der INTELLECT_city-Indikator dient zur Signalisierung von Käufen oder Verkäufen, es gibt auch einen strategischen Indikator von INTELLECT_city
WICHTIG: Das Diagramm zeigt alle Zyklen, sowohl Kauf- als auch Verkaufszyklen.
WICHTIG: Geeignete Zeitrahmen sind 1 täglich (empfohlen) und 1 wöchentlich
MTF Stochastic ScannerThis Stochastic scanner can be use to identify overbought and oversold of 10 symbols over multiple timeframes
it will give you a quick overview which pair is more overbough or more oversold and also signals tops and bottoms in the AVG row
light red/green cell = weak bearish (Stoch = 30-20) / bullish (Stoch = 70-80)
medium red/green cell = bearish (Stoch = 20-10) / bullish (Stoch = 80-90)
dark red/green cell = strong bearish (Stoch <= 10) / bullish (Stoch >= 90)
gray cell = neutral (Stoch = 30-70)
Usage
If AVG (average of all 4 timeframes) falls below 20, the cell will get green, indicating a good time to enter long (buy)
If AVG (average of all 4 timeframes) rises above 80, the cell will get red, indicating a good time to enter short (sell)
Use the "MTF Stochastic Scanner" in combination with the " MTF RSI Scanner "
to find tops (RSI MTF avg >=70 AND Stochastic MTF avg >= 80)
or bottoms (RSI MTF avg <= 30 AND Stochastic MTF avg <= 20)
Here is how the two MTF scanners looked on Nov 08 2021 (ATH) »
and here how the MTF scanners looked on June 21 2022
use TradingViews Replay function to check how it would have worked in the past and when not.
As always… there NOT a single indicator that can show to the top & bottom 100% every single time. So use with caution, with other indicators and/or deeper understanding of technicals analysis ☝️☝️☝️
Settings
You can change the timeframes, symbols, Stochastic settings, overbought/oversold levels and colors to your liking
Drag the table onto the price chart, if you want to use it as an overlay.
NOTE:
Because of the 4x10 security requests, it can take up to 1 minute for changed settings to take effect! Please be patient 🙃
If you have any idea on how to optimise the code, please feel free to share 🙏
*** Inspired by "Binance CHOP Dashboard" from @Cazimiro and "RSI MTF Table" from @mobester16 ***

MTF RSI ScannerThis RSI scanner can be use to identify the relative strength of 10 symbols over multiple timeframes
it will give you a quick overview which pair is more bearish or more bullish and also signals tops and bottoms in the AVG row
light red/green cell = weak bearish (RSI = 45-35) / bullish (RSI = 55-65)
medium red/green cell = bearish (RSI = 35-25) / bullish (RSI = 65-75)
dark red/green cell = strong bearish (RSI <= 25) / bullish (RSI >= 75)
gray cell = neutral (RSI= 45-55)
Usage
If AVG (average of all 4 timeframes) falls below 30, the cell will get green, indicating a good time to enter long (buy)
If AVG (average of all 4 timeframes) rises above 70, the cell will get red, indicating a good time to enter short (sell)
Use the "MTF RSI Scanner" in combination with the "MTF Stochastic Scanner"
to find tops (RSI MTF avg >=70 AND Stochastic MTF avg >= 80)
or bottoms (RSI MTF avg <= 30 AND Stochastic MTF avg <= 20)
Here is how the two MTF scanners looked on Nov 08 2021 (ATH) »
and here how the MTF scanners looked on June 21 2022
use TradingViews Replay function to check how it would have worked in the past and when not.
As always… there NOT a single indicator that can show to the top & bottom 100% every single time. So use with caution, with other indicators and/or deeper understanding of technicals analysis ☝️☝️☝️
Settings
You can change the timeframes, symbols, RSI settings, overbought/oversold levels and colors to your liking
Drag the table onto the price chart, if you want to use it as an overlay.
NOTE:
Because of the 4x10 security requests, it can take up to 1 minute for changed settings to take effect! Please be patient 🙃
If you have any idea on how to optimise the code, please feel free to share 🙏
*** Inspired by "Binance CHOP Dashboard" from @Cazimiro and "RSI MTF Table" from @mobester16 ***

Indicator of MagoIn this indicator you will find a combination of the indicators used by Mago Gobira. Being them EMA , RSI Levels...

Indicators OverviewThis Indicator help you to see whether the price is above or below vwap, supertrend. Also you can see realtime RSI value.
You can add upto 15 stock of your choice.

Price Alert Indicator with TableIndicator Description: Price Alert Indicator with Table
The Custom Price Alert Indicator with Table is a TradingView script designed to help traders monitor and react to significant price levels during the Asian and London trading sessions. This indicator provides visual alerts and displays relevant session data in a user-friendly table format.
Key Features:
User-Defined Session Times:
Users can specify the start and end hours for both the Asian (default: 8 AM to 2 PM) and London (default: 2 PM to 8 PM) trading sessions in their local time zone.
This flexibility allows traders from different regions to customize the indicator according to their trading hours.
Real-Time Highs and Lows:
The indicator calculates and tracks the high and low prices for the Asian and London sessions in real-time.
It continuously updates these values as new price data comes in.
Touch Notification Logic:
Alerts are triggered when the price touches the session high or low points.
Notifications are designed to avoid repetition; if the London session touches the Asian high or low, subsequent touches are not alerted until the next trading day.
Interactive Table Display:
A table is presented in the bottom right corner of the chart, showing:
The Asian low and high prices
The London low and high prices
Whether each price level has been touched.
Touched levels are visually highlighted in green, making it easy for traders to identify relevant price actions.
Daily Reset of Notifications:
The notification statuses are reset at the end of the London session each day, preparing for the next day’s trading activity.
Use Cases:
Traders can utilize this indicator to stay informed about pivotal price levels during important trading sessions, aiding in decision-making and strategy development.
The clear visual representation of price levels and touch statuses helps traders quickly assess market conditions.
This indicator is particularly beneficial for day traders and those who focus on price movements around key high and low points during the trading day.

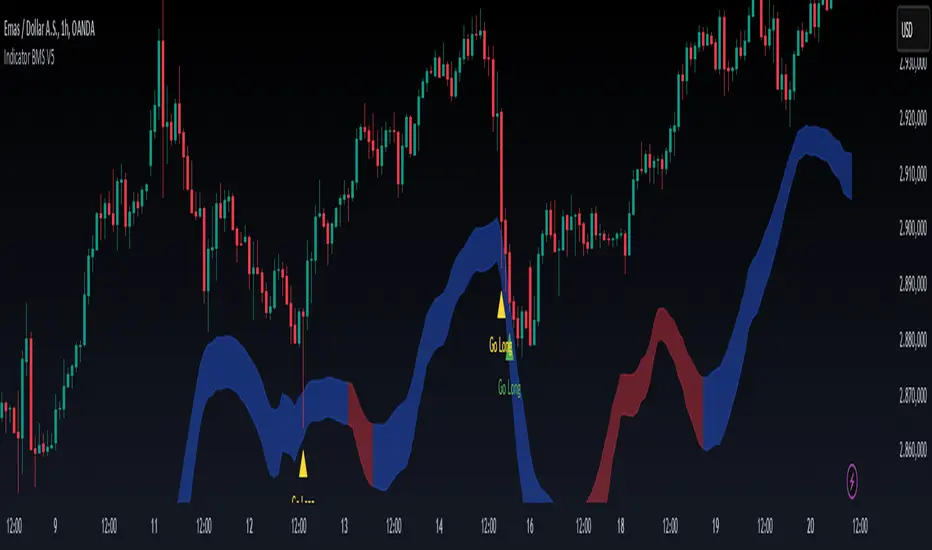
Indicator BMS V5 [Traderhood]Introducing BMS (Base Market Strategy)
Overview
Base Market Strategy (BMS) is a trend-following and oscillator indicator designed to detect market trends with high accuracy while providing clear entry signals. BMS utilizes four Exponential Moving Averages (EMA) to filter trends across multiple timeframes and Bollinger Bands (BB) to identify overbought and oversold zones. This approach makes BMS highly suitable for scalping strategies in lower timeframes with a high win rate potential.
Key Features
📈 Multi-EMA Trend Filtering
Uses 4 EMAs to confirm the dominant trend.
Separates trend detection between lower timeframes and H1 for additional validation.
🎯 Dynamic Overbought & Oversold Detection
Sell signal occurs when the price touches the Bollinger Bands Upper.
Buy signal occurs when the price touches the Bollinger Bands Lower.
🔥 High Win Rate Scalping Strategy
Designed to capture quick price movements in trending markets.
Ideal for traders looking for fast executions with controlled risk.
🎨 Customizable Visual Enhancements
Users can adjust indicator colors to match their personal preferences.
How It Works
1️⃣ EMA-Based Trend Identification
The indicator applies 4 EMAs to determine short-term and medium-term trends.
If the price is above all EMAs → Bullish trend.
If the price is below all EMAs → Bearish trend.
2️⃣ Bollinger Bands Signal Generation
Sell Entry: When the price touches Bollinger Bands Upper, indicating an overbought area.
Buy Entry: When the price touches Bollinger Bands Lower, indicating an oversold area.
3️⃣ Scalping Execution
Entries are executed only on lower timeframes with trend confirmation from H1 EMA.
Profit targets are adjusted based on volatility, while stop loss is placed outside the Bollinger Bands.
4️⃣ Visual Customization
Indicator colors can be modified for better visibility.
Practical Applications
✅ Scalping Strategy – Uses Bollinger Bands and EMA filtering for fast trades.
✅ Trend Confirmation – Multi-timeframe EMA validation ensures precise entries.
✅ Dynamic Support & Resistance – Bollinger Bands help identify potential reversals.
✅ Noise Reduction – EMA filtering removes minor price fluctuations for clearer signals.
🛠 Settings
EMA Periods: 4 EMAs for trend filtering.
Bollinger Bands Length: 20 (default), adjustable.
Bollinger Bands Deviation: 2 (default).
Color Customization: Users can personalize indicator colors as needed.
📌 Conclusion
Base Market Strategy (BMS) is a high win-rate scalping indicator, combining trend-following EMA filtering with momentum reversal detection from Bollinger Bands. With a dynamic and adaptive approach, this indicator provides precise entry signals while reducing noise from insignificant price movements.
Key Takeaways:
✔ High Accuracy – A combination of EMA and Bollinger Bands provides clear signals.
✔ Scalping Optimization – Works best on lower timeframes with H1 validation.
✔ Visual Customization – Users can adjust the indicator colors to their preference.
✔ Simple Yet Powerful – Easy to use but highly effective in capturing market opportunities.
🔹 Disclaimer: Trading carries high risks. Always backtest and optimize settings to align with your risk tolerance before live trading.