Tensor Market Analysis Engine (TMAE)# Tensor Market Analysis Engine (TMAE)
## Advanced Multi-Dimensional Mathematical Analysis System
*Where Quantum Mathematics Meets Market Structure*
---
## 🎓 THEORETICAL FOUNDATION
The Tensor Market Analysis Engine represents a revolutionary synthesis of three cutting-edge mathematical frameworks that have never before been combined for comprehensive market analysis. This indicator transcends traditional technical analysis by implementing advanced mathematical concepts from quantum mechanics, information theory, and fractal geometry.
### 🌊 Multi-Dimensional Volatility with Jump Detection
**Hawkes Process Implementation:**
The TMAE employs a sophisticated Hawkes process approximation for detecting self-exciting market jumps. Unlike traditional volatility measures that treat price movements as independent events, the Hawkes process recognizes that market shocks cluster and exhibit memory effects.
**Mathematical Foundation:**
```
Intensity λ(t) = μ + Σ α(t - Tᵢ)
```
Where market jumps at times Tᵢ increase the probability of future jumps through the decay function α, controlled by the Hawkes Decay parameter (0.5-0.99).
**Mahalanobis Distance Calculation:**
The engine calculates volatility jumps using multi-dimensional Mahalanobis distance across up to 5 volatility dimensions:
- **Dimension 1:** Price volatility (standard deviation of returns)
- **Dimension 2:** Volume volatility (normalized volume fluctuations)
- **Dimension 3:** Range volatility (high-low spread variations)
- **Dimension 4:** Correlation volatility (price-volume relationship changes)
- **Dimension 5:** Microstructure volatility (intrabar positioning analysis)
This creates a volatility state vector that captures market behavior impossible to detect with traditional single-dimensional approaches.
### 📐 Hurst Exponent Regime Detection
**Fractal Market Hypothesis Integration:**
The TMAE implements advanced Rescaled Range (R/S) analysis to calculate the Hurst exponent in real-time, providing dynamic regime classification:
- **H > 0.6:** Trending (persistent) markets - momentum strategies optimal
- **H < 0.4:** Mean-reverting (anti-persistent) markets - contrarian strategies optimal
- **H ≈ 0.5:** Random walk markets - breakout strategies preferred
**Adaptive R/S Analysis:**
Unlike static implementations, the TMAE uses adaptive windowing that adjusts to market conditions:
```
H = log(R/S) / log(n)
```
Where R is the range of cumulative deviations and S is the standard deviation over period n.
**Dynamic Regime Classification:**
The system employs hysteresis to prevent regime flipping, requiring sustained Hurst values before regime changes are confirmed. This prevents false signals during transitional periods.
### 🔄 Transfer Entropy Analysis
**Information Flow Quantification:**
Transfer entropy measures the directional flow of information between price and volume, revealing lead-lag relationships that indicate future price movements:
```
TE(X→Y) = Σ p(yₜ₊₁, yₜ, xₜ) log
```
**Causality Detection:**
- **Volume → Price:** Indicates accumulation/distribution phases
- **Price → Volume:** Suggests retail participation or momentum chasing
- **Balanced Flow:** Market equilibrium or transition periods
The system analyzes multiple lag periods (2-20 bars) to capture both immediate and structural information flows.
---
## 🔧 COMPREHENSIVE INPUT SYSTEM
### Core Parameters Group
**Primary Analysis Window (10-100, Default: 50)**
The fundamental lookback period affecting all calculations. Optimization by timeframe:
- **1-5 minute charts:** 20-30 (rapid adaptation to micro-movements)
- **15 minute-1 hour:** 30-50 (balanced responsiveness and stability)
- **4 hour-daily:** 50-100 (smooth signals, reduced noise)
- **Asset-specific:** Cryptocurrency 20-35, Stocks 35-50, Forex 40-60
**Signal Sensitivity (0.1-2.0, Default: 0.7)**
Master control affecting all threshold calculations:
- **Conservative (0.3-0.6):** High-quality signals only, fewer false positives
- **Balanced (0.7-1.0):** Optimal risk-reward ratio for most trading styles
- **Aggressive (1.1-2.0):** Maximum signal frequency, requires careful filtering
**Signal Generation Mode:**
- **Aggressive:** Any component signals (highest frequency)
- **Confluence:** 2+ components agree (balanced approach)
- **Conservative:** All 3 components align (highest quality)
### Volatility Jump Detection Group
**Volatility Dimensions (2-5, Default: 3)**
Determines the mathematical space complexity:
- **2D:** Price + Volume volatility (suitable for clean markets)
- **3D:** + Range volatility (optimal for most conditions)
- **4D:** + Correlation volatility (advanced multi-asset analysis)
- **5D:** + Microstructure volatility (maximum sensitivity)
**Jump Detection Threshold (1.5-4.0σ, Default: 3.0σ)**
Standard deviations required for volatility jump classification:
- **Cryptocurrency:** 2.0-2.5σ (naturally volatile)
- **Stock Indices:** 2.5-3.0σ (moderate volatility)
- **Forex Major Pairs:** 3.0-3.5σ (typically stable)
- **Commodities:** 2.0-3.0σ (varies by commodity)
**Jump Clustering Decay (0.5-0.99, Default: 0.85)**
Hawkes process memory parameter:
- **0.5-0.7:** Fast decay (jumps treated as independent)
- **0.8-0.9:** Moderate clustering (realistic market behavior)
- **0.95-0.99:** Strong clustering (crisis/event-driven markets)
### Hurst Exponent Analysis Group
**Calculation Method Options:**
- **Classic R/S:** Original Rescaled Range (fast, simple)
- **Adaptive R/S:** Dynamic windowing (recommended for trading)
- **DFA:** Detrended Fluctuation Analysis (best for noisy data)
**Trending Threshold (0.55-0.8, Default: 0.60)**
Hurst value defining persistent market behavior:
- **0.55-0.60:** Weak trend persistence
- **0.65-0.70:** Clear trending behavior
- **0.75-0.80:** Strong momentum regimes
**Mean Reversion Threshold (0.2-0.45, Default: 0.40)**
Hurst value defining anti-persistent behavior:
- **0.35-0.45:** Weak mean reversion
- **0.25-0.35:** Clear ranging behavior
- **0.15-0.25:** Strong reversion tendency
### Transfer Entropy Parameters Group
**Information Flow Analysis:**
- **Price-Volume:** Classic flow analysis for accumulation/distribution
- **Price-Volatility:** Risk flow analysis for sentiment shifts
- **Multi-Timeframe:** Cross-timeframe causality detection
**Maximum Lag (2-20, Default: 5)**
Causality detection window:
- **2-5 bars:** Immediate causality (scalping)
- **5-10 bars:** Short-term flow (day trading)
- **10-20 bars:** Structural flow (swing trading)
**Significance Threshold (0.05-0.3, Default: 0.15)**
Minimum entropy for signal generation:
- **0.05-0.10:** Detect subtle information flows
- **0.10-0.20:** Clear causality only
- **0.20-0.30:** Very strong flows only
---
## 🎨 ADVANCED VISUAL SYSTEM
### Tensor Volatility Field Visualization
**Five-Layer Resonance Bands:**
The tensor field creates dynamic support/resistance zones that expand and contract based on mathematical field strength:
- **Core Layer (Purple):** Primary tensor field with highest intensity
- **Layer 2 (Neutral):** Secondary mathematical resonance
- **Layer 3 (Info Blue):** Tertiary harmonic frequencies
- **Layer 4 (Warning Gold):** Outer field boundaries
- **Layer 5 (Success Green):** Maximum field extension
**Field Strength Calculation:**
```
Field Strength = min(3.0, Mahalanobis Distance × Tensor Intensity)
```
The field amplitude adjusts to ATR and mathematical distance, creating dynamic zones that respond to market volatility.
**Radiation Line Network:**
During active tensor states, the system projects directional radiation lines showing field energy distribution:
- **8 Directional Rays:** Complete angular coverage
- **Tapering Segments:** Progressive transparency for natural visual flow
- **Pulse Effects:** Enhanced visualization during volatility jumps
### Dimensional Portal System
**Portal Mathematics:**
Dimensional portals visualize regime transitions using category theory principles:
- **Green Portals (◉):** Trending regime detection (appear below price for support)
- **Red Portals (◎):** Mean-reverting regime (appear above price for resistance)
- **Yellow Portals (○):** Random walk regime (neutral positioning)
**Tensor Trail Effects:**
Each portal generates 8 trailing particles showing mathematical momentum:
- **Large Particles (●):** Strong mathematical signal
- **Medium Particles (◦):** Moderate signal strength
- **Small Particles (·):** Weak signal continuation
- **Micro Particles (˙):** Signal dissipation
### Information Flow Streams
**Particle Stream Visualization:**
Transfer entropy creates flowing particle streams indicating information direction:
- **Upward Streams:** Volume leading price (accumulation phases)
- **Downward Streams:** Price leading volume (distribution phases)
- **Stream Density:** Proportional to information flow strength
**15-Particle Evolution:**
Each stream contains 15 particles with progressive sizing and transparency, creating natural flow visualization that makes information transfer immediately apparent.
### Fractal Matrix Grid System
**Multi-Timeframe Fractal Levels:**
The system calculates and displays fractal highs/lows across five Fibonacci periods:
- **8-Period:** Short-term fractal structure
- **13-Period:** Intermediate-term patterns
- **21-Period:** Primary swing levels
- **34-Period:** Major structural levels
- **55-Period:** Long-term fractal boundaries
**Triple-Layer Visualization:**
Each fractal level uses three-layer rendering:
- **Shadow Layer:** Widest, darkest foundation (width 5)
- **Glow Layer:** Medium white core line (width 3)
- **Tensor Layer:** Dotted mathematical overlay (width 1)
**Intelligent Labeling System:**
Smart spacing prevents label overlap using ATR-based minimum distances. Labels include:
- **Fractal Period:** Time-based identification
- **Topological Class:** Mathematical complexity rating (0, I, II, III)
- **Price Level:** Exact fractal price
- **Mahalanobis Distance:** Current mathematical field strength
- **Hurst Exponent:** Current regime classification
- **Anomaly Indicators:** Visual strength representations (○ ◐ ● ⚡)
### Wick Pressure Analysis
**Rejection Level Mathematics:**
The system analyzes candle wick patterns to project future pressure zones:
- **Upper Wick Analysis:** Identifies selling pressure and resistance zones
- **Lower Wick Analysis:** Identifies buying pressure and support zones
- **Pressure Projection:** Extends lines forward based on mathematical probability
**Multi-Layer Glow Effects:**
Wick pressure lines use progressive transparency (1-8 layers) creating natural glow effects that make pressure zones immediately visible without cluttering the chart.
### Enhanced Regime Background
**Dynamic Intensity Mapping:**
Background colors reflect mathematical regime strength:
- **Deep Transparency (98% alpha):** Subtle regime indication
- **Pulse Intensity:** Based on regime strength calculation
- **Color Coding:** Green (trending), Red (mean-reverting), Neutral (random)
**Smoothing Integration:**
Regime changes incorporate 10-bar smoothing to prevent background flicker while maintaining responsiveness to genuine regime shifts.
### Color Scheme System
**Six Professional Themes:**
- **Dark (Default):** Professional trading environment optimization
- **Light:** High ambient light conditions
- **Classic:** Traditional technical analysis appearance
- **Neon:** High-contrast visibility for active trading
- **Neutral:** Minimal distraction focus
- **Bright:** Maximum visibility for complex setups
Each theme maintains mathematical accuracy while optimizing visual clarity for different trading environments and personal preferences.
---
## 📊 INSTITUTIONAL-GRADE DASHBOARD
### Tensor Field Status Section
**Field Strength Display:**
Real-time Mahalanobis distance calculation with dynamic emoji indicators:
- **⚡ (Lightning):** Extreme field strength (>1.5× threshold)
- **● (Solid Circle):** Strong field activity (>1.0× threshold)
- **○ (Open Circle):** Normal field state
**Signal Quality Rating:**
Democratic algorithm assessment:
- **ELITE:** All 3 components aligned (highest probability)
- **STRONG:** 2 components aligned (good probability)
- **GOOD:** 1 component active (moderate probability)
- **WEAK:** No clear component signals
**Threshold and Anomaly Monitoring:**
- **Threshold Display:** Current mathematical threshold setting
- **Anomaly Level (0-100%):** Combined volatility and volume spike measurement
- **>70%:** High anomaly (red warning)
- **30-70%:** Moderate anomaly (orange caution)
- **<30%:** Normal conditions (green confirmation)
### Tensor State Analysis Section
**Mathematical State Classification:**
- **↑ BULL (Tensor State +1):** Trending regime with bullish bias
- **↓ BEAR (Tensor State -1):** Mean-reverting regime with bearish bias
- **◈ SUPER (Tensor State 0):** Random walk regime (neutral)
**Visual State Gauge:**
Five-circle progression showing tensor field polarity:
- **🟢🟢🟢⚪⚪:** Strong bullish mathematical alignment
- **⚪⚪🟡⚪⚪:** Neutral/transitional state
- **⚪⚪🔴🔴🔴:** Strong bearish mathematical alignment
**Trend Direction and Phase Analysis:**
- **📈 BULL / 📉 BEAR / ➡️ NEUTRAL:** Primary trend classification
- **🌪️ CHAOS:** Extreme information flow (>2.0 flow strength)
- **⚡ ACTIVE:** Strong information flow (1.0-2.0 flow strength)
- **😴 CALM:** Low information flow (<1.0 flow strength)
### Trading Signals Section
**Real-Time Signal Status:**
- **🟢 ACTIVE / ⚪ INACTIVE:** Long signal availability
- **🔴 ACTIVE / ⚪ INACTIVE:** Short signal availability
- **Components (X/3):** Active algorithmic components
- **Mode Display:** Current signal generation mode
**Signal Strength Visualization:**
Color-coded component count:
- **Green:** 3/3 components (maximum confidence)
- **Aqua:** 2/3 components (good confidence)
- **Orange:** 1/3 components (moderate confidence)
- **Gray:** 0/3 components (no signals)
### Performance Metrics Section
**Win Rate Monitoring:**
Estimated win rates based on signal quality with emoji indicators:
- **🔥 (Fire):** ≥60% estimated win rate
- **👍 (Thumbs Up):** 45-59% estimated win rate
- **⚠️ (Warning):** <45% estimated win rate
**Mathematical Metrics:**
- **Hurst Exponent:** Real-time fractal dimension (0.000-1.000)
- **Information Flow:** Volume/price leading indicators
- **📊 VOL:** Volume leading price (accumulation/distribution)
- **💰 PRICE:** Price leading volume (momentum/speculation)
- **➖ NONE:** Balanced information flow
- **Volatility Classification:**
- **🔥 HIGH:** Above 1.5× jump threshold
- **📊 NORM:** Normal volatility range
- **😴 LOW:** Below 0.5× jump threshold
### Market Structure Section (Large Dashboard)
**Regime Classification:**
- **📈 TREND:** Hurst >0.6, momentum strategies optimal
- **🔄 REVERT:** Hurst <0.4, contrarian strategies optimal
- **🎲 RANDOM:** Hurst ≈0.5, breakout strategies preferred
**Mathematical Field Analysis:**
- **Dimensions:** Current volatility space complexity (2D-5D)
- **Hawkes λ (Lambda):** Self-exciting jump intensity (0.00-1.00)
- **Jump Status:** 🚨 JUMP (active) / ✅ NORM (normal)
### Settings Summary Section (Large Dashboard)
**Active Configuration Display:**
- **Sensitivity:** Current master sensitivity setting
- **Lookback:** Primary analysis window
- **Theme:** Active color scheme
- **Method:** Hurst calculation method (Classic R/S, Adaptive R/S, DFA)
**Dashboard Sizing Options:**
- **Small:** Essential metrics only (mobile/small screens)
- **Normal:** Balanced information density (standard desktop)
- **Large:** Maximum detail (multi-monitor setups)
**Position Options:**
- **Top Right:** Standard placement (avoids price action)
- **Top Left:** Wide chart optimization
- **Bottom Right:** Recent price focus (scalping)
- **Bottom Left:** Maximum price visibility (swing trading)
---
## 🎯 SIGNAL GENERATION LOGIC
### Multi-Component Convergence System
**Component Signal Architecture:**
The TMAE generates signals through sophisticated component analysis rather than simple threshold crossing:
**Volatility Component:**
- **Jump Detection:** Mahalanobis distance threshold breach
- **Hawkes Intensity:** Self-exciting process activation (>0.2)
- **Multi-dimensional:** Considers all volatility dimensions simultaneously
**Hurst Regime Component:**
- **Trending Markets:** Price above SMA-20 with positive momentum
- **Mean-Reverting Markets:** Price at Bollinger Band extremes
- **Random Markets:** Bollinger squeeze breakouts with directional confirmation
**Transfer Entropy Component:**
- **Volume Leadership:** Information flow from volume to price
- **Volume Spike:** Volume 110%+ above 20-period average
- **Flow Significance:** Above entropy threshold with directional bias
### Democratic Signal Weighting
**Signal Mode Implementation:**
- **Aggressive Mode:** Any single component triggers signal
- **Confluence Mode:** Minimum 2 components must agree
- **Conservative Mode:** All 3 components must align
**Momentum Confirmation:**
All signals require momentum confirmation:
- **Long Signals:** RSI >50 AND price >EMA-9
- **Short Signals:** RSI <50 AND price 0.6):**
- **Increase Sensitivity:** Catch momentum continuation
- **Lower Mean Reversion Threshold:** Avoid counter-trend signals
- **Emphasize Volume Leadership:** Institutional accumulation/distribution
- **Tensor Field Focus:** Use expansion for trend continuation
- **Signal Mode:** Aggressive or Confluence for trend following
**Range-Bound Markets (Hurst <0.4):**
- **Decrease Sensitivity:** Avoid false breakouts
- **Lower Trending Threshold:** Quick regime recognition
- **Focus on Price Leadership:** Retail sentiment extremes
- **Fractal Grid Emphasis:** Support/resistance trading
- **Signal Mode:** Conservative for high-probability reversals
**Volatile Markets (High Jump Frequency):**
- **Increase Hawkes Decay:** Recognize event clustering
- **Higher Jump Threshold:** Avoid noise signals
- **Maximum Dimensions:** Capture full volatility complexity
- **Reduce Position Sizing:** Risk management adaptation
- **Enhanced Visuals:** Maximum information for rapid decisions
**Low Volatility Markets (Low Jump Frequency):**
- **Decrease Jump Threshold:** Capture subtle movements
- **Lower Hawkes Decay:** Treat moves as independent
- **Reduce Dimensions:** Simplify analysis
- **Increase Position Sizing:** Capitalize on compressed volatility
- **Minimal Visuals:** Reduce distraction in quiet markets
---
## 🚀 ADVANCED TRADING STRATEGIES
### The Mathematical Convergence Method
**Entry Protocol:**
1. **Fractal Grid Approach:** Monitor price approaching significant fractal levels
2. **Tensor Field Confirmation:** Verify field expansion supporting direction
3. **Portal Signal:** Wait for dimensional portal appearance
4. **ELITE/STRONG Quality:** Only trade highest quality mathematical signals
5. **Component Consensus:** Confirm 2+ components agree in Confluence mode
**Example Implementation:**
- Price approaching 21-period fractal high
- Tensor field expanding upward (bullish mathematical alignment)
- Green portal appears below price (trending regime confirmation)
- ELITE quality signal with 3/3 components active
- Enter long position with stop below fractal level
**Risk Management:**
- **Stop Placement:** Below/above fractal level that generated signal
- **Position Sizing:** Based on Mahalanobis distance (higher distance = smaller size)
- **Profit Targets:** Next fractal level or tensor field resistance
### The Regime Transition Strategy
**Regime Change Detection:**
1. **Monitor Hurst Exponent:** Watch for persistent moves above/below thresholds
2. **Portal Color Change:** Regime transitions show different portal colors
3. **Background Intensity:** Increasing regime background intensity
4. **Mathematical Confirmation:** Wait for regime confirmation (hysteresis)
**Trading Implementation:**
- **Trending Transitions:** Trade momentum breakouts, follow trend
- **Mean Reversion Transitions:** Trade range boundaries, fade extremes
- **Random Transitions:** Trade breakouts with tight stops
**Advanced Techniques:**
- **Multi-Timeframe:** Confirm regime on higher timeframe
- **Early Entry:** Enter on regime transition rather than confirmation
- **Regime Strength:** Larger positions during strong regime signals
### The Information Flow Momentum Strategy
**Flow Detection Protocol:**
1. **Monitor Transfer Entropy:** Watch for significant information flow shifts
2. **Volume Leadership:** Strong edge when volume leads price
3. **Flow Acceleration:** Increasing flow strength indicates momentum
4. **Directional Confirmation:** Ensure flow aligns with intended trade direction
**Entry Signals:**
- **Volume → Price Flow:** Enter during accumulation/distribution phases
- **Price → Volume Flow:** Enter on momentum confirmation breaks
- **Flow Reversal:** Counter-trend entries when flow reverses
**Optimization:**
- **Scalping:** Use immediate flow detection (2-5 bar lag)
- **Swing Trading:** Use structural flow (10-20 bar lag)
- **Multi-Asset:** Compare flow between correlated assets
### The Tensor Field Expansion Strategy
**Field Mathematics:**
The tensor field expansion indicates mathematical pressure building in market structure:
**Expansion Phases:**
1. **Compression:** Field contracts, volatility decreases
2. **Tension Building:** Mathematical pressure accumulates
3. **Expansion:** Field expands rapidly with directional movement
4. **Resolution:** Field stabilizes at new equilibrium
**Trading Applications:**
- **Compression Trading:** Prepare for breakout during field contraction
- **Expansion Following:** Trade direction of field expansion
- **Reversion Trading:** Fade extreme field expansion
- **Multi-Dimensional:** Consider all field layers for confirmation
### The Hawkes Process Event Strategy
**Self-Exciting Jump Trading:**
Understanding that market shocks cluster and create follow-on opportunities:
**Jump Sequence Analysis:**
1. **Initial Jump:** First volatility jump detected
2. **Clustering Phase:** Hawkes intensity remains elevated
3. **Follow-On Opportunities:** Additional jumps more likely
4. **Decay Period:** Intensity gradually decreases
**Implementation:**
- **Jump Confirmation:** Wait for mathematical jump confirmation
- **Direction Assessment:** Use other components for direction
- **Clustering Trades:** Trade subsequent moves during high intensity
- **Decay Exit:** Exit positions as Hawkes intensity decays
### The Fractal Confluence System
**Multi-Timeframe Fractal Analysis:**
Combining fractal levels across different periods for high-probability zones:
**Confluence Zones:**
- **Double Confluence:** 2 fractal levels align
- **Triple Confluence:** 3+ fractal levels cluster
- **Mathematical Confirmation:** Tensor field supports the level
- **Information Flow:** Transfer entropy confirms direction
**Trading Protocol:**
1. **Identify Confluence:** Find 2+ fractal levels within 1 ATR
2. **Mathematical Support:** Verify tensor field alignment
3. **Signal Quality:** Wait for STRONG or ELITE signal
4. **Risk Definition:** Use fractal level for stop placement
5. **Profit Targeting:** Next major fractal confluence zone
---
## ⚠️ COMPREHENSIVE RISK MANAGEMENT
### Mathematical Position Sizing
**Mahalanobis Distance Integration:**
Position size should inversely correlate with mathematical field strength:
```
Position Size = Base Size × (Threshold / Mahalanobis Distance)
```
**Risk Scaling Matrix:**
- **Low Field Strength (<2.0):** Standard position sizing
- **Moderate Field Strength (2.0-3.0):** 75% position sizing
- **High Field Strength (3.0-4.0):** 50% position sizing
- **Extreme Field Strength (>4.0):** 25% position sizing or no trade
### Signal Quality Risk Adjustment
**Quality-Based Position Sizing:**
- **ELITE Signals:** 100% of planned position size
- **STRONG Signals:** 75% of planned position size
- **GOOD Signals:** 50% of planned position size
- **WEAK Signals:** No position or paper trading only
**Component Agreement Scaling:**
- **3/3 Components:** Full position size
- **2/3 Components:** 75% position size
- **1/3 Components:** 50% position size or skip trade
### Regime-Adaptive Risk Management
**Trending Market Risk:**
- **Wider Stops:** Allow for trend continuation
- **Trend Following:** Trade with regime direction
- **Higher Position Size:** Trend probability advantage
- **Momentum Stops:** Trail stops based on momentum indicators
**Mean-Reverting Market Risk:**
- **Tighter Stops:** Quick exits on trend continuation
- **Contrarian Positioning:** Trade against extremes
- **Smaller Position Size:** Higher reversal failure rate
- **Level-Based Stops:** Use fractal levels for stops
**Random Market Risk:**
- **Breakout Focus:** Trade only clear breakouts
- **Tight Initial Stops:** Quick exit if breakout fails
- **Reduced Frequency:** Skip marginal setups
- **Range-Based Targets:** Profit targets at range boundaries
### Volatility-Adaptive Risk Controls
**High Volatility Periods:**
- **Reduced Position Size:** Account for wider price swings
- **Wider Stops:** Avoid noise-based exits
- **Lower Frequency:** Skip marginal setups
- **Faster Exits:** Take profits more quickly
**Low Volatility Periods:**
- **Standard Position Size:** Normal risk parameters
- **Tighter Stops:** Take advantage of compressed ranges
- **Higher Frequency:** Trade more setups
- **Extended Targets:** Allow for compressed volatility expansion
### Multi-Timeframe Risk Alignment
**Higher Timeframe Trend:**
- **With Trend:** Standard or increased position size
- **Against Trend:** Reduced position size or skip
- **Neutral Trend:** Standard position size with tight management
**Risk Hierarchy:**
1. **Primary:** Current timeframe signal quality
2. **Secondary:** Higher timeframe trend alignment
3. **Tertiary:** Mathematical field strength
4. **Quaternary:** Market regime classification
---
## 📚 EDUCATIONAL VALUE AND MATHEMATICAL CONCEPTS
### Advanced Mathematical Concepts
**Tensor Analysis in Markets:**
The TMAE introduces traders to tensor analysis, a branch of mathematics typically reserved for physics and advanced engineering. Tensors provide a framework for understanding multi-dimensional market relationships that scalar and vector analysis cannot capture.
**Information Theory Applications:**
Transfer entropy implementation teaches traders about information flow in markets, a concept from information theory that quantifies directional causality between variables. This provides intuition about market microstructure and participant behavior.
**Fractal Geometry in Trading:**
The Hurst exponent calculation exposes traders to fractal geometry concepts, helping understand that markets exhibit self-similar patterns across multiple timeframes. This mathematical insight transforms how traders view market structure.
**Stochastic Process Theory:**
The Hawkes process implementation introduces concepts from stochastic process theory, specifically self-exciting point processes. This provides mathematical framework for understanding why market events cluster and exhibit memory effects.
### Learning Progressive Complexity
**Beginner Mathematical Concepts:**
- **Volatility Dimensions:** Understanding multi-dimensional analysis
- **Regime Classification:** Learning market personality types
- **Signal Democracy:** Algorithmic consensus building
- **Visual Mathematics:** Interpreting mathematical concepts visually
**Intermediate Mathematical Applications:**
- **Mahalanobis Distance:** Statistical distance in multi-dimensional space
- **Rescaled Range Analysis:** Fractal dimension measurement
- **Information Entropy:** Quantifying uncertainty and causality
- **Field Theory:** Understanding mathematical fields in market context
**Advanced Mathematical Integration:**
- **Tensor Field Dynamics:** Multi-dimensional market force analysis
- **Stochastic Self-Excitation:** Event clustering and memory effects
- **Categorical Composition:** Mathematical signal combination theory
- **Topological Market Analysis:** Understanding market shape and connectivity
### Practical Mathematical Intuition
**Developing Market Mathematics Intuition:**
The TMAE serves as a bridge between abstract mathematical concepts and practical trading applications. Traders develop intuitive understanding of:
- **How markets exhibit mathematical structure beneath apparent randomness**
- **Why multi-dimensional analysis reveals patterns invisible to single-variable approaches**
- **How information flows through markets in measurable, predictable ways**
- **Why mathematical models provide probabilistic edges rather than certainties**
---
## 🔬 IMPLEMENTATION AND OPTIMIZATION
### Getting Started Protocol
**Phase 1: Observation (Week 1)**
1. **Apply with defaults:** Use standard settings on your primary trading timeframe
2. **Study visual elements:** Learn to interpret tensor fields, portals, and streams
3. **Monitor dashboard:** Observe how metrics change with market conditions
4. **No trading:** Focus entirely on pattern recognition and understanding
**Phase 2: Pattern Recognition (Week 2-3)**
1. **Identify signal patterns:** Note what market conditions produce different signal qualities
2. **Regime correlation:** Observe how Hurst regimes affect signal performance
3. **Visual confirmation:** Learn to read tensor field expansion and portal signals
4. **Component analysis:** Understand which components drive signals in different markets
**Phase 3: Parameter Optimization (Week 4-5)**
1. **Asset-specific tuning:** Adjust parameters for your specific trading instrument
2. **Timeframe optimization:** Fine-tune for your preferred trading timeframe
3. **Sensitivity adjustment:** Balance signal frequency with quality
4. **Visual customization:** Optimize colors and intensity for your trading environment
**Phase 4: Live Implementation (Week 6+)**
1. **Paper trading:** Test signals with hypothetical trades
2. **Small position sizing:** Begin with minimal risk during learning phase
3. **Performance tracking:** Monitor actual vs. expected signal performance
4. **Continuous optimization:** Refine settings based on real performance data
### Performance Monitoring System
**Signal Quality Tracking:**
- **ELITE Signal Win Rate:** Track highest quality signals separately
- **Component Performance:** Monitor which components provide best signals
- **Regime Performance:** Analyze performance across different market regimes
- **Timeframe Analysis:** Compare performance across different session times
**Mathematical Metric Correlation:**
- **Field Strength vs. Performance:** Higher field strength should correlate with better performance
- **Component Agreement vs. Win Rate:** More component agreement should improve win rates
- **Regime Alignment vs. Success:** Trading with mathematical regime should outperform
### Continuous Optimization Process
**Monthly Review Protocol:**
1. **Performance Analysis:** Review win rates, profit factors, and maximum drawdown
2. **Parameter Assessment:** Evaluate if current settings remain optimal
3. **Market Adaptation:** Adjust for changes in market character or volatility
4. **Component Weighting:** Consider if certain components should receive more/less emphasis
**Quarterly Deep Analysis:**
1. **Mathematical Model Validation:** Verify that mathematical relationships remain valid
2. **Regime Distribution:** Analyze time spent in different market regimes
3. **Signal Evolution:** Track how signal characteristics change over time
4. **Correlation Analysis:** Monitor correlations between different mathematical components
---
## 🌟 UNIQUE INNOVATIONS AND CONTRIBUTIONS
### Revolutionary Mathematical Integration
**First-Ever Implementations:**
1. **Multi-Dimensional Volatility Tensor:** First indicator to implement true tensor analysis for market volatility
2. **Real-Time Hawkes Process:** First trading implementation of self-exciting point processes
3. **Transfer Entropy Trading Signals:** First practical application of information theory for trade generation
4. **Democratic Component Voting:** First algorithmic consensus system for signal generation
5. **Fractal-Projected Signal Quality:** First system to predict signal quality at future price levels
### Advanced Visualization Innovations
**Mathematical Visualization Breakthroughs:**
- **Tensor Field Radiation:** Visual representation of mathematical field energy
- **Dimensional Portal System:** Category theory visualization for regime transitions
- **Information Flow Streams:** Real-time visual display of market information transfer
- **Multi-Layer Fractal Grid:** Intelligent spacing and projection system
- **Regime Intensity Mapping:** Dynamic background showing mathematical regime strength
### Practical Trading Innovations
**Trading System Advances:**
- **Quality-Weighted Signal Generation:** Signals rated by mathematical confidence
- **Regime-Adaptive Strategy Selection:** Automatic strategy optimization based on market personality
- **Anti-Spam Signal Protection:** Mathematical prevention of signal clustering
- **Component Performance Tracking:** Real-time monitoring of algorithmic component success
- **Field-Strength Position Sizing:** Mathematical volatility integration for risk management
---
## ⚖️ RESPONSIBLE USAGE AND LIMITATIONS
### Mathematical Model Limitations
**Understanding Model Boundaries:**
While the TMAE implements sophisticated mathematical concepts, traders must understand fundamental limitations:
- **Markets Are Not Purely Mathematical:** Human psychology, news events, and fundamental factors create unpredictable elements
- **Past Performance Limitations:** Mathematical relationships that worked historically may not persist indefinitely
- **Model Risk:** Complex models can fail during unprecedented market conditions
- **Overfitting Potential:** Highly optimized parameters may not generalize to future market conditions
### Proper Implementation Guidelines
**Risk Management Requirements:**
- **Never Risk More Than 2% Per Trade:** Regardless of signal quality
- **Diversification Mandatory:** Don't rely solely on mathematical signals
- **Position Sizing Discipline:** Use mathematical field strength for sizing, not confidence
- **Stop Loss Non-Negotiable:** Every trade must have predefined risk parameters
**Realistic Expectations:**
- **Mathematical Edge, Not Certainty:** The indicator provides probabilistic advantages, not guaranteed outcomes
- **Learning Curve Required:** Complex mathematical concepts require time to master
- **Market Adaptation Necessary:** Parameters must evolve with changing market conditions
- **Continuous Education Important:** Understanding underlying mathematics improves application
### Ethical Trading Considerations
**Market Impact Awareness:**
- **Information Asymmetry:** Advanced mathematical analysis may provide advantages over other market participants
- **Position Size Responsibility:** Large positions based on mathematical signals can impact market structure
- **Sharing Knowledge:** Consider educational contributions to trading community
- **Fair Market Participation:** Use mathematical advantages responsibly within market framework
### Professional Development Path
**Skill Development Sequence:**
1. **Basic Mathematical Literacy:** Understand fundamental concepts before advanced application
2. **Risk Management Mastery:** Develop disciplined risk control before relying on complex signals
3. **Market Psychology Understanding:** Combine mathematical analysis with behavioral market insights
4. **Continuous Learning:** Stay updated on mathematical finance developments and market evolution
---
## 🔮 CONCLUSION
The Tensor Market Analysis Engine represents a quantum leap forward in technical analysis, successfully bridging the gap between advanced pure mathematics and practical trading applications. By integrating multi-dimensional volatility analysis, fractal market theory, and information flow dynamics, the TMAE reveals market structure invisible to conventional analysis while maintaining visual clarity and practical usability.
### Mathematical Innovation Legacy
This indicator establishes new paradigms in technical analysis:
- **Tensor analysis for market volatility understanding**
- **Stochastic self-excitation for event clustering prediction**
- **Information theory for causality-based trade generation**
- **Democratic algorithmic consensus for signal quality enhancement**
- **Mathematical field visualization for intuitive market understanding**
### Practical Trading Revolution
Beyond mathematical innovation, the TMAE transforms practical trading:
- **Quality-rated signals replace binary buy/sell decisions**
- **Regime-adaptive strategies automatically optimize for market personality**
- **Multi-dimensional risk management integrates mathematical volatility measures**
- **Visual mathematical concepts make complex analysis immediately interpretable**
- **Educational value creates lasting improvement in trading understanding**
### Future-Proof Design
The mathematical foundations ensure lasting relevance:
- **Universal mathematical principles transcend market evolution**
- **Multi-dimensional analysis adapts to new market structures**
- **Regime detection automatically adjusts to changing market personalities**
- **Component democracy allows for future algorithmic additions**
- **Mathematical visualization scales with increasing market complexity**
### Commitment to Excellence
The TMAE represents more than an indicator—it embodies a philosophy of bringing rigorous mathematical analysis to trading while maintaining practical utility and visual elegance. Every component, from the multi-dimensional tensor fields to the democratic signal generation, reflects a commitment to mathematical accuracy, trading practicality, and educational value.
### Trading with Mathematical Precision
In an era where markets grow increasingly complex and computational, the TMAE provides traders with mathematical tools previously available only to institutional quantitative research teams. Yet unlike academic mathematical models, the TMAE translates complex concepts into intuitive visual representations and practical trading signals.
By combining the mathematical rigor of tensor analysis, the statistical power of multi-dimensional volatility modeling, and the information-theoretic insights of transfer entropy, traders gain unprecedented insight into market structure and dynamics.
### Final Perspective
Markets, like nature, exhibit profound mathematical beauty beneath apparent chaos. The Tensor Market Analysis Engine serves as a mathematical lens that reveals this hidden order, transforming how traders perceive and interact with market structure.
Through mathematical precision, visual elegance, and practical utility, the TMAE empowers traders to see beyond the noise and trade with the confidence that comes from understanding the mathematical principles governing market behavior.
Trade with mathematical insight. Trade with the power of tensors. Trade with the TMAE.
*"In mathematics, you don't understand things. You just get used to them." - John von Neumann*
*With the TMAE, mathematical market understanding becomes not just possible, but intuitive.*
— Dskyz, Trade with insight. Trade with anticipation.
Cari dalam skrip untuk "indicators"

Trend Momentum Strength Indicator, Built for Pairs TradingOverview:
This script combines multiple indicators to provide a comprehensive analysis of both trend strength and trend momentum. It is tailored specifically for pairs trading strategies but can also be used for other trading strategies.
Benefit of Comprehensive Analysis:
Having an indicator that evaluates both trend strength and trend momentum is crucial for traders looking to make informed decisions. It allows traders to not only identify the direction and intensity of a trend but also gauge the momentum behind it. This dual capability helps in confirming potential trade opportunities, whether for entering trades with strong trends or considering reversals during overbought or oversold conditions. By integrating both aspects into one tool, traders can gain a holistic view of market dynamics, enhancing their ability to time entries and manage risk effectively.
Features:
* Trend Strength:
Enhanced ADX Formula: The script includes modifications to the standard ADX formula along with DI+ and DI- to provide more responsive trend strength readings.
Directional Indicators: DI+ (green line) indicates positive directional movement, while DI- (red line) indicates negative directional movement.
Trend Momentum:
Modified Stochastic Indicators: The script uses %K and %D indicators, modified and combined with ADX to give a clear indication of trend momentum.
Momentum Strength: This helps determine the strength and direction of the momentum.
Trading Signals:
Combining Indicators: The script combines ADX, DI+, DI-, %K, and %D to generate comprehensive trading signals.
Optimal Entry Points: Designed to identify optimal entry points for trades, particularly in pairs trading.
Colored Area at Bottom:
This area provides two easy-to-read functions:
Color:
Green: Upward momentum (ratio above 1)
Red: Downward momentum (ratio below 1)
Height:
Higher in green: Stronger upward momentum
Lower in red: Stronger downward momentum
Legend:
Green Line: DI+ (Positive)
Red Line: DI- (Negative)
Black Line: ADX
How to Read This Indicator:
1) Trend Direction:
DI+ above DI-: Indicates an upward trend.
DI- above DI+: Indicates a downward trend.
2) Trend Strength:
ADX below 20: Indicates a neutral trend.
ADX between 20 and 25: Indicates a weak trend.
ADX above 25: Indicates a strong trend.
Trading Signals in Pairs Trading:
Neutral Trend: Ideal for pairs trading when no strong trend is detected.
Overbought/Oversold: Uses %K and %D to identify overbought/oversold conditions that support trade decisions.
Entry Signals: Green signals for long positions, red signals for short positions, based on combined criteria of neutral trend strength and supportive momentum.
Application in Pairs Trading:
Neutral trend: In pairs trading strategies, where neutral movement is often sought, this indicator provides signals that are especially relevant during periods of neutral trend strength and supportive momentum, aiding traders in identifying optimal entry
Risk Management: Combining signals from ADX, DI+, DI-, %K, and %D helps traders make more informed decisions regarding entry points, enhancing risk management.
Example Chart (The indicator is on the upper right corner):
Clean Presentation: The chart only includes the necessary elements to demonstrate the indicator’s functionality.
Demonstrates: Overbought/oversold conditions, upward/downward/no momentum, and trading signals with/without specific scenarios.

Trade Manager (Open-Source & Non-Standalone Version)Happy Friday everyone
TGIF !!!!!! The weekend for me means no script publishing and enjoying the sun
As a weekday vampire, I'll go out and try to survive the sunlight or I'll prepare the indicators to share for next week. Not sure at this point....
This week, I shared a Trade Manager Trade-Manager-Open-Source-Version/ that you need to get connected to your indicator
Some traders asked if I could give away an alternative version meaning they'll have their own indicator separately and once they'll get their signal, they'll add the Trade Manager to manage their take profits and stop losses. (I'm working for Tradingview charity apparently ^^)
I liked the idea a lot !!! I like it even more that this idea came from followera that I don't even know
How does it work ?
Basically, chose any indicator you want. Once you get your signal/alert, get in the trade with your broker, and add the Trade Manager (Non-Standalone Version) (note the Non-Standalone Version) <=
This is realy important !!
So this was defintively the Trade Manager week... I feel I shared one alternative of that tool a day. (might get banned for copy/pasting myself too much)
Not sure of how I managed it anyway but now let's summarize what you have in your trading toolkit so far :
- Trade Manager to be used DIRECTLY with another indicator : Trade-Manager-Open-Source-Version/
- Trade Manager to be used INDIRECTLY with another indicator : the one I'm sharing right now
- Risk/Reward & PnL & Errors management tool : Risk-Reward-InfoPanel/
If you want to build your own signals in a few clicks only, feel free to share my Algorithm/Strategy builder Strategy-Builder-Crypto-Single-Trend-Plots/
I made it so that you guys can build you own custom signals and then why not, plugging them to the Trade Manager and to the Risk/Reward indicators..... That's now that you're supposed to connect the dots and realizing that all indicators shared this week are deeply linked and powerful when well used together :-)
Wishing y'all a great weekend and see you Monday, well rested and fresh for a new set of indicators
_____________________________________________________________
Feel free to hit the thumbs up as it shows me that I'm not doing this for nothing and will motivate to deliver more quality content in the future. (Meaning... a few likes only = no indicators = Dave enjoying the beach)
Two good news happened this week for me
1) I'm an offically approved PineEditor/LUA/MT4 approved mentor on codementor. You can request a coaching with me if you want and I'll teach you how to build kick-ass indicators and strategies
Jump on a 1 to 1 coaching with me
2) I'm a top author Pine script :)
changes-to-script-publishing-on-tradingview-13462

Multi-indicator Signal Builder [Skyrexio]Overview
Multi-Indicator Signal Builder is a versatile, all-in-one script designed to streamline your trading workflow by combining multiple popular technical indicators under a single roof.
It features a single-entry, single-exit logic, intrabar stop-loss/take-profit handling, an optional time filter, a visually accessible condition table, and a built-in statistics label.
Traders can choose any combination of 12+ indicators (RSI, Ultimate Oscillator, Bollinger %B, Moving Averages, ADX, Stochastic, MACD, PSAR, MFI, CCI, Heikin Ashi, and a “TV Screener” placeholder) to form entry or exit conditions.
This script aims to simplify strategy creation and analysis , making it a powerful toolkit for technical traders.
Indicators Overview
RSI (Relative Strength Index)
Measures recent price changes to evaluate overbought or oversold conditions on a 0–100 scale.
Ultimate Oscillator (UO)
Uses weighted averages of three different timeframes, aiming to confirm price momentum while avoiding false divergences.
Bollinger %B
Expresses price relative to Bollinger Bands, indicating whether price is near the upper band (overbought) or lower band (oversold).
Moving Average (MA)
Smooths price data over a specified period. The script supports both SMA and EMA to help identify trend direction and potential crossovers.
ADX (Average Directional Index)
Gauges the strength of a trend (0–100). Higher ADX signals stronger momentum, while lower ADX indicates a weaker trend.
Stochastic
Compares a closing price to a price range over a given period to identify momentum shifts and potential reversals.
MACD (Moving Average Convergence/Divergence)
Tracks the difference between two EMAs plus a signal line, commonly used to spot momentum flips through crossovers.
PSAR (Parabolic SAR)
Plots a trailing stop-and-reverse dot that moves with the trend. Often used to signal potential reversals when price crosses PSAR.
MFI (Money Flow Index)
Similar to RSI but incorporates volume data. A reading above 80 can suggest overbought conditions, while below 20 may indicate oversold.
CCI (Commodity Channel Index)
Identifies cyclical trends or overbought/oversold levels by comparing current price to an average price over a set timeframe.
Heikin Ashi
A type of candlestick charting that filters out market noise. The script uses a streak-based approach (multiple consecutive bullish or bearish bars) to gauge mini-trends.
TV Screener
A placeholder condition designed to integrate external buy/sell logic (like a TradingView “Buy” or “Sell” rating). Users can override or reference external signals if desired.
Unique Features
Multi-Indicator Entry and Exit
You can selectively enable any subset of 12+ classic indicators, each with customizable parameters and conditions. A position opens only if all enabled entry conditions are met, and it closes only when all enabled exit conditions are satisfied, helping reduce false triggers.
Single-Entry / Single-Exit with Intrabar SL/TP
The script supports a single position at a time. Once a position is open, it monitors intrabar to see if the price hits your stop-loss or take-profit levels before the bar closes, making results more realistic for fast-moving markets.
Time Window Filter
Users may specify a start/end date range during which trades are allowed, making it convenient to focus on specific market cycles for backtesting or live trading.
Condition Table and Statistics
A table at the bottom of the chart lists all active entry/exit indicators. Upon each closed trade, an integrated statistics label displays net profit, total trades, win/loss count, average and median PnL, etc.
Seamless Alerts and Automation
• Configure alerts in TradingView using “Any alert() function call.”
• The script sends JSON alert messages you can route to your own webhook.
• The indicator can be integrated with Skyrexio alert bots to automate execution on major cryptocurrency exchanges.
Optional MA/PSAR Plots
For added visual clarity, optionally plot the chosen moving averages or PSAR on the chart to confirm signals without stacking multiple indicators.
Methodology
Multi-Indicator Entry Logic
When multiple entry indicators are enabled (e.g., RSI + Stochastic + MACD), the script requires all signals to align before generating an entry. Each indicator can be set for crossovers, crossunders, thresholds (above/below), etc. This “AND” logic aims to filter out low-confidence triggers.
Single-Entry Intrabar SL/TP
• One Position At a Time: Once an entry signal triggers, a trade opens at the bar’s close.
• Intrabar Checks: Stop-loss and take-profit levels (if enabled) are monitored on every tick. If either is reached, the position closes immediately, without waiting for the bar to end.
Exit Logic
All Conditions Must Agree: If the trade is still open (SL/TP not triggered), then all enabled exit indicators must confirm a closure before the script exits on the bar’s close.
Time Filter
Optional Trading Window: You can activate a date/time range to constrain entries and exits strictly to that interval.
Justification of Methodology
Indicator Confluence: Combining multiple tools (RSI, MACD, etc.) can reduce noise and false signals.
Intrabar SL/TP: Capturing real-time spikes or dips provides a more precise reflection of typical live trading scenarios.
Single-Entry Model: Straightforward for both manual and automated tracking (especially important in bridging to bots).
Custom Date Range: Helps refine backtesting for specific market conditions or to avoid known irregular data periods.
How to Use
Add the Script to Your Chart
• In TradingView, open Indicators , search for “Multi-indicator Signal Builder” .
• Click to add it to your chart.
Configure Inputs
• Time Filter: Set a start and end date for trades.
• Alerts Messages: Input any JSON or text payload needed by your external service or bot.
• Entry Conditions: Enable and configure any indicators (e.g., RSI, MACD) for a confluence-based entry.
• Close Conditions: Enable exit indicators, along with optional SL (negative %) and TP (positive %) levels.
Set Up Alerts
• In TradingView, select “Create Alert” → Condition = “Any alert() function call” → choose this script.
• Entry Alert: Triggers on the script’s entry signal.
• Close Alert: Triggers on the script’s close signal (or if SL/TP is hit).
• Skyrexio Alert Bots: You can route these alerts via webhook to Skyrexio alert bots to automate order execution on major crypto exchanges (or any other supported broker).
Visual Reference
• A condition table at the bottom summarizes active signals.
• Statistics Label updates automatically as trades are closed, showing PnL stats and distribution metrics.
Backtesting Guidelines
Symbol/Timeframe: Works on multiple assets and timeframes; always do thorough testing.
Realistic Costs: Adjust commissions and potential slippage to match typical exchange conditions.
Risk Management: If using the built-in stop-loss/take-profit, set percentages that reflect your personal risk tolerance.
Longer Test Horizons: Verify performance across diverse market cycles to gauge reliability.
Example of statistic calculation
Test Period: 2023-01-01 to 2025-12-31
Initial Capital: $1,000
Commission: 0.1%, Slippage ~5 ticks
Trade Count: 680 (varies by strategy conditions)
Win rate: 75.44% (varies by strategy conditions)
Net Profit: +90.14% (varies by strategy conditions)
Disclaimer
This indicator is provided strictly for informational and educational purposes.
It does not constitute financial or trading advice.
Past performance never guarantees future results.
Always test thoroughly in demo environments before using real capital.
Enjoy exploring the Multi-Indicator Signal Builder! Experiment with different indicator combinations and adjust parameters to align with your trading preferences, whether you trade manually or link your alerts to external automation services. Happy trading and stay safe!

Adaptive Genesis Engine [AGE]ADAPTIVE GENESIS ENGINE (AGE)
Pure Signal Evolution Through Genetic Algorithms
Where Darwin Meets Technical Analysis
🧬 WHAT YOU'RE GETTING - THE PURE INDICATOR
This is a technical analysis indicator - it generates signals, visualizes probability, and shows you the evolutionary process in real-time. This is NOT a strategy with automatic execution - it's a sophisticated signal generation system that you control .
What This Indicator Does:
Generates Long/Short entry signals with probability scores (35-88% range)
Evolves a population of up to 12 competing strategies using genetic algorithms
Validates strategies through walk-forward optimization (train/test cycles)
Visualizes signal quality through premium gradient clouds and confidence halos
Displays comprehensive metrics via enhanced dashboard
Provides alerts for entries and exits
Works on any timeframe, any instrument, any broker
What This Indicator Does NOT Do:
Execute trades automatically
Manage positions or calculate position sizes
Place orders on your behalf
Make trading decisions for you
This is pure signal intelligence. AGE tells you when and how confident it is. You decide whether and how much to trade.
🔬 THE SCIENCE: GENETIC ALGORITHMS MEET TECHNICAL ANALYSIS
What Makes This Different - The Evolutionary Foundation
Most indicators are static - they use the same parameters forever, regardless of market conditions. AGE is alive . It maintains a population of competing strategies that evolve, adapt, and improve through natural selection principles:
Birth: New strategies spawn through crossover breeding (combining DNA from fit parents) plus random mutation for exploration
Life: Each strategy trades virtually via shadow portfolios, accumulating wins/losses, tracking drawdown, and building performance history
Selection: Strategies are ranked by comprehensive fitness scoring (win rate, expectancy, drawdown control, signal efficiency)
Death: Weak strategies are culled periodically, with elite performers (top 2 by default) protected from removal
Evolution: The gene pool continuously improves as successful traits propagate and unsuccessful ones die out
This is not curve-fitting. Each new strategy must prove itself on out-of-sample data through walk-forward validation before being trusted for live signals.
🧪 THE DNA: WHAT EVOLVES
Every strategy carries a 10-gene chromosome controlling how it interprets market data:
Signal Sensitivity Genes
Entropy Sensitivity (0.5-2.0): Weight given to market order/disorder calculations. Low values = conservative, require strong directional clarity. High values = aggressive, act on weaker order signals.
Momentum Sensitivity (0.5-2.0): Weight given to RSI/ROC/MACD composite. Controls responsiveness to momentum shifts vs. mean-reversion setups.
Structure Sensitivity (0.5-2.0): Weight given to support/resistance positioning. Determines how much price location within swing range matters.
Probability Adjustment Genes
Probability Boost (-0.10 to +0.10): Inherent bias toward aggressive (+) or conservative (-) entries. Acts as personality trait - some strategies naturally optimistic, others pessimistic.
Trend Strength Requirement (0.3-0.8): Minimum trend conviction needed before signaling. Higher values = only trades strong trends, lower values = acts in weak/sideways markets.
Volume Filter (0.5-1.5): Strictness of volume confirmation. Higher values = requires strong volume, lower values = volume less important.
Risk Management Genes
ATR Multiplier (1.5-4.0): Base volatility scaling for all price levels. Controls whether strategy uses tight or wide stops/targets relative to ATR.
Stop Multiplier (1.0-2.5): Stop loss tightness. Lower values = aggressive profit protection, higher values = more breathing room.
Target Multiplier (1.5-4.0): Profit target ambition. Lower values = quick scalping exits, higher values = swing trading holds.
Adaptation Gene
Regime Adaptation (0.0-1.0): How much strategy adjusts behavior based on detected market regime (trending/volatile/choppy). Higher values = more reactive to regime changes.
The Magic: AGE doesn't just try random combinations. Through tournament selection and fitness-weighted crossover, successful gene combinations spread through the population while unsuccessful ones fade away. Over 50-100 bars, you'll see the population converge toward genes that work for YOUR instrument and timeframe.
📊 THE SIGNAL ENGINE: THREE-LAYER SYNTHESIS
Before any strategy generates a signal, AGE calculates probability through multi-indicator confluence:
Layer 1 - Market Entropy (Information Theory)
Measures whether price movements exhibit directional order or random walk characteristics:
The Math:
Shannon Entropy = -Σ(p × log(p))
Market Order = 1 - (Entropy / 0.693)
What It Means:
High entropy = choppy, random market → low confidence signals
Low entropy = directional market → high confidence signals
Direction determined by up-move vs down-move dominance over lookback period (default: 20 bars)
Signal Output: -1.0 to +1.0 (bearish order to bullish order)
Layer 2 - Momentum Synthesis
Combines three momentum indicators into single composite score:
Components:
RSI (40% weight): Normalized to -1/+1 scale using (RSI-50)/50
Rate of Change (30% weight): Percentage change over lookback (default: 14 bars), clamped to ±1
MACD Histogram (30% weight): Fast(12) - Slow(26), normalized by ATR
Why This Matters: RSI catches mean-reversion opportunities, ROC catches raw momentum, MACD catches momentum divergence. Weighting favors RSI for reliability while keeping other perspectives.
Signal Output: -1.0 to +1.0 (strong bearish to strong bullish)
Layer 3 - Structure Analysis
Evaluates price position within swing range (default: 50-bar lookback):
Position Classification:
Bottom 20% of range = Support Zone → bullish bounce potential
Top 20% of range = Resistance Zone → bearish rejection potential
Middle 60% = Neutral Zone → breakout/breakdown monitoring
Signal Logic:
At support + bullish candle = +0.7 (strong buy setup)
At resistance + bearish candle = -0.7 (strong sell setup)
Breaking above range highs = +0.5 (breakout confirmation)
Breaking below range lows = -0.5 (breakdown confirmation)
Consolidation within range = ±0.3 (weak directional bias)
Signal Output: -1.0 to +1.0 (bearish structure to bullish structure)
Confluence Voting System
Each layer casts a vote (Long/Short/Neutral). The system requires minimum 2-of-3 agreement (configurable 1-3) before generating a signal:
Examples:
Entropy: Bullish, Momentum: Bullish, Structure: Neutral → Signal generated (2 long votes)
Entropy: Bearish, Momentum: Neutral, Structure: Neutral → No signal (only 1 short vote)
All three bullish → Signal generated with +5% probability bonus
This is the key to quality. Single indicators give too many false signals. Triple confirmation dramatically improves accuracy.
📈 PROBABILITY CALCULATION: HOW CONFIDENCE IS MEASURED
Base Probability:
Raw_Prob = 50% + (Average_Signal_Strength × 25%)
Then AGE applies strategic adjustments:
Trend Alignment:
Signal with trend: +4%
Signal against strong trend: -8%
Weak/no trend: no adjustment
Regime Adaptation:
Trending market (efficiency >50%, moderate vol): +3%
Volatile market (vol ratio >1.5x): -5%
Choppy market (low efficiency): -2%
Volume Confirmation:
Volume > 70% of 20-bar SMA: no change
Volume below threshold: -3%
Volatility State (DVS Ratio):
High vol (>1.8x baseline): -4% (reduce confidence in chaos)
Low vol (<0.7x baseline): -2% (markets can whipsaw in compression)
Moderate elevated vol (1.0-1.3x): +2% (trending conditions emerging)
Confluence Bonus:
All 3 indicators agree: +5%
2 of 3 agree: +2%
Strategy Gene Adjustment:
Probability Boost gene: -10% to +10%
Regime Adaptation gene: scales regime adjustments by 0-100%
Final Probability: Clamped between 35% (minimum) and 88% (maximum)
Why These Ranges?
Below 35% = too uncertain, better not to signal
Above 88% = unrealistic, creates overconfidence
Sweet spot: 65-80% for quality entries
🔄 THE SHADOW PORTFOLIO SYSTEM: HOW STRATEGIES COMPETE
Each active strategy maintains a virtual trading account that executes in parallel with real-time data:
Shadow Trading Mechanics
Entry Logic:
Calculate signal direction, probability, and confluence using strategy's unique DNA
Check if signal meets quality gate:
Probability ≥ configured minimum threshold (default: 65%)
Confluence ≥ configured minimum (default: 2 of 3)
Direction is not zero (must be long or short, not neutral)
Verify signal persistence:
Base requirement: 2 bars (configurable 1-5)
Adapts based on probability: high-prob signals (75%+) enter 1 bar faster, low-prob signals need 1 bar more
Adjusts for regime: trending markets reduce persistence by 1, volatile markets add 1
Apply additional filters:
Trend strength must exceed strategy's requirement gene
Regime filter: if volatile market detected, probability must be 72%+ to override
Volume confirmation required (volume > 70% of average)
If all conditions met for required persistence bars, enter shadow position at current close price
Position Management:
Entry Price: Recorded at close of entry bar
Stop Loss: ATR-based distance = ATR × ATR_Mult (gene) × Stop_Mult (gene) × DVS_Ratio
Take Profit: ATR-based distance = ATR × ATR_Mult (gene) × Target_Mult (gene) × DVS_Ratio
Position: +1 (long) or -1 (short), only one at a time per strategy
Exit Logic:
Check if price hit stop (on low) or target (on high) on current bar
Record trade outcome in R-multiples (profit/loss normalized by ATR)
Update performance metrics:
Total trades counter incremented
Wins counter (if profit > 0)
Cumulative P&L updated
Peak equity tracked (for drawdown calculation)
Maximum drawdown from peak recorded
Enter cooldown period (default: 8 bars, configurable 3-20) before next entry allowed
Reset signal age counter to zero
Walk-Forward Tracking:
During position lifecycle, trades are categorized:
Training Phase (first 250 bars): Trade counted toward training metrics
Testing Phase (next 75 bars): Trade counted toward testing metrics (out-of-sample)
Live Phase (after WFO period): Trade counted toward overall metrics
Why Shadow Portfolios?
No lookahead bias (uses only data available at the bar)
Realistic execution simulation (entry on close, stop/target checks on high/low)
Independent performance tracking for true fitness comparison
Allows safe experimentation without risking capital
Each strategy learns from its own experience
🏆 FITNESS SCORING: HOW STRATEGIES ARE RANKED
Fitness is not just win rate. AGE uses a comprehensive multi-factor scoring system:
Core Metrics (Minimum 3 trades required)
Win Rate (30% of fitness):
WinRate = Wins / TotalTrades
Normalized directly (0.0-1.0 scale)
Total P&L (30% of fitness):
Normalized_PnL = (PnL + 300) / 600
Clamped 0.0-1.0. Assumes P&L range of -300R to +300R for normalization scale.
Expectancy (25% of fitness):
Expectancy = Total_PnL / Total_Trades
Normalized_Expectancy = (Expectancy + 30) / 60
Clamped 0.0-1.0. Rewards consistency of profit per trade.
Drawdown Control (15% of fitness):
Normalized_DD = 1 - (Max_Drawdown / 15)
Clamped 0.0-1.0. Penalizes strategies that suffer large equity retracements from peak.
Sample Size Adjustment
Quality Factor:
<50 trades: 1.0 (full weight, small sample)
50-100 trades: 0.95 (slight penalty for medium sample)
100 trades: 0.85 (larger penalty for large sample)
Why penalize more trades? Prevents strategies from gaming the system by taking hundreds of tiny trades to inflate statistics. Favors quality over quantity.
Bonus Adjustments
Walk-Forward Validation Bonus:
if (WFO_Validated):
Fitness += (WFO_Efficiency - 0.5) × 0.1
Strategies proven on out-of-sample data receive up to +10% fitness boost based on test/train efficiency ratio.
Signal Efficiency Bonus (if diagnostics enabled):
if (Signals_Evaluated > 10):
Pass_Rate = Signals_Passed / Signals_Evaluated
Fitness += (Pass_Rate - 0.1) × 0.05
Rewards strategies that generate high-quality signals passing the quality gate, not just profitable trades.
Final Fitness: Clamped at 0.0 minimum (prevents negative fitness values)
Result: Elite strategies typically achieve 0.50-0.75 fitness. Anything above 0.60 is excellent. Below 0.30 is prime candidate for culling.
🔬 WALK-FORWARD OPTIMIZATION: ANTI-OVERFITTING PROTECTION
This is what separates AGE from curve-fitted garbage indicators.
The Three-Phase Process
Every new strategy undergoes a rigorous validation lifecycle:
Phase 1 - Training Window (First 250 bars, configurable 100-500):
Strategy trades normally via shadow portfolio
All trades count toward training performance metrics
System learns which gene combinations produce profitable patterns
Tracks independently: Training_Trades, Training_Wins, Training_PnL
Phase 2 - Testing Window (Next 75 bars, configurable 30-200):
Strategy continues trading without any parameter changes
Trades now count toward testing performance metrics (separate tracking)
This is out-of-sample data - strategy has never seen these bars during "optimization"
Tracks independently: Testing_Trades, Testing_Wins, Testing_PnL
Phase 3 - Validation Check:
Minimum_Trades = 5 (configurable 3-15)
IF (Train_Trades >= Minimum AND Test_Trades >= Minimum):
WR_Efficiency = Test_WinRate / Train_WinRate
Expectancy_Efficiency = Test_Expectancy / Train_Expectancy
WFO_Efficiency = (WR_Efficiency + Expectancy_Efficiency) / 2
IF (WFO_Efficiency >= 0.55): // configurable 0.3-0.9
Strategy.Validated = TRUE
Strategy receives fitness bonus
ELSE:
Strategy receives 30% fitness penalty
ELSE:
Validation deferred (insufficient trades in one or both periods)
What Validation Means
Validated Strategy (Green "✓ VAL" in dashboard):
Performed at least 55% as well on unseen data compared to training data
Gets fitness bonus: +(efficiency - 0.5) × 0.1
Receives priority during tournament selection for breeding
More likely to be chosen as active trading strategy
Unvalidated Strategy (Orange "○ TRAIN" in dashboard):
Failed to maintain performance on test data (likely curve-fitted to training period)
Receives 30% fitness penalty (0.7x multiplier)
Makes strategy prime candidate for culling
Can still trade but with lower selection probability
Insufficient Data (continues collecting):
Hasn't completed both training and testing periods yet
OR hasn't achieved minimum trade count in both periods
Validation check deferred until requirements met
Why 55% Efficiency Threshold?
If a strategy earned 10R during training but only 5.5R during testing, it still proved an edge exists beyond random luck. Requiring 100% efficiency would be unrealistic - market conditions change between periods. But requiring >50% ensures the strategy didn't completely degrade on fresh data.
The Protection: Strategies that work great on historical data but fail on new data are automatically identified and penalized. This prevents the population from being polluted by overfitted strategies that would fail in live trading.
🌊 DYNAMIC VOLATILITY SCALING (DVS): ADAPTIVE STOP/TARGET PLACEMENT
AGE doesn't use fixed stop distances. It adapts to current volatility conditions in real-time.
Four Volatility Measurement Methods
1. ATR Ratio (Simple Method):
Current_Vol = ATR(14) / Close
Baseline_Vol = SMA(Current_Vol, 100)
Ratio = Current_Vol / Baseline_Vol
Basic comparison of current ATR to 100-bar moving average baseline.
2. Parkinson (High-Low Range Based):
For each bar: HL = log(High / Low)
Parkinson_Vol = sqrt(Σ(HL²) / (4 × Period × log(2)))
More stable than close-to-close volatility. Captures intraday range expansion without overnight gap noise.
3. Garman-Klass (OHLC Based):
HL_Term = 0.5 × ²
CO_Term = (2×log(2) - 1) × ²
GK_Vol = sqrt(Σ(HL_Term - CO_Term) / Period)
Most sophisticated estimator. Incorporates all four price points (open, high, low, close) plus gap information.
4. Ensemble Method (Default - Median of All Three):
Ratio_1 = ATR_Current / ATR_Baseline
Ratio_2 = Parkinson_Current / Parkinson_Baseline
Ratio_3 = GK_Current / GK_Baseline
DVS_Ratio = Median(Ratio_1, Ratio_2, Ratio_3)
Why Ensemble?
Takes median to avoid outliers and false spikes
If ATR jumps but range-based methods stay calm, median prevents overreaction
If one method fails, other two compensate
Most robust approach across different market conditions
Sensitivity Scaling
Scaled_Ratio = (Raw_Ratio) ^ Sensitivity
Sensitivity 0.3: Cube root - heavily dampens volatility impact
Sensitivity 0.5: Square root - moderate dampening
Sensitivity 0.7 (Default): Balanced response to volatility changes
Sensitivity 1.0: Linear - full 1:1 volatility impact
Sensitivity 1.5: Exponential - amplified response to volatility spikes
Safety Clamps: Final DVS Ratio always clamped between 0.5x and 2.5x baseline to prevent extreme position sizing or stop placement errors.
How DVS Affects Shadow Trading
Every strategy's stop and target distances are multiplied by the current DVS ratio:
Stop Loss Distance:
Stop_Distance = ATR × ATR_Mult (gene) × Stop_Mult (gene) × DVS_Ratio
Take Profit Distance:
Target_Distance = ATR × ATR_Mult (gene) × Target_Mult (gene) × DVS_Ratio
Example Scenario:
ATR = 10 points
Strategy's ATR_Mult gene = 2.5
Strategy's Stop_Mult gene = 1.5
Strategy's Target_Mult gene = 2.5
DVS_Ratio = 1.4 (40% above baseline volatility - market heating up)
Stop = 10 × 2.5 × 1.5 × 1.4 = 52.5 points (vs. 37.5 in normal vol)
Target = 10 × 2.5 × 2.5 × 1.4 = 87.5 points (vs. 62.5 in normal vol)
Result:
During volatility spikes: Stops automatically widen to avoid noise-based exits, targets extend for bigger moves
During calm periods: Stops tighten for better risk/reward, targets compress for realistic profit-taking
Strategies adapt risk management to match current market behavior
🧬 THE EVOLUTIONARY CYCLE: SPAWN, COMPETE, CULL
Initialization (Bar 1)
AGE begins with 4 seed strategies (if evolution enabled):
Seed Strategy #0 (Balanced):
All sensitivities at 1.0 (neutral)
Zero probability boost
Moderate trend requirement (0.4)
Standard ATR/stop/target multiples (2.5/1.5/2.5)
Mid-level regime adaptation (0.5)
Seed Strategy #1 (Momentum-Focused):
Lower entropy sensitivity (0.7), higher momentum (1.5)
Slight probability boost (+0.03)
Higher trend requirement (0.5)
Tighter stops (1.3), wider targets (3.0)
Seed Strategy #2 (Entropy-Driven):
Higher entropy sensitivity (1.5), lower momentum (0.8)
Slight probability penalty (-0.02)
More trend tolerant (0.6)
Wider stops (1.8), standard targets (2.5)
Seed Strategy #3 (Structure-Based):
Balanced entropy/momentum (0.8/0.9), high structure (1.4)
Slight probability boost (+0.02)
Lower trend requirement (0.35)
Moderate risk parameters (1.6/2.8)
All seeds start with WFO validation bypassed if WFO is disabled, or must validate if enabled.
Spawning New Strategies
Timing (Adaptive):
Historical phase: Every 30 bars (configurable 10-100)
Live phase: Every 200 bars (configurable 100-500)
Automatically switches to live timing when barstate.isrealtime triggers
Conditions:
Current population < max population limit (default: 8, configurable 4-12)
At least 2 active strategies exist (need parents)
Available slot in population array
Selection Process:
Run tournament selection 3 times with different seeds
Each tournament: randomly sample active strategies, pick highest fitness
Best from 3 tournaments becomes Parent 1
Repeat independently for Parent 2
Ensures fit parents but maintains diversity
Crossover Breeding:
For each of 10 genes:
Parent1_Fitness = fitness
Parent2_Fitness = fitness
Weight1 = Parent1_Fitness / (Parent1_Fitness + Parent2_Fitness)
Gene1 = parent1's value
Gene2 = parent2's value
Child_Gene = Weight1 × Gene1 + (1 - Weight1) × Gene2
Fitness-weighted crossover ensures fitter parent contributes more genetic material.
Mutation:
For each gene in child:
IF (random < mutation_rate):
Gene_Range = GENE_MAX - GENE_MIN
Noise = (random - 0.5) × 2 × mutation_strength × Gene_Range
Mutated_Gene = Clamp(Child_Gene + Noise, GENE_MIN, GENE_MAX)
Historical mutation rate: 20% (aggressive exploration)
Live mutation rate: 8% (conservative stability)
Mutation strength: 12% of gene range (configurable 5-25%)
Initialization of New Strategy:
Unique ID assigned (total_spawned counter)
Parent ID recorded
Generation = max(parent generations) + 1
Birth bar recorded (for age tracking)
All performance metrics zeroed
Shadow portfolio reset
WFO validation flag set to false (must prove itself)
Result: New strategy with hybrid DNA enters population, begins trading in next bar.
Competition (Every Bar)
All active strategies:
Calculate their signal based on unique DNA
Check quality gate with their thresholds
Manage shadow positions (entries/exits)
Update performance metrics
Recalculate fitness score
Track WFO validation progress
Strategies compete indirectly through fitness ranking - no direct interaction.
Culling Weak Strategies
Timing (Adaptive):
Historical phase: Every 60 bars (configurable 20-200, should be 2x spawn interval)
Live phase: Every 400 bars (configurable 200-1000, should be 2x spawn interval)
Minimum Adaptation Score (MAS):
Initial MAS = 0.10
MAS decays: MAS × 0.995 every cull cycle
Minimum MAS = 0.03 (floor)
MAS represents the "survival threshold" - strategies below this fitness level are vulnerable.
Culling Conditions (ALL must be true):
Population > minimum population (default: 3, configurable 2-4)
At least one strategy has fitness < MAS
Strategy's age > culling interval (prevents premature culling of new strategies)
Strategy is not in top N elite (default: 2, configurable 1-3)
Culling Process:
Find worst strategy:
For each active strategy:
IF (age > cull_interval):
Fitness = base_fitness
IF (not WFO_validated AND WFO_enabled):
Fitness × 0.7 // 30% penalty for unvalidated
IF (Fitness < MAS AND Fitness < worst_fitness_found):
worst_strategy = this_strategy
worst_fitness = Fitness
IF (worst_strategy found):
Count elite strategies with fitness > worst_fitness
IF (elite_count >= elite_preservation_count):
Deactivate worst_strategy (set active flag = false)
Increment total_culled counter
Elite Protection:
Even if a strategy's fitness falls below MAS, it survives if fewer than N strategies are better. This prevents culling when population is generally weak.
Result: Weak strategies removed from population, freeing slots for new spawns. Gene pool improves over time.
Selection for Display (Every Bar)
AGE chooses one strategy to display signals:
Best fitness = -1
Selected = none
For each active strategy:
Fitness = base_fitness
IF (WFO_validated):
Fitness × 1.3 // 30% bonus for validated strategies
IF (Fitness > best_fitness):
best_fitness = Fitness
selected_strategy = this_strategy
Display selected strategy's signals on chart
Result: Only the highest-fitness (optionally validated-boosted) strategy's signals appear as chart markers. Other strategies trade invisibly in shadow portfolios.
🎨 PREMIUM VISUALIZATION SYSTEM
AGE includes sophisticated visual feedback that standard indicators lack:
1. Gradient Probability Cloud (Optional, Default: ON)
Multi-layer gradient showing signal buildup 2-3 bars before entry:
Activation Conditions:
Signal persistence > 0 (same directional signal held for multiple bars)
Signal probability ≥ minimum threshold (65% by default)
Signal hasn't yet executed (still in "forming" state)
Visual Construction:
7 gradient layers by default (configurable 3-15)
Each layer is a line-fill pair (top line, bottom line, filled between)
Layer spacing: 0.3 to 1.0 × ATR above/below price
Outer layers = faint, inner layers = bright
Color transitions from base to intense based on layer position
Transparency scales with probability (high prob = more opaque)
Color Selection:
Long signals: Gradient from theme.gradient_bull_mid to theme.gradient_bull_strong
Short signals: Gradient from theme.gradient_bear_mid to theme.gradient_bear_strong
Base transparency: 92%, reduces by up to 8% for high-probability setups
Dynamic Behavior:
Cloud grows/shrinks as signal persistence increases/decreases
Redraws every bar while signal is forming
Disappears when signal executes or invalidates
Performance Note: Computationally expensive due to linefill objects. Disable or reduce layers if chart performance degrades.
2. Population Fitness Ribbon (Optional, Default: ON)
Histogram showing fitness distribution across active strategies:
Activation: Only draws on last bar (barstate.islast) to avoid historical clutter
Visual Construction:
10 histogram layers by default (configurable 5-20)
Plots 50 bars back from current bar
Positioned below price at: lowest_low(100) - 1.5×ATR (doesn't interfere with price action)
Each layer represents a fitness threshold (evenly spaced min to max fitness)
Layer Logic:
For layer_num from 0 to ribbon_layers:
Fitness_threshold = min_fitness + (max_fitness - min_fitness) × (layer / layers)
Count strategies with fitness ≥ threshold
Height = ATR × 0.15 × (count / total_active)
Y_position = base_level + ATR × 0.2 × layer
Color = Gradient from weak to strong based on layer position
Line_width = Scaled by height (taller = thicker)
Visual Feedback:
Tall, bright ribbon = healthy population, many fit strategies at high fitness levels
Short, dim ribbon = weak population, few strategies achieving good fitness
Ribbon compression (layers close together) = population converging to similar fitness
Ribbon spread = diverse fitness range, active selection pressure
Use Case: Quick visual health check without opening dashboard. Ribbon growing upward over time = population improving.
3. Confidence Halo (Optional, Default: ON)
Circular polyline around entry signals showing probability strength:
Activation: Draws when new position opens (shadow_position changes from 0 to ±1)
Visual Construction:
20-segment polyline forming approximate circle
Center: Low - 0.5×ATR (long) or High + 0.5×ATR (short)
Radius: 0.3×ATR (low confidence) to 1.0×ATR (elite confidence)
Scales with: (probability - min_probability) / (1.0 - min_probability)
Color Coding:
Elite (85%+): Cyan (theme.conf_elite), large radius, minimal transparency (40%)
Strong (75-85%): Strong green (theme.conf_strong), medium radius, moderate transparency (50%)
Good (65-75%): Good green (theme.conf_good), smaller radius, more transparent (60%)
Moderate (<65%): Moderate green (theme.conf_moderate), tiny radius, very transparent (70%)
Technical Detail:
Uses chart.point array with index-based positioning
5-bar horizontal spread for circular appearance (±5 bars from entry)
Curved=false (Pine Script polyline limitation)
Fill color matches line color but more transparent (88% vs line's transparency)
Purpose: Instant visual probability assessment. No need to check dashboard - halo size/brightness tells the story.
4. Evolution Event Markers (Optional, Default: ON)
Visual indicators of genetic algorithm activity:
Spawn Markers (Diamond, Cyan):
Plots when total_spawned increases on current bar
Location: bottom of chart (location.bottom)
Color: theme.spawn_marker (cyan/bright blue)
Size: tiny
Indicates new strategy just entered population
Cull Markers (X-Cross, Red):
Plots when total_culled increases on current bar
Location: bottom of chart (location.bottom)
Color: theme.cull_marker (red/pink)
Size: tiny
Indicates weak strategy just removed from population
What It Tells You:
Frequent spawning early = population building, active exploration
Frequent culling early = high selection pressure, weak strategies dying fast
Balanced spawn/cull = healthy evolutionary churn
No markers for long periods = stable population (evolution plateaued or optimal genes found)
5. Entry/Exit Markers
Clear visual signals for selected strategy's trades:
Long Entry (Triangle Up, Green):
Plots when selected strategy opens long position (position changes 0 → +1)
Location: below bar (location.belowbar)
Color: theme.long_primary (green/cyan depending on theme)
Transparency: Scales with probability:
Elite (85%+): 0% (fully opaque)
Strong (75-85%): 10%
Good (65-75%): 20%
Acceptable (55-65%): 35%
Size: small
Short Entry (Triangle Down, Red):
Plots when selected strategy opens short position (position changes 0 → -1)
Location: above bar (location.abovebar)
Color: theme.short_primary (red/pink depending on theme)
Transparency: Same scaling as long entries
Size: small
Exit (X-Cross, Orange):
Plots when selected strategy closes position (position changes ±1 → 0)
Location: absolute (at actual exit price if stop/target lines enabled)
Color: theme.exit_color (orange/yellow depending on theme)
Transparency: 0% (fully opaque)
Size: tiny
Result: Clean, probability-scaled markers that don't clutter chart but convey essential information.
6. Stop Loss & Take Profit Lines (Optional, Default: ON)
Visual representation of shadow portfolio risk levels:
Stop Loss Line:
Plots when selected strategy has active position
Level: shadow_stop value from selected strategy
Color: theme.short_primary with 60% transparency (red/pink, subtle)
Width: 2
Style: plot.style_linebr (breaks when no position)
Take Profit Line:
Plots when selected strategy has active position
Level: shadow_target value from selected strategy
Color: theme.long_primary with 60% transparency (green, subtle)
Width: 2
Style: plot.style_linebr (breaks when no position)
Purpose:
Shows where shadow portfolio would exit for stop/target
Helps visualize strategy's risk/reward ratio
Useful for manual traders to set similar levels
Disable for cleaner chart (recommended for presentations)
7. Dynamic Trend EMA
Gradient-colored trend line that visualizes trend strength:
Calculation:
EMA(close, trend_length) - default 50 period (configurable 20-100)
Slope calculated over 10 bars: (current_ema - ema ) / ema × 100
Color Logic:
Trend_direction:
Slope > 0.1% = Bullish (1)
Slope < -0.1% = Bearish (-1)
Otherwise = Neutral (0)
Trend_strength = abs(slope)
Color = Gradient between:
- Neutral color (gray/purple)
- Strong bullish (bright green) if direction = 1
- Strong bearish (bright red) if direction = -1
Gradient factor = trend_strength (0 to 1+ scale)
Visual Behavior:
Faint gray/purple = weak/no trend (choppy conditions)
Light green/red = emerging trend (low strength)
Bright green/red = strong trend (high conviction)
Color intensity = trend strength magnitude
Transparency: 50% (subtle, doesn't overpower price action)
Purpose: Subconscious awareness of trend state without checking dashboard or indicators.
8. Regime Background Tinting (Subtle)
Ultra-low opacity background color indicating detected market regime:
Regime Detection:
Efficiency = directional_movement / total_range (over trend_length bars)
Vol_ratio = current_volatility / average_volatility
IF (efficiency > 0.5 AND vol_ratio < 1.3):
Regime = Trending (1)
ELSE IF (vol_ratio > 1.5):
Regime = Volatile (2)
ELSE:
Regime = Choppy (0)
Background Colors:
Trending: theme.regime_trending (dark green, 92-93% transparency)
Volatile: theme.regime_volatile (dark red, 93% transparency)
Choppy: No tint (normal background)
Purpose:
Subliminal regime awareness
Helps explain why signals are/aren't generating
Trending = ideal conditions for AGE
Volatile = fewer signals, higher thresholds applied
Choppy = mixed signals, lower confidence
Important: Extremely subtle by design. Not meant to be obvious, just subconscious context.
📊 ENHANCED DASHBOARD
Comprehensive real-time metrics in single organized panel (top-right position):
Dashboard Structure (5 columns × 14 rows)
Header Row:
Column 0: "🧬 AGE PRO" + phase indicator (🔴 LIVE or ⏪ HIST)
Column 1: "POPULATION"
Column 2: "PERFORMANCE"
Column 3: "CURRENT SIGNAL"
Column 4: "ACTIVE STRATEGY"
Column 0: Market State
Regime (📈 TREND / 🌊 CHAOS / ➖ CHOP)
DVS Ratio (current volatility scaling factor, format: #.##)
Trend Direction (▲ BULL / ▼ BEAR / ➖ FLAT with color coding)
Trend Strength (0-100 scale, format: #.##)
Column 1: Population Metrics
Active strategies (count / max_population)
Validated strategies (WFO passed / active total)
Current generation number
Total spawned (all-time strategy births)
Total culled (all-time strategy deaths)
Column 2: Aggregate Performance
Total trades across all active strategies
Aggregate win rate (%) - color-coded:
Green (>55%)
Orange (45-55%)
Red (<45%)
Total P&L in R-multiples - color-coded by positive/negative
Best fitness score in population (format: #.###)
MAS - Minimum Adaptation Score (cull threshold, format: #.###)
Column 3: Current Signal Status
Status indicator:
"▲ LONG" (green) if selected strategy in long position
"▼ SHORT" (red) if selected strategy in short position
"⏳ FORMING" (orange) if signal persisting but not yet executed
"○ WAITING" (gray) if no active signal
Confidence percentage (0-100%, format: #.#%)
Quality assessment:
"🔥 ELITE" (cyan) for 85%+ probability
"✓ STRONG" (bright green) for 75-85%
"○ GOOD" (green) for 65-75%
"- LOW" (dim) for <65%
Confluence score (X/3 format)
Signal age:
"X bars" if signal forming
"IN TRADE" if position active
"---" if no signal
Column 4: Selected Strategy Details
Strategy ID number (#X format)
Validation status:
"✓ VAL" (green) if WFO validated
"○ TRAIN" (orange) if still in training/testing phase
Generation number (GX format)
Personal fitness score (format: #.### with color coding)
Trade count
P&L and win rate (format: #.#R (##%) with color coding)
Color Scheme:
Panel background: theme.panel_bg (dark, low opacity)
Panel headers: theme.panel_header (slightly lighter)
Primary text: theme.text_primary (bright, high contrast)
Secondary text: theme.text_secondary (dim, lower contrast)
Positive metrics: theme.metric_positive (green)
Warning metrics: theme.metric_warning (orange)
Negative metrics: theme.metric_negative (red)
Special markers: theme.validated_marker, theme.spawn_marker
Update Frequency: Only on barstate.islast (current bar) to minimize CPU usage
Purpose:
Quick overview of entire system state
No need to check multiple indicators
Trading decisions informed by population health, regime state, and signal quality
Transparency into what AGE is thinking
🔍 DIAGNOSTICS PANEL (Optional, Default: OFF)
Detailed signal quality tracking for optimization and debugging:
Panel Structure (3 columns × 8 rows)
Position: Bottom-right corner (doesn't interfere with main dashboard)
Header Row:
Column 0: "🔍 DIAGNOSTICS"
Column 1: "COUNT"
Column 2: "%"
Metrics Tracked (for selected strategy only):
Total Evaluated:
Every signal that passed initial calculation (direction ≠ 0)
Represents total opportunities considered
✓ Passed:
Signals that passed quality gate and executed
Green color coding
Percentage of evaluated signals
Rejection Breakdown:
⨯ Probability:
Rejected because probability < minimum threshold
Most common rejection reason typically
⨯ Confluence:
Rejected because confluence < minimum required (e.g., only 1 of 3 indicators agreed)
⨯ Trend:
Rejected because signal opposed strong trend
Indicates counter-trend protection working
⨯ Regime:
Rejected because volatile regime detected and probability wasn't high enough to override
Shows regime filter in action
⨯ Volume:
Rejected because volume < 70% of 20-bar average
Indicates volume confirmation requirement
Color Coding:
Passed count: Green (success metric)
Rejection counts: Red (failure metrics)
Percentages: Gray (neutral, informational)
Performance Cost: Slight CPU overhead for tracking counters. Disable when not actively optimizing settings.
How to Use Diagnostics
Scenario 1: Too Few Signals
Evaluated: 200
Passed: 10 (5%)
⨯ Probability: 120 (60%)
⨯ Confluence: 40 (20%)
⨯ Others: 30 (15%)
Diagnosis: Probability threshold too high for this strategy's DNA.
Solution: Lower min probability from 65% to 60%, or allow strategy more time to evolve better DNA.
Scenario 2: Too Many False Signals
Evaluated: 200
Passed: 80 (40%)
Strategy win rate: 45%
Diagnosis: Quality gate too loose, letting low-quality signals through.
Solution: Raise min probability to 70%, or increase min confluence to 3 (all indicators must agree).
Scenario 3: Regime-Specific Issues
⨯ Regime: 90 (45% of rejections)
Diagnosis: Frequent volatile regime detection blocking otherwise good signals.
Solution: Either accept fewer trades during chaos (recommended), or disable regime filter if you want signals regardless of market state.
Optimization Workflow:
Enable diagnostics
Run 200+ bars
Analyze rejection patterns
Adjust settings based on data
Re-run and compare pass rate
Disable diagnostics when satisfied
⚙️ CONFIGURATION GUIDE
🧬 Evolution Engine Settings
Enable AGE Evolution (Default: ON):
ON: Full genetic algorithm (recommended for best results)
OFF: Uses only 4 seed strategies, no spawning/culling (static population for comparison testing)
Max Population (4-12, Default: 8):
Higher = more diversity, more exploration, slower performance
Lower = faster computation, less exploration, risk of premature convergence
Sweet spot: 6-8 for most use cases
4 = minimum for meaningful evolution
12 = maximum before diminishing returns
Min Population (2-4, Default: 3):
Safety floor - system never culls below this count
Prevents population extinction during harsh selection
Should be at least half of max population
Elite Preservation (1-3, Default: 2):
Top N performers completely immune to culling
Ensures best genes always survive
1 = minimal protection, aggressive selection
2 = balanced (recommended)
3 = conservative, slower gene pool turnover
Historical: Spawn Interval (10-100, Default: 30):
Bars between spawning new strategies during historical data
Lower = faster evolution, more exploration
Higher = slower evolution, more evaluation time per strategy
30 bars = ~1-2 hours on 15min chart
Historical: Cull Interval (20-200, Default: 60):
Bars between culling weak strategies during historical data
Should be 2x spawn interval for balanced churn
Lower = aggressive selection pressure
Higher = patient evaluation
Live: Spawn Interval (100-500, Default: 200):
Bars between spawning during live trading
Much slower than historical for stability
Prevents population chaos during live trading
200 bars = ~1.5 trading days on 15min chart
Live: Cull Interval (200-1000, Default: 400):
Bars between culling during live trading
Should be 2x live spawn interval
Conservative removal during live trading
Historical: Mutation Rate (0.05-0.40, Default: 0.20):
Probability each gene mutates during breeding (20% = 2 out of 10 genes on average)
Higher = more exploration, slower convergence
Lower = more exploitation, faster convergence but risk of local optima
20% balances exploration vs exploitation
Live: Mutation Rate (0.02-0.20, Default: 0.08):
Mutation rate during live trading
Much lower for stability (don't want population to suddenly degrade)
8% = mostly inherits parent genes with small tweaks
Mutation Strength (0.05-0.25, Default: 0.12):
How much genes change when mutated (% of gene's total range)
0.05 = tiny nudges (fine-tuning)
0.12 = moderate jumps (recommended)
0.25 = large leaps (aggressive exploration)
Example: If gene range is 0.5-2.0, 12% strength = ±0.18 possible change
📈 Signal Quality Settings
Min Signal Probability (0.55-0.80, Default: 0.65):
Quality gate threshold - signals below this never generate
0.55-0.60 = More signals, accept lower confidence (higher risk)
0.65 = Institutional-grade balance (recommended)
0.70-0.75 = Fewer but higher-quality signals (conservative)
0.80+ = Very selective, very few signals (ultra-conservative)
Min Confluence Score (1-3, Default: 2):
Required indicator agreement before signal generates
1 = Any single indicator can trigger (not recommended - too many false signals)
2 = Requires 2 of 3 indicators agree (RECOMMENDED for balance)
3 = All 3 must agree (very selective, few signals, high quality)
Base Persistence Bars (1-5, Default: 2):
Base bars signal must persist before entry
System adapts automatically:
High probability signals (75%+) enter 1 bar faster
Low probability signals (<68%) need 1 bar more
Trending regime: -1 bar (faster entries)
Volatile regime: +1 bar (more confirmation)
1 = Immediate entry after quality gate (responsive but prone to whipsaw)
2 = Balanced confirmation (recommended)
3-5 = Patient confirmation (slower but more reliable)
Cooldown After Trade (3-20, Default: 8):
Bars to wait after exit before next entry allowed
Prevents overtrading and revenge trading
3 = Minimal cooldown (active trading)
8 = Balanced (recommended)
15-20 = Conservative (position trading)
Entropy Length (10-50, Default: 20):
Lookback period for market order/disorder calculation
Lower = more responsive to regime changes (noisy)
Higher = more stable regime detection (laggy)
20 = works across most timeframes
Momentum Length (5-30, Default: 14):
Period for RSI/ROC calculations
14 = standard (RSI default)
Lower = more signals, less reliable
Higher = fewer signals, more reliable
Structure Length (20-100, Default: 50):
Lookback for support/resistance swing range
20 = short-term swings (day trading)
50 = medium-term structure (recommended)
100 = major structure (position trading)
Trend EMA Length (20-100, Default: 50):
EMA period for trend detection and direction bias
20 = short-term trend (responsive)
50 = medium-term trend (recommended)
100 = long-term trend (position trading)
ATR Period (5-30, Default: 14):
Period for volatility measurement
14 = standard ATR
Lower = more responsive to vol changes
Higher = smoother vol calculation
📊 Volatility Scaling (DVS) Settings
Enable DVS (Default: ON):
Dynamic volatility scaling for adaptive stop/target placement
Highly recommended to leave ON
OFF only for testing fixed-distance stops
DVS Method (Default: Ensemble):
ATR Ratio: Simple, fast, single-method (good for beginners)
Parkinson: High-low range based (good for intraday)
Garman-Klass: OHLC based (sophisticated, considers gaps)
Ensemble: Median of all three (RECOMMENDED - most robust)
DVS Memory (20-200, Default: 100):
Lookback for baseline volatility comparison
20 = very responsive to vol changes (can overreact)
100 = balanced adaptation (recommended)
200 = slow, stable baseline (minimizes false vol signals)
DVS Sensitivity (0.3-1.5, Default: 0.7):
How much volatility affects scaling (power-law exponent)
0.3 = Conservative, heavily dampens vol impact (cube root)
0.5 = Moderate dampening (square root)
0.7 = Balanced response (recommended)
1.0 = Linear, full 1:1 vol response
1.5 = Aggressive, amplified response (exponential)
🔬 Walk-Forward Optimization Settings
Enable WFO (Default: ON):
Out-of-sample validation to prevent overfitting
Highly recommended to leave ON
OFF only for testing or if you want unvalidated strategies
Training Window (100-500, Default: 250):
Bars for in-sample optimization
100 = fast validation, less data (risky)
250 = balanced (recommended) - about 1-2 months on daily, 1-2 weeks on 15min
500 = patient validation, more data (conservative)
Testing Window (30-200, Default: 75):
Bars for out-of-sample validation
Should be ~30% of training window
30 = minimal test (fast validation)
75 = balanced (recommended)
200 = extensive test (very conservative)
Min Trades for Validation (3-15, Default: 5):
Required trades in BOTH training AND testing periods
3 = minimal sample (risky, fast validation)
5 = balanced (recommended)
10+ = conservative (slow validation, high confidence)
WFO Efficiency Threshold (0.3-0.9, Default: 0.55):
Minimum test/train performance ratio required
0.30 = Very loose (test must be 30% as good as training)
0.55 = Balanced (recommended) - test must be 55% as good
0.70+ = Strict (test must closely match training)
Higher = fewer validated strategies, lower risk of overfitting
🎨 Premium Visuals Settings
Visual Theme:
Neon Genesis: Cyberpunk aesthetic (cyan/magenta/purple)
Carbon Fiber: Industrial look (blue/red/gray)
Quantum Blue: Quantum computing (blue/purple/pink)
Aurora: Northern lights (teal/orange/purple)
⚡ Gradient Probability Cloud (Default: ON):
Multi-layer gradient showing signal buildup
Turn OFF if chart lags or for cleaner look
Cloud Gradient Layers (3-15, Default: 7):
More layers = smoother gradient, more CPU intensive
Fewer layers = faster, blockier appearance
🎗️ Population Fitness Ribbon (Default: ON):
Histogram showing fitness distribution
Turn OFF for cleaner chart
Ribbon Layers (5-20, Default: 10):
More layers = finer fitness detail
Fewer layers = simpler histogram
⭕ Signal Confidence Halo (Default: ON):
Circular indicator around entry signals
Size/brightness scales with probability
Minimal performance cost
🔬 Evolution Event Markers (Default: ON):
Diamond (spawn) and X (cull) markers
Shows genetic algorithm activity
Minimal performance cost
🎯 Stop/Target Lines (Default: ON):
Shows shadow portfolio stop/target levels
Turn OFF for cleaner chart (recommended for screenshots/presentations)
📊 Enhanced Dashboard (Default: ON):
Comprehensive metrics panel
Should stay ON unless you want zero overlays
🔍 Diagnostics Panel (Default: OFF):
Detailed signal rejection tracking
Turn ON when optimizing settings
Turn OFF during normal use (slight performance cost)
📈 USAGE WORKFLOW - HOW TO USE THIS INDICATOR
Phase 1: Initial Setup & Learning
Add AGE to your chart
Recommended timeframes: 15min, 30min, 1H (best signal-to-noise ratio)
Works on: 5min (day trading), 4H (swing trading), Daily (position trading)
Load 1000+ bars for sufficient evolution history
Let the population evolve (100+ bars minimum)
First 50 bars: Random exploration, poor results expected
Bars 50-150: Population converging, fitness improving
Bars 150+: Stable performance, validated strategies emerging
Watch the dashboard metrics
Population should grow toward max capacity
Generation number should advance regularly
Validated strategies counter should increase
Best fitness should trend upward toward 0.50-0.70 range
Observe evolution markers
Diamond markers (cyan) = new strategies spawning
X markers (red) = weak strategies being culled
Frequent early activity = healthy evolution
Activity slowing = population stabilizing
Be patient. Evolution takes time. Don't judge performance before 150+ bars.
Phase 2: Signal Observation
Watch signals form
Gradient cloud builds up 2-3 bars before entry
Cloud brightness = probability strength
Cloud thickness = signal persistence
Check signal quality
Look at confidence halo size when entry marker appears
Large bright halo = elite setup (85%+)
Medium halo = strong setup (75-85%)
Small halo = good setup (65-75%)
Verify market conditions
Check trend EMA color (green = uptrend, red = downtrend, gray = choppy)
Check background tint (green = trending, red = volatile, clear = choppy)
Trending background + aligned signal = ideal conditions
Review dashboard signal status
Current Signal column shows:
Status (Long/Short/Forming/Waiting)
Confidence % (actual probability value)
Quality assessment (Elite/Strong/Good)
Confluence score (2/3 or 3/3 preferred)
Only signals meeting ALL quality gates appear on chart. If you're not seeing signals, population is either still learning or market conditions aren't suitable.
Phase 3: Manual Trading Execution
When Long Signal Fires:
Verify confidence level (dashboard or halo size)
Confirm trend alignment (EMA sloping up, green color)
Check regime (preferably trending or choppy, avoid volatile)
Enter long manually on your broker platform
Set stop loss at displayed stop line level (if lines enabled), or use your own risk management
Set take profit at displayed target line level, or trail manually
Monitor position - exit if X marker appears (signal reversal)
When Short Signal Fires:
Same verification process
Confirm downtrend (EMA sloping down, red color)
Enter short manually
Use displayed stop/target levels or your own
AGE tells you WHEN and HOW CONFIDENT. You decide WHETHER and HOW MUCH.
Phase 4: Set Up Alerts (Never Miss a Signal)
Right-click on indicator name in legend
Select "Add Alert"
Choose condition:
"AGE Long" = Long entry signal fired
"AGE Short" = Short entry signal fired
"AGE Exit" = Position reversal/exit signal
Set notification method:
Sound alert (popup on chart)
Email notification
Webhook to phone/trading platform
Mobile app push notification
Name the alert (e.g., "AGE BTCUSD 15min Long")
Save alert
Recommended: Set alerts for both long and short, enable mobile push notifications. You'll get alerted in real-time even if not watching charts.
Phase 5: Monitor Population Health
Weekly Review:
Check dashboard Population column:
Active count should be near max (6-8 of 8)
Validated count should be >50% of active
Generation should be advancing (1-2 per week typical)
Check dashboard Performance column:
Aggregate win rate should be >50% (target: 55-65%)
Total P&L should be positive (may fluctuate)
Best fitness should be >0.50 (target: 0.55-0.70)
MAS should be declining slowly (normal adaptation)
Check Active Strategy column:
Selected strategy should be validated (✓ VAL)
Personal fitness should match best fitness
Trade count should be accumulating
Win rate should be >50%
Warning Signs:
Zero validated strategies after 300+ bars = settings too strict or market unsuitable
Best fitness stuck <0.30 = population struggling, consider parameter adjustment
No spawning/culling for 200+ bars = evolution stalled (may be optimal or need reset)
Aggregate win rate <45% sustained = system not working on this instrument/timeframe
Health Check Pass:
50%+ strategies validated
Best fitness >0.50
Aggregate win rate >52%
Regular spawn/cull activity
Selected strategy validated
Phase 6: Optimization (If Needed)
Enable Diagnostics Panel (bottom-right) for data-driven tuning:
Problem: Too Few Signals
Evaluated: 200
Passed: 8 (4%)
⨯ Probability: 140 (70%)
Solutions:
Lower min probability: 65% → 60% or 55%
Reduce min confluence: 2 → 1
Lower base persistence: 2 → 1
Increase mutation rate temporarily to explore new genes
Check if regime filter is blocking signals (⨯ Regime high?)
Problem: Too Many False Signals
Evaluated: 200
Passed: 90 (45%)
Win rate: 42%
Solutions:
Raise min probability: 65% → 70% or 75%
Increase min confluence: 2 → 3
Raise base persistence: 2 → 3
Enable WFO if disabled (validates strategies before use)
Check if volume filter is being ignored (⨯ Volume low?)
Problem: Counter-Trend Losses
⨯ Trend: 5 (only 5% rejected)
Losses often occur against trend
Solutions:
System should already filter trend opposition
May need stronger trend requirement
Consider only taking signals aligned with higher timeframe trend
Use longer trend EMA (50 → 100)
Problem: Volatile Market Whipsaws
⨯ Regime: 100 (50% rejected by volatile regime)
Still getting stopped out frequently
Solutions:
System is correctly blocking volatile signals
Losses happening because vol filter isn't strict enough
Consider not trading during volatile periods (respect the regime)
Or disable regime filter and accept higher risk
Optimization Workflow:
Enable diagnostics
Run 200+ bars with current settings
Analyze rejection patterns and win rate
Make ONE change at a time (scientific method)
Re-run 200+ bars and compare results
Keep change if improvement, revert if worse
Disable diagnostics when satisfied
Never change multiple parameters at once - you won't know what worked.
Phase 7: Multi-Instrument Deployment
AGE learns independently on each chart:
Recommended Strategy:
Deploy AGE on 3-5 different instruments
Different asset classes ideal (e.g., ES futures, EURUSD, BTCUSD, SPY, Gold)
Each learns optimal strategies for that instrument's personality
Take signals from all 5 charts
Natural diversification reduces overall risk
Why This Works:
When one market is choppy, others may be trending
Different instruments respond to different news/catalysts
Portfolio-level win rate more stable than single-instrument
Evolution explores different parameter spaces on each chart
Setup:
Same settings across all charts (or customize if preferred)
Set alerts for all
Take every validated signal across all instruments
Position size based on total account (don't overleverage any single signal)
⚠️ REALISTIC EXPECTATIONS - CRITICAL READING
What AGE Can Do
✅ Generate probability-weighted signals using genetic algorithms
✅ Evolve strategies in real-time through natural selection
✅ Validate strategies on out-of-sample data (walk-forward optimization)
✅ Adapt to changing market conditions automatically over time
✅ Provide comprehensive metrics on population health and signal quality
✅ Work on any instrument, any timeframe, any broker
✅ Improve over time as weak strategies are culled and fit strategies breed
What AGE Cannot Do
❌ Win every trade (typical win rate: 55-65% at best)
❌ Predict the future with certainty (markets are probabilistic, not deterministic)
❌ Work perfectly from bar 1 (needs 100-150 bars to learn and stabilize)
❌ Guarantee profits under all market conditions
❌ Replace your trading discipline and risk management
❌ Execute trades automatically (this is an indicator, not a strategy)
❌ Prevent all losses (drawdowns are normal and expected)
❌ Adapt instantly to regime changes (re-learning takes 50-100 bars)
Performance Realities
Typical Performance After Evolution Stabilizes (150+ bars):
Win Rate: 55-65% (excellent for trend-following systems)
Profit Factor: 1.5-2.5 (realistic for validated strategies)
Signal Frequency: 5-15 signals per 100 bars (quality over quantity)
Drawdown Periods: 20-40% of time in equity retracement (normal trading reality)
Max Consecutive Losses: 5-8 losses possible even with 60% win rate (probability says this is normal)
Evolution Timeline:
Bars 0-50: Random exploration, learning phase - poor results expected, don't judge yet
Bars 50-150: Population converging, fitness climbing - results improving
Bars 150-300: Stable performance, most strategies validated - consistent results
Bars 300+: Mature population, optimal genes dominant - best results
Market Condition Dependency:
Trending Markets: AGE excels - clear directional moves, high-probability setups
Choppy Markets: AGE struggles - fewer signals generated, lower win rate
Volatile Markets: AGE cautious - higher rejection rate, wider stops, fewer trades
Market Regime Changes:
When market shifts from trending to choppy overnight
Validated strategies can become temporarily invalidated
AGE will adapt through evolution, but not instantly
Expect 50-100 bar re-learning period after major regime shifts
Fitness may temporarily drop then recover
This is NOT a holy grail. It's a sophisticated signal generator that learns and adapts using genetic algorithms. Your success depends on:
Patience during learning periods (don't abandon after 3 losses)
Proper position sizing (risk 0.5-2% per trade, not 10%)
Following signals consistently (cherry-picking defeats statistical edge)
Not abandoning system prematurely (give it 200+ bars minimum)
Understanding probability (60% win rate means 40% of trades WILL lose)
Respecting market conditions (trending = trade more, choppy = trade less)
Managing emotions (AGE is emotionless, you need to be too)
Expected Drawdowns:
Single-strategy max DD: 10-20% of equity (normal)
Portfolio across multiple instruments: 5-15% (diversification helps)
Losing streaks: 3-5 consecutive losses expected periodically
No indicator eliminates risk. AGE manages risk through:
Quality gates (rejecting low-probability signals)
Confluence requirements (multi-indicator confirmation)
Persistence requirements (no knee-jerk reactions)
Regime awareness (reduced trading in chaos)
Walk-forward validation (preventing overfitting)
But it cannot prevent all losses. That's inherent to trading.
🔧 TECHNICAL SPECIFICATIONS
Platform: TradingView Pine Script v5
Indicator Type: Overlay indicator (plots on price chart)
Execution Type: Signals only - no automatic order placement
Computational Load:
Moderate to High (genetic algorithms + shadow portfolios)
8 strategies × shadow portfolio simulation = significant computation
Premium visuals add additional load (gradient cloud, fitness ribbon)
TradingView Resource Limits (Built-in Caps):
Max Bars Back: 500 (sufficient for WFO and evolution)
Max Labels: 100 (plenty for entry/exit markers)
Max Lines: 150 (adequate for stop/target lines)
Max Boxes: 50 (not heavily used)
Max Polylines: 100 (confidence halos)
Recommended Chart Settings:
Timeframe: 15min to 1H (optimal signal/noise balance)
5min: Works but noisier, more signals
4H/Daily: Works but fewer signals
Bars Loaded: 1000+ (ensures sufficient evolution history)
Replay Mode: Excellent for testing without risk
Performance Optimization Tips:
Disable gradient cloud if chart lags (most CPU intensive visual)
Disable fitness ribbon if still laggy
Reduce cloud layers from 7 to 3
Reduce ribbon layers from 10 to 5
Turn off diagnostics panel unless actively tuning
Close other heavy indicators to free resources
Browser/Platform Compatibility:
Works on all modern browsers (Chrome, Firefox, Safari, Edge)
Mobile app supported (full functionality on phone/tablet)
Desktop app supported (best performance)
Web version supported (may be slower on older computers)
Data Requirements:
Real-time or delayed data both work
No special data feeds required
Works with TradingView's standard data
Historical + live data seamlessly integrated
🎓 THEORETICAL FOUNDATIONS
AGE synthesizes advanced concepts from multiple disciplines:
Evolutionary Computation
Genetic Algorithms (Holland, 1975): Population-based optimization through natural selection metaphor
Tournament Selection: Fitness-based parent selection with diversity preservation
Crossover Operators: Fitness-weighted gene recombination from two parents
Mutation Operators: Random gene perturbation for exploration of new parameter space
Elitism: Preservation of top N performers to prevent loss of best solutions
Adaptive Parameters: Different mutation rates for historical vs. live phases
Technical Analysis
Support/Resistance: Price structure within swing ranges
Trend Following: EMA-based directional bias
Momentum Analysis: RSI, ROC, MACD composite indicators
Volatility Analysis: ATR-based risk scaling
Volume Confirmation: Trade activity validation
Information Theory
Shannon Entropy (1948): Quantification of market order vs. disorder
Signal-to-Noise Ratio: Directional information vs. random walk
Information Content: How much "information" a price move contains
Statistics & Probability
Walk-Forward Analysis: Rolling in-sample/out-of-sample optimization
Out-of-Sample Validation: Testing on unseen data to prevent overfitting
Monte Carlo Principles: Shadow portfolio simulation with realistic execution
Expectancy Theory: Win rate × avg win - loss rate × avg loss
Probability Distributions: Signal confidence quantification
Risk Management
ATR-Based Stops: Volatility-normalized risk per trade
Volatility Regime Detection: Market state classification (trending/choppy/volatile)
Drawdown Control: Peak-to-trough equity measurement
R-Multiple Normalization: Performance measurement in risk units
Machine Learning Concepts
Online Learning: Continuous adaptation as new data arrives
Fitness Functions: Multi-objective optimization (win rate + expectancy + drawdown)
Exploration vs. Exploitation: Balance between trying new strategies and using proven ones
Overfitting Prevention: Walk-forward validation as regularization
Novel Contribution:
AGE is the first TradingView indicator to apply genetic algorithms to real-time indicator parameter optimization while maintaining strict anti-overfitting controls through walk-forward validation.
Most "adaptive" indicators simply recalibrate lookback periods or thresholds. AGE evolves entirely new strategies through competitive selection - it's not parameter tuning, it's Darwinian evolution of trading logic itself.
The combination of:
Genetic algorithm population management
Shadow portfolio simulation for realistic fitness evaluation
Walk-forward validation to prevent overfitting
Multi-indicator confluence for signal quality
Dynamic volatility scaling for adaptive risk
...creates a system that genuinely learns and improves over time while avoiding the curse of curve-fitting that plagues most optimization approaches.
🏗️ DEVELOPMENT NOTES
This project represents months of intensive development, facing significant technical challenges:
Challenge 1: Making Genetics Actually Work
Early versions spawned garbage strategies that polluted the gene pool:
Random gene combinations produced nonsensical parameter sets
Weak strategies survived too long, dragging down population
No clear convergence toward optimal solutions
Solution:
Comprehensive fitness scoring (4 factors: win rate, P&L, expectancy, drawdown)
Elite preservation (top 2 always protected)
Walk-forward validation (unproven strategies penalized 30%)
Tournament selection (fitness-weighted breeding)
Adaptive culling (MAS decay creates increasing selection pressure)
Challenge 2: Balancing Evolution Speed vs. Stability
Too fast = population chaos, no convergence. Too slow = can't adapt to regime changes.
Solution:
Dual-phase timing: Fast evolution during historical (30/60 bar intervals), slow during live (200/400 bar intervals)
Adaptive mutation rates: 20% historical, 8% live
Spawn/cull ratio: Always 2:1 to prevent population collapse
Challenge 3: Shadow Portfolio Accuracy
Needed realistic trade simulation without lookahead bias:
Can't peek at future bars for exits
Must track multiple portfolios simultaneously
Stop/target checks must use bar's high/low correctly
Solution:
Entry on close (realistic)
Exit checks on current bar's high/low (realistic)
Independent position tracking per strategy
Cooldown periods to prevent unrealistic rapid re-entry
ATR-normalized P&L (R-multiples) for fair comparison across volatility regimes
Challenge 4: Pine Script Compilation Limits
Hit TradingView's execution limits multiple times:
Too many array operations
Too many variables
Too complex conditional logic
Solution:
Optimized data structures (single DNA array instead of 8 separate arrays)
Minimal visual overlays (only essential plots)
Efficient fitness calculations (vectorized where possible)
Strategic use of barstate.islast to minimize dashboard updates
Challenge 5: Walk-Forward Implementation
Standard WFO is difficult in Pine Script:
Can't easily "roll forward" through historical data
Can't re-optimize strategies mid-stream
Must work in real-time streaming environment
Solution:
Age-based phase detection (first 250 bars = training, next 75 = testing)
Separate metric tracking for train vs. test
Efficiency calculation at fixed interval (after test period completes)
Validation flag persists for strategy lifetime
Challenge 6: Signal Quality Control
Early versions generated too many signals with poor win rates:
Single indicators produced excessive noise
No trend alignment
No regime awareness
Instant entries on single-bar spikes
Solution:
Three-layer confluence system (entropy + momentum + structure)
Minimum 2-of-3 agreement requirement
Trend alignment checks (penalty for counter-trend)
Regime-based probability adjustments
Persistence requirements (signals must hold multiple bars)
Volume confirmation
Quality gate (probability + confluence thresholds)
The Result
A system that:
Truly evolves (not just parameter sweeps)
Truly validates (out-of-sample testing)
Truly adapts (ongoing competition and breeding)
Stays within TradingView's platform constraints
Provides institutional-quality signals
Maintains transparency (full metrics dashboard)
Development time: 3+ months of iterative refinement
Lines of code: ~1500 (highly optimized)
Test instruments: ES, NQ, EURUSD, BTCUSD, SPY, AAPL
Test timeframes: 5min, 15min, 1H, Daily
🎯 FINAL WORDS
The Adaptive Genesis Engine is not just another indicator - it's a living system that learns, adapts, and improves through the same principles that drive biological evolution. Every bar it observes adds to its experience. Every strategy it spawns explores new parameter combinations. Every strategy it culls removes weakness from the gene pool.
This is evolution in action on your charts.
You're not getting a static formula locked in time. You're getting a system that thinks , that competes , that survives through natural selection. The strongest strategies rise to the top. The weakest die. The gene pool improves generation after generation.
AGE doesn't claim to predict the future - it adapts to whatever the future brings. When markets shift from trending to choppy, from calm to volatile, from bullish to bearish - AGE evolves new strategies suited to the new regime.
Use it on any instrument. Any timeframe. Any market condition. AGE will adapt.
This indicator gives you the pure signal intelligence. How you choose to act on it - position sizing, risk management, execution discipline - that's your responsibility. AGE tells you when and how confident . You decide whether and how much .
Trust the process. Respect the evolution. Let Darwin work.
"In markets, as in nature, it is not the strongest strategies that survive, nor the most intelligent - but those most responsive to change."
Taking you to school. — Dskyz, Trade with insight. Trade with anticipation.
— Happy Holiday's

Defended Price Levels (DPLs) — Melvin Dickover ConceptThis indicator identifies and draws horizontal “Defended Price Levels” (DPLs) exactly as originally described by Melvin E. Dickover in his trading methodology.
Dickover observed that when extreme relative volume and extreme “freedom of movement” (volume-to-price-movement ratio) occur on the same bar, especially on bars with large gaps or unusually large bodies, the closing price (or previous close) of that bar very often becomes a significant future support/resistance level that the market later “defends.”
This script automates the detection of those exact coincident spikes using two well-known public indicators:
Relative Volume (RVI)
• Original idea: Melvin Dickover
• Pine Script implementation used here: “Relative Volume Indicator (Freedom Of Movement)” by LazyBear
Link:
Freedom of Movement (FoM)
• Original idea and calculation: starbolt64
• Pine Script: “Freedom of Movement” by starbolt64
Link:
How this indicator works
Calculates the raw (possibly negative) LazyBear RVI and starbolt64’s exact FoM values
Normalizes and standardizes both over the user-defined lookback
Triggers only when both RVI and FoM exceed the chosen number of standard deviations on the same bar (true Dickover coincident-spike condition)
Applies Dickover’s original price-selection rules (uses current close on big gaps or 2× body expansion candles, otherwise previous close)
Draws a thin maroon horizontal ray only when the new level is sufficiently far from all previously drawn levels (default ≥0.8 %) and the maximum number of levels has not been reached
Keeps the chart clean by limiting the total number of significant defended levels shown
This is not a republish or minor variation of the two source scripts — it is a faithful automation of Melvin Dickover’s specific “defended price line” concept that he manually marked using the coincidence of these two indicators.
Full credit goes to:
Melvin E. Dickover — creator of the Defended Price Levels concept
LazyBear — author of the Relative Volume (RVI) implementation used here
starbolt64 — author of the Freedom of Movement indicator and calculation
Settings (all adjustable):
Standard Deviation Length (default 60)
Spike Threshold in standard deviations (default 2.0)
Minimum distance between levels in % (default 0.8 %)
Maximum significant levels to display (15–80)
Use these horizontal maroon lines as potential future support/resistance zones that the market has previously shown strong willingness to defend.
Thank you to Melvin, LazyBear, and starbolt64 for the original work that made this automation possible.

Trend Strength IndicatorThis is a Trend Strength Indicator that shows you the immediate trend and historical trend of price for up to 7 higher timeframes.
It shows the strength of each timeframe by showing a red or green dot based on where price is at compared to the previous higher timeframe candle. The brighter red or green the dot is, the stronger the trend is compared to that higher timeframe candle.
The colors and timeframes can be customized to suit your preference and you can also turn off as many timeframes as you’d like if you want less time frames to show up on the indicator.
It also includes alerts for when all timeframes are bullish or all timeframes are bearish.
Keep these timeframes set to higher time frames than your chart so you can trade in the direction of the overall higher timeframe trend.
Bullish Scoring & Colors
If the current candle close is above the midline of the higher time frame candle, it is given a score of 1 and a dark green dot. If the current candle close is above the higher timeframe candle body, then it is given a score of 2 and a medium green dot. If the current candle close is above the high of the higher time frame candle, it is given a score of 3 and a bright green dot.
The higher the score the stronger the bullish trend and the brighter green the dot will be.
Bearish Scoring & Colors
If the current candle close is below the midline of the higher timeframe candle, it is given a score of -1 and a dark red dot. If the current candle close is below the higher timeframe candle body, then it is given a score of -2 and a medium red dot. If the current candle close is below the low of the higher timeframe candle, it is given a score of -3 and a bright red dot.
The lower the score, the stronger the bearish trend and the brighter red the dot will be.
Trend Scoring Modes
We gave you the option to set the trend scoring mode to either score based on price above or below the midline for quick and easy trend identification, or using the midline, candle body and highs and lows to give you a more detailed view of the trend strength. You can switch between these modes by selecting your preferred mode in the settings panel. The default is Open, High, Low, Close + Midline.
Sending Trend Direction To External Indicators
We coded in the ability to use the trend strength score as a signal that you can use to filter other indicators. This feature is great for notifying signal generating indicators what direction the market is trending in so that the signal generating indicator only gives signals in the direction of the trend.
This feature works by providing a data output of 1, 0 or -1. 1 means the trend is bullish, 0 means the trend is neutral and -1 means the trend is bearish.
This score is calculated by using the score of each timeframe that is turned on and checking if all timeframes are in the same direction or not. So if 3 timeframes are turned on and they are all bullish, the indicator will provide a data output of 1. This tells your external indicators that the trend is bullish.
This data output can be found in the data window and is labeled Trend Direction To Send To External Indicators.
At the bottom of the settings panel, there is a setting called Trend Score Threshold For External Indicators. This setting is the score threshold that all timeframes will need to meet to allow a trend strength signal to go through. So if set to 1, then all timeframes must be scored 1 or higher for bullish or -1 or lower for bearish. If set to 2, then all timeframes must be 2 or higher for bullish or -2 or lower for bearish. If set to 3, then all timeframes must be 3 for bullish or -3 for bearish. If all timeframes have met this threshold, then a bullish or bearish signal can be sent to your external indicator as a trend filter.
Labels
There are labels to the right of each row of dots, telling you which timeframe is which so you can easily identify what timeframe each row is showing the trend for.
Alerts
You can set alerts for when all timeframes are bullish or when all timeframes are bearish. If you have some time frames turned off at the time of creating your alerts, then it will only require all timeframes that are on to be all bullish or bearish to generate an alert. Make sure to set your alerts to once per bar close to ensure you don’t get premature alerts that aren’t yet valid.
Backtesting
This indicator helps you quickly identify and backtest the trend direction, how strong that trend is on multiple timeframes and helps you spot reversals and trend continuations. Make sure you look back at a lot of historical data to see how price moves when trend changes take place and how well price continues in each direction compared to the overall trend. This will help you gain confidence in reading the indicator and using it to your advantage when trading.
Best Way To Use The Indicator
This indicator is designed to help you quickly identify the trend on various different timeframes. The brighter the green dots are, the stronger the bullish trend is. The brighter the red dots are, the stronger the bearish trend is.
Trade in the direction of the trend. If the colors are mixed green and red, then price is likely to chop back and forth, so only trade the extremes of the ranges when that happens.
When most of the lower timeframe dots are the same color, that means it is a strong trend and you should place trades in the direction of the trend to be safe. The lower timeframes will start trending before the higher timeframes, so take notice of the lower timeframe colors starting to agree with each other and then take advantage of the trend that is forming.
You can also spot reversals with this indicator by watching for the lower timeframes to start changing color after a strong trend in one direction. The lower timeframes will start to change color one by one, indicating that the trend is actually changing direction.
For best results, make sure you wait for the trend to show all bullish or all bearish at the same time before you place any trades. If you can be patient enough to do that, you will increase the probability of winning your trade because you are trading with the direction of the overall higher timeframe trend which is typically an easy way to win more trades. Of course wait for pullbacks during the trend so you can keep a tight stop loss after entering your trade.
If you are scalping, you can turn off the higher timeframes and just use the 1 hour through 1 day. This won’t be as reliable as using all timeframes and waiting for them to align, but it is suitable for scalping quick intraday movements.
Other Indicators To Pair This With
Use this in combination with our Higher Timeframe Candle Levels indicator so you can see all of these levels being used to calculate the trend strength scores and watch how price reacts to those levels. You should also use our Breakout Scanner to find other markets with strong trends so you always know which market is trending the strongest and can trade those. Trend Strength Indicator, Higher Timeframe Candle Levels and the Breakout Scanner all use the same levels and calculate the trend scores the same way so they are designed to work all together to help you quickly be able to read a chart and find what direction to trade in.

Candlestick Themes NYSE Pro [GPXalgo]The Critical Role of Color in Trading Performance
Professional trading environments demand visual systems that support rapid decision-making while
minimizing cognitive load and visual fatigue. The NYSE trading desk color schemes have evolved
through decades of refinement, incorporating feedback from over 10,000 active traders and
quantitative performance analysis.
Key Design Principles
1. Contrast Optimization
Minimum contrast ratio of 7:1 for critical data elements against dark backgrounds (#0A0A0A to
#1C1C1C).
2. Semantic Consistency
Universal color language across all trading platforms and instruments.
3. Fatigue Mitigation
Spectral distribution optimized for extended viewing periods without degradation in pattern
recognition.
4. Information Hierarchy
Clear visual prioritization of price action, volume, and technical indicators.
Scientific Foundation
Visual Perception in Trading Contexts
Neurological Processing
The human visual cortex processes color information 60,000 times faster than text. In trading
contexts, this translates to:
• 0.13 seconds average recognition time for color-coded signals
• 0.45 seconds for text-based information
• 72% improvement in pattern recognition with optimized color schemes
Circadian Rhythm Consideration
Trading desk colors are calibrated to minimize melatonin suppression during extended sessions:
• Blue light emission reduced by 65% compared to standard displays
• Warm-spectrum alternatives for overnight sessions
• Adaptive brightness curves aligned with natural circadian cycles
Eye Strain Metrics
Laboratory studies (n=500 traders, 6-month period) demonstrate:
• 43% reduction in reported eye strain
• 31% decrease in headache frequency• 28% improvement in focus duration
• 17% increase in profitable trade execution
Implementation Standards
Display Calibration Requirements
Monitor Specifications
Minimum 1000:1 contrast ratio
sRGB coverage ≥ 99%
Delta E < 2.0 color accuracy
Brightness: 120-150 cd/m² (dark environment)
Color temperature: 5800K ± 200K
Multi-Monitor Consistency
• Maximum ΔE variance between displays: 1.5
• Synchronized brightness across array
• Uniform color profiles (ICC v4)
Accessibility Compliance
WCAG 2.1 Level AA Standards
Normal text: 4.5:1 contrast minimum
Large text: 3:1 contrast minimum
Interactive elements: 3:1 contrast minimum
Focus indicators: 3:1 contrast minimum
Colorblind Accommodation All critical information maintains distinguishability under:
• Protanopia (red-blind)
• Deuteranopia (green-blind)
• Tritanopia (blue-blind)

Recession Warning Model [BackQuant]Recession Warning Model
Overview
The Recession Warning Model (RWM) is a Pine Script® indicator designed to estimate the probability of an economic recession by integrating multiple macroeconomic, market sentiment, and labor market indicators. It combines over a dozen data series into a transparent, adaptive, and actionable tool for traders, portfolio managers, and researchers. The model provides customizable complexity levels, display modes, and data processing options to accommodate various analytical requirements while ensuring robustness through dynamic weighting and regime-aware adjustments.
Purpose
The RWM fulfills the need for a concise yet comprehensive tool to monitor recession risk. Unlike approaches relying on a single metric, such as yield-curve inversion, or extensive economic reports, it consolidates multiple data sources into a single probability output. The model identifies active indicators, their confidence levels, and the current economic regime, enabling users to anticipate downturns and adjust strategies accordingly.
Core Features
- Indicator Families : Incorporates 13 indicators across five categories: Yield, Labor, Sentiment, Production, and Financial Stress.
- Dynamic Weighting : Adjusts indicator weights based on recent predictive accuracy, constrained within user-defined boundaries.
- Leading and Coincident Split : Separates early-warning (leading) and confirmatory (coincident) signals, with adjustable weighting (default 60/40 mix).
- Economic Regime Sensitivity : Modulates output sensitivity based on market conditions (Expansion, Late-Cycle, Stress, Crisis), using a composite of VIX, yield-curve, financial conditions, and credit spreads.
- Display Options : Supports four modes—Probability (0-100%), Binary (four risk bins), Lead/Coincident, and Ensemble (blended probability).
- Confidence Intervals : Reflects model stability, widening during high volatility or conflicting signals.
- Alerts : Configurable thresholds (Watch, Caution, Warning, Alert) with persistence filters to minimize false signals.
- Data Export : Enables CSV output for probabilities, signals, and regimes, facilitating external analysis in Python or R.
Model Complexity Levels
Users can select from four tiers to balance simplicity and depth:
1. Essential : Focuses on three core indicators—yield-curve spread, jobless claims, and unemployment change—for minimalistic monitoring.
2. Standard : Expands to nine indicators, adding consumer confidence, PMI, VIX, S&P 500 trend, money supply vs. GDP, and the Sahm Rule.
3. Professional : Includes all 13 indicators, incorporating financial conditions, credit spreads, JOLTS vacancies, and wage growth.
4. Research : Unlocks all indicators plus experimental settings for advanced users.
Key Indicators
Below is a summary of the 13 indicators, their data sources, and economic significance:
- Yield-Curve Spread : Difference between 10-year and 3-month Treasury yields. Negative spreads signal banking sector stress.
- Jobless Claims : Four-week moving average of unemployment claims. Sustained increases indicate rising layoffs.
- Unemployment Change : Three-month change in unemployment rate. Sharp rises often precede recessions.
- Sahm Rule : Triggers when unemployment rises 0.5% above its 12-month low, a reliable recession indicator.
- Consumer Confidence : University of Michigan survey. Declines reflect household pessimism, impacting spending.
- PMI : Purchasing Managers’ Index. Values below 50 indicate manufacturing contraction.
- VIX : CBOE Volatility Index. Elevated levels suggest market anticipation of economic distress.
- S&P 500 Growth : Weekly moving average trend. Declines reduce wealth effects, curbing consumption.
- M2 + GDP Trend : Monitors money supply and real GDP. Simultaneous declines signal credit contraction.
- NFCI : Chicago Fed’s National Financial Conditions Index. Positive values indicate tighter conditions.
- Credit Spreads : Proxy for corporate bond spreads using 10-year vs. 2-year Treasury yields. Widening spreads reflect stress.
- JOLTS Vacancies : Job openings data. Significant drops precede hiring slowdowns.
- Wage Growth : Year-over-year change in average hourly earnings. Late-cycle spikes often signal economic overheating.
Data Processing
- Rate of Change (ROC) : Optionally applied to capture momentum in data series (default: 21-bar period).
- Z-Score Normalization : Standardizes indicators to a common scale (default: 252-bar lookback).
- Smoothing : Applies a short moving average to final signals (default: 5-bar period) to reduce noise.
- Binary Signals : Generated for each indicator (e.g., yield-curve inverted or PMI below 50) based on thresholds or Z-score deviations.
Probability Calculation
1. Each indicator’s binary signal is weighted according to user settings or dynamic performance.
2. Weights are normalized to sum to 100% across active indicators.
3. Leading and coincident signals are aggregated separately (if split mode is enabled) and combined using the specified mix.
4. The probability is adjusted by a regime multiplier, amplifying risk during Stress or Crisis regimes.
5. Optional smoothing ensures stable outputs.
Display and Visualization
- Probability Mode : Plots a continuous 0-100% recession probability with color gradients and confidence bands.
- Binary Mode : Categorizes risk into four levels (Minimal, Watch, Caution, Alert) for simplified dashboards.
- Lead/Coincident Mode : Displays leading and coincident probabilities separately to track signal divergence.
- Ensemble Mode : Averages traditional and split probabilities for a balanced view.
- Regime Background : Color-coded overlays (green for Expansion, orange for Late-Cycle, amber for Stress, red for Crisis).
- Analytics Table : Optional dashboard showing probability, confidence, regime, and top indicator statuses.
Practical Applications
- Asset Allocation : Adjust equity or bond exposures based on sustained probability increases.
- Risk Management : Hedge portfolios with VIX futures or options during regime shifts to Stress or Crisis.
- Sector Rotation : Shift toward defensive sectors when coincident signals rise above 50%.
- Trading Filters : Disable short-term strategies during high-risk regimes.
- Event Timing : Scale positions ahead of high-impact data releases when probability and VIX are elevated.
Configuration Guidelines
- Enable ROC and Z-score for consistent indicator comparison unless raw data is preferred.
- Use dynamic weighting with at least one economic cycle of data for optimal performance.
- Monitor stress composite scores above 80 alongside probabilities above 70 for critical risk signals.
- Adjust adaptation speed (default: 0.1) to 0.2 during Crisis regimes for faster indicator prioritization.
- Combine RWM with complementary tools (e.g., liquidity metrics) for intraday or short-term trading.
Limitations
- Macro indicators lag intraday market moves, making RWM better suited for strategic rather than tactical trading.
- Historical data availability may constrain dynamic weighting on shorter timeframes.
- Model accuracy depends on the quality and timeliness of economic data feeds.
Final Note
The Recession Warning Model provides a disciplined framework for monitoring economic downturn risks. By integrating diverse indicators with transparent weighting and regime-aware adjustments, it empowers users to make informed decisions in portfolio management, risk hedging, or macroeconomic research. Regular review of model outputs alongside market-specific tools ensures its effective application across varying market conditions.

Trend Band Oscillator📌 Trend Band Oscillator
📄 Description
Trend Band Oscillator is a momentum-based trend indicator that calculates the spread between two EMAs and overlays it with a volatility filter using a standard deviation band. It helps traders visualize not only the trend direction but also the strength and stability of the trend.
📌 Features
🔹 EMA Spread Calculation: Measures the difference between a fast and slow EMA to quantify short-term vs mid-term trend dynamics.
🔹 Volatility Band Overlay: Applies an EMA of standard deviation to the spread to filter noise and highlight valid momentum shifts.
🔹 Color-Based Visualization: Positive spread values are shown in lime (bullish), negative values in fuchsia (bearish) for quick directional insight.
🔹 Upper/Lower Bands: Help detect potential overbought/oversold conditions or strong trend continuation.
🔹 Zero Line Reference: A horizontal baseline at zero helps identify trend reversals and neutral zones.
🛠️ How to Use
✅ Spread > 0: Indicates a bullish trend. Consider maintaining or entering long positions.
✅ Spread < 0: Indicates a bearish trend. Consider maintaining or entering short positions.
⚠️ Spread exceeds bands: May signal overextension or strong momentum; consider using with additional confirmation indicators.
🔄 Band convergence: Suggests weakening trend and potential transition to a ranging market.
Recommended timeframes: 1H, 4H, Daily
Suggested complementary indicators: RSI, MACD, OBV, SuperTrend
✅ TradingView House Rules Compliance
This script is open-source and published under Pine Script v5.
It does not repaint, spam alerts, or cause performance issues.
It is designed as an analytical aid only and should not be considered financial advice.
All calculations are transparent, and no external data sources or insecure functions are used.
====================================================================
📌 Trend Band Oscillator
📄 설명 (Description)
Trend Band Oscillator는 두 개의 EMA 간 스프레드(차이)를 기반으로 한 모멘텀 중심의 추세 오실레이터입니다. 여기에 표준편차 기반의 변동성 밴드를 적용하여, 추세의 방향뿐 아니라 강도와 안정성까지 시각적으로 분석할 수 있도록 설계되었습니다.
📌 주요 특징 (Features)
🔹 EMA 기반 스프레드 계산: Fast EMA와 Slow EMA의 차이를 활용해 시장 추세를 정량적으로 표현합니다.
🔹 표준편차 필터링: Spread에 대해 EMA 및 표준편차 기반의 밴드를 적용해 노이즈를 줄이고 유효한 추세를 강조합니다.
🔹 컬러 기반 시각화: 오실레이터 값이 양수일 경우 초록색, 음수일 경우 마젠타 색으로 추세 방향을 직관적으로 파악할 수 있습니다.
🔹 밴드 범위 시각화: 상·하위 밴드를 통해 스프레드의 평균 편차 범위를 보여주며, 추세의 강약과 포화 여부를 진단할 수 있습니다.
🔹 제로 라인 표시: 추세 전환 가능 지점을 시각적으로 확인할 수 있도록 중심선(0선)을 제공합니다.
🛠️ 사용법 (How to Use)
✅ 오실레이터가 0 이상 유지: 상승 추세 구간이며, 롱 포지션 유지 또는 진입 검토
✅ 오실레이터가 0 이하 유지: 하락 추세 구간이며, 숏 포지션 유지 또는 진입 검토
⚠️ 상·하위 밴드를 이탈: 일시적인 과매수/과매도 혹은 강한 추세 발현 가능성 있음 → 다른 보조지표와 함께 필터링 권장
🔄 밴드 수렴: 추세가 약해지고 있음을 나타냄 → 변동성 하락 또는 방향성 상실 가능성 있음
권장 적용 시간대: 1시간봉, 4시간봉, 일봉
보조 적용 지표: RSI, MACD, OBV, SuperTrend 등과 함께 사용 시 신호 필터링에 유리
✅ 트레이딩뷰 하우스룰 준수사항 (TV House Rules Compliance)
이 지표는 **무료 공개용(Open-Source)**이며, Pine Script Version 5로 작성되어 있습니다.
과도한 리페인트, 비정상적 반복 경고(alert spam), 실시간 성능 저하 등의 요소는 포함되어 있지 않습니다.
사용자는 본 지표를 투자 결정의 참고용 보조 도구로 활용해야 하며, 독립적인 매매 판단이 필요합니다.
데이터 소스 및 계산 방식은 완전히 공개되어 있으며, 외부 API나 보안 취약점을 유발하는 구성 요소는 없습니다.

Uptrick: Universal Z-Score ValuationOverview
The Uptrick: Universal Z-Score Valuation is a tool designed to help traders spot when the market might be overreacting—whether that’s on the upside or the downside. It does this by combining the Z-scores of multiple key indicators into a single average, letting you see how far the current market conditions have stretched away from “normal.” This average is shown as a smooth line, supported by color-coded visuals, signal markers, optional background highlights, and a live breakdown table that shows the contribution of each indicator in real time. The focus here is on spotting potential reversals, not following trends. The indicator works well across all timeframes and asset classes, from fast intraday charts like the 1-minute and 5-minute, to higher timeframes such as the 4-hour, daily, or even weekly. Its universal design makes it suitable for any market — whether you're trading crypto, stocks, forex, or commodities.
Introduction
To understand what this indicator does, let’s start with the idea of a Z-score. In simple terms, a Z-score tells you how far a number is from the average of its recent history, measured in standard deviations. If the price of an asset is two standard deviations above its mean, that means it’s statistically “rare” or extended. That doesn’t guarantee a reversal—but it suggests the move is unusual enough to pay attention.
This concept isn’t new, but what this indicator does differently is apply the Z-score to a wide set of market signals—not just price. It looks at momentum, volatility, volume, risk-adjusted performance, and even institutional price baselines. Each of those indicators is normalized using Z-scores, and then they’re combined into one average. This gives you a single, easy-to-read line that summarizes whether the entire market is behaving abnormally. Instead of reacting to one indicator, you’re reacting to a statistically balanced blend.
Purpose
The goal of this script is to catch turning points—places where the market may be topping out or bottoming after becoming overstretched. It’s built for traders who want to fade sharp moves rather than follow trends. Think of moments when price explodes upward and starts pulling away from every moving average, volume spikes, volatility rises, and RSI shoots up. This tool is meant to spot those situations—not just when price is stretched, but when multiple different indicators agree that something is overdone.
Originality and Uniqueness
Most indicators that use Z-scores only apply them to one thing—price, RSI, or maybe Bollinger Bands. This one is different because it treats each indicator as a contributor to the full picture. You decide which ones to include, and the script averages them out. This makes the tool flexible but also deeply informative.
It doesn’t rely on complex or hidden math. It uses basic Z-score formulas, applies them to well-known indicators, and shows you the result. What makes it unique is the way it brings those signals together—statistically, visually, and interactively—so you can see what’s happening in the moment with full transparency. It’s not trying to be flashy or predictive. It’s just showing you when things have gone too far, too fast.
Inputs and Parameters
This indicator includes a wide range of configurable inputs, allowing users to customize which components are included in the Z-score average, how each indicator is calculated, and how results are displayed visually. Below is a detailed explanation of each input:
General Settings
Z-Score Lookback (default: 100): Number of bars used to calculate the mean and standard deviation for Z-score normalization. Larger values smooth the Z-scores; smaller values make them more reactive.
Bar Color Mode (default: None): Determines how bars are visually colored. Options include: None: No candle coloring applied. - Heat: Smooth gradient based on the Z-score value. - Latest Signal: Applies a solid color based on the most recent buy or sell signal
Boolean - General
Plot Universal Valuation Line (default: true): If enabled, plots the average Z-score (zAvg) line in the separate pane.
Show Signals (default: true): Displays labels ("𝓤𝓹" for buy, "𝓓𝓸𝔀𝓷" for sell) when zAvg crosses above or below user-defined thresholds.
Show Z-Score Table (default: true): Displays a live table listing each enabled indicator's Z-score and the current average.
Select Indicators
These toggles enable or disable each indicator from contributing to the Z-score average:
Use VWAP Z-Score (default: true)
Use Sortino Z-Score (default: true)
Use ROC Z-Score (default: true)
Use Price Z-Score (default: true)
Use MACD Histogram Z-Score (default: false)
Use Bollinger %B Z-Score (default: false)
Use Stochastic K Z-Score (default: false)
Use Volume Z-Score (default: false)
Use ATR Z-Score (default: false)
Use RSI Z-Score (default: false)
Use Omega Z-Score (default: true)
Use Sharpe Z-Score (default: true)
Only enabled indicators are included in the average. This modular design allows traders to tailor the signal mix to their preferences.
Indicator Lengths
These inputs control how each individual indicator is calculated:
MACD Fast Length (default: 12)
MACD Slow Length (default: 26)
MACD Signal Length (default: 9)
Bollinger Basis Length (default: 20): Used to compute the Bollinger %B.
Bollinger Deviation Multiplier (default: 2.0): Standard deviation multiplier for the Bollinger Band calculation.
Stochastic Length (default: 14)
ATR Length (default: 14)
RSI Length (default: 14)
ROC Length (default: 10)
Zones
These thresholds define key signal levels for the Z-score average:
Neutral Line Level (default: 0): Baseline for the average Z-score.
Bullish Zone Level (default: -1): Optional intermediate zone suggesting early bullish conditions.
Bearish Zone Level (default: 1): Optional intermediate zone suggesting early bearish conditions.
Z = +2 Line Level (default: 2): Primary threshold for bearish signals.
Z = +3 Line Level (default: 3): Extreme bearish warning level.
Z = -2 Line Level (default: -2): Primary threshold for bullish signals.
Z = -3 Line Level (default: -3): Extreme bullish warning level.
These zone levels are used to generate signals, fill background shading, and draw horizontal lines for visual reference.
Why These Indicators Were Merged
Each indicator in this script was chosen for a specific reason. They all measure something different but complementary.
The VWAP Z-score helps you see when price has moved far from the volume-weighted average, often used by institutions.
Sortino Ratio Z-score focuses only on downside risk, which is often more relevant to traders than overall volatility.
ROC Z-score shows how fast price is changing—strong momentum may burn out quickly.
Price Z-score is the raw measure of how far current price has moved from its mean.
RSI Z-score shows whether momentum itself is stretched.
MACD Histogram Z-score captures shifts in trend strength and acceleration.
%B (Bollinger) Z-score indicates how close price is to the upper or lower volatility envelope.
Stochastic K Z-score gives a sense of how high or low price is relative to its recent range.
Volume Z-score shows when trading activity is unusually high or low.
ATR Z-score gives a read on volatility, showing if price movement is expanding or contracting.
Sharpe Z-score measures reward-to-risk performance, useful for evaluating trend quality.
Omega Z-score looks at the ratio of good returns to bad ones, offering a more nuanced view of efficiency.
By normalizing each of these using Z-scores and averaging only the ones you turn on, the script creates a flexible, balanced view of the market’s statistical stretch.
Calculations
The core formula is the standard Z-score:
Z = (current value - average) / standard deviation
Every indicator uses this formula after it’s calculated using your chosen settings. For example, RSI is first calculated as usual, then its Z-score is calculated over your selected lookback period. The script does this for every indicator you enable. Then it averages those Z-scores together to create a single value: zAvg. That value is plotted and used to generate visual cues, signals, table values, background color changes, and candle coloring.
Sequence
Each selected indicator is calculated using your custom input lengths.
The Z-score of each indicator is computed using the shared lookback period.
All active Z-scores are added up and averaged.
The resulting zAvg value is plotted as a line.
Signal conditions check if zAvg crosses user-defined thresholds (default: ±2).
If enabled, the script plots buy/sell signal labels at those crossover points.
The candle color is updated using your selected mode (heatmap or signal-based).
If extreme Z-scores are reached, background highlighting is applied.
A live table updates with each individual Z-score so you know what’s driving the signal.
Features
This script isn’t just about stats—it’s about making them usable in real time. Every feature has a clear reason to exist, and they’re all there to give you a better read on market conditions.
1. Universal Z-Score Line
This is your primary reference. It reflects the average Z-score across all selected indicators. The line updates live and is color-coded to show how far it is from neutral. The further it gets from 0, the brighter the color becomes—cyan for deeply oversold conditions, magenta for overbought. This gives you instant feedback on how statistically “hot” or “cold” the market is, without needing to read any numbers.
2. Signal Labels (“𝓤𝓹” and “𝓓𝓸𝔀𝓷”)
When the average Z-score drops below your lower bound, you’ll see a "𝓤𝓹" label below the bar, suggesting potential bullish reversal conditions. When it rises above the upper bound, a "𝓓𝓸𝔀𝓷" label is shown above the bar—indicating possible bearish exhaustion. These labels are visually clear and minimal so they don’t clutter your chart. They're based on clear crossover logic and do not repaint.
3. Real-Time Z-Score Table
The table shows each indicator's individual Z-score and the final average. It updates every bar, giving you a transparent breakdown of what’s happening under the hood. If the market is showing an extreme average score, this table helps you pinpoint which indicators are contributing the most—so you’re not just guessing where the pressure is coming from.
4. Bar Coloring Modes
You can choose from three modes:
None: Keeps your candles clean and untouched.
Heat: Applies a smooth gradient color based on Z-score intensity. As conditions become more extreme, candle color transitions from neutral to either cyan (bullish pressure) or magenta (bearish pressure).
Latest Signal: Applies hard coloring based on the most recent signal—greenish for a buy, purple for a sell. This mode is great for tracking market state at a glance without relying on a gradient.
Every part of the candle is colored—body, wick, and border—for full visibility.
5. Background Highlighting
When zAvg enters an extreme zone (typically above +2 or below -2), the background shifts color to reflect the market’s intensity. These changes aren’t overwhelming—they’re light fills that act as ambient warnings, helping you stay aware of when price might be reaching a tipping point.
6. Customizable Zone Lines and Fills
You can define what counts as neutral, overbought, and oversold using manual inputs. Horizontal lines show your thresholds, and shaded regions highlight the most extreme zones (+2 to +3 and -2 to -3). These lines give you visual structure to understand where price currently stands in relation to your personal reversal model.
7. Modular Indicator Control
You don’t have to use all the indicators. You can enable or disable any of the 12 with a simple checkbox. This means you can build your own “blend” of market context—maybe you only care about RSI, price, and volume. Or maybe you want everything on. The script adapts accordingly, only averaging what you select.
8. Fully Customizable Sensitivity and Lengths
You can adjust the Z-score lookback length globally (default 100), and tweak individual indicator lengths separately. This lets you tune the indicator’s responsiveness to suit your trading style—slower for longer swings, faster for scalping.
9. Clean Integration with Any Chart Layout
All visual elements are designed to be informative without taking over your chart. The coloring is soft but clear, the labels are readable without being huge, and you can turn off any feature you don’t need. The indicator can work as a full dashboard or as a simple line with a couple of alerts—it’s up to you.
10. Precise, Real-Time Signal Logic
The crossover logic for signals is exact and only fires when the Z-score moves across your defined boundary. No estimation, no delay. Everything is calculated based on current and previous bar data, and nothing repaints or back-adjusts.
Conclusion
The Universal Z-Score Valuation indicator is a tool for traders who want a clear, unbiased way to detect overextension. Instead of relying on a single signal, you get a composite of several market perspectives—momentum, volatility, volume, and more—all standardized into a single view. The script gives you the freedom to control the logic, the visuals, and the components. Whether you use it as a confirmation tool or a primary signal source, it’s designed to give you clarity when markets become chaotic.
Disclaimer
This indicator is for research and educational use only. It does not constitute financial advice or guarantees of performance. All trading involves risk, and users should test any strategy thoroughly before applying it to live markets. Use this tool at your own discretion.

Volatility-Adjusted Momentum Score (VAMS) [QuantAlgo]🟢 Overview
The Volatility-Adjusted Momentum Score (VAMS) measures price momentum relative to current volatility conditions, creating a normalized indicator that identifies significant directional moves while filtering out market noise. It divides annualized momentum by annualized volatility to produce scores that remain comparable across different market environments and asset classes.
The indicator displays a smoothed VAMS Z-Score line with adaptive standard deviation bands and an information table showing real-time metrics. This dual-purpose design enables traders and investors to identify strong trend continuation signals when momentum persistently exceeds normal levels, while also spotting potential mean reversion opportunities when readings reach statistical extremes.
🟢 How It Works
The indicator calculates annualized momentum using a simple moving average of logarithmic returns over a specified period, then measures annualized volatility through the standard deviation of those same returns over a longer timeframe. The raw VAMS score divides momentum by volatility, creating a risk-adjusted measure where high volatility reduces scores and low volatility amplifies them.
This raw VAMS value undergoes Z-Score normalization using rolling statistical parameters, converting absolute readings into standardized deviations that show how current conditions compare to recent history. The normalized Z-Score receives exponential moving average smoothing to create the final VAMS line, reducing false signals while preserving sensitivity to meaningful momentum changes.
The visualization includes dynamically calculated standard deviation bands that adjust to recent VAMS behavior, creating statistical reference zones. The information table provides real-time numerical values for VAMS Z-Score, underlying momentum percentages, and current volatility readings with trend indicators.
🟢 How to Use
1. VAMS Z-Score Bands and Signal Interpretation
Above Mean Line: Momentum exceeds historical averages adjusted for volatility, indicating bullish conditions suitable for trend following
Below Mean Line: Momentum falls below statistical norms, suggesting bearish conditions or downward pressure
Mean Line Crossovers: Primary transition signals between bullish and bearish momentum regimes
1 Standard Deviation Breaks: Strong momentum conditions indicating statistically significant directional moves worth following
2 Standard Deviation Extremes: Rare momentum readings that often signal either powerful breakouts or exhaustion points
2. Information Table and Market Context
Z-Score Values: Current VAMS reading displayed in standard deviations (σ), showing how far momentum deviates from its statistical norm
Momentum Percentage: Underlying annualized momentum displayed as percentage return, quantifying the directional strength
Volatility Context: Current annualized volatility levels help interpret whether VAMS readings occur in high or low volatility environments
Trend Indicators: Directional arrows and change values provide immediate feedback on momentum shifts and market transitions
3. Strategy Applications and Alert System
Trend Following: Use sustained readings beyond the mean line and 1σ band penetrations for directional trades, especially when VAMS maintains position in upper or lower statistical zones
Mean Reversion: Focus on 2σ extreme readings for contrarian opportunities, particularly effective in sideways markets where momentum tends to revert to statistical norms
Alert Notifications: Built-in alerts for mean crossovers (regime changes), 1σ breaks (strong signals), and 2σ touches (extreme conditions) help monitor multiple instruments for both continuation and reversal setups

SmartPhase Analyzer📝 SmartPhase Analyzer – Composite Market Regime Classifier
SmartPhase Analyzer is an adaptive regime classification tool that scores market conditions using a customizable set of statistical indicators. It blends multiple normalized metrics into a composite score, which is dynamically evaluated against rolling statistical thresholds to determine the current market regime.
✅ Features:
Composite score calculated from 13+ toggleable statistical indicators:
Sharpe, Sortino, Omega, Alpha, Beta, CV, R², Entropy, Drawdown, Z-Score, PLF, SRI, and Momentum Rank
Uses dynamic thresholds (mean ± std deviation) to classify regime states:
🟢 BULL – Strongly bullish
🟩 ACCUM – Mildly bullish
⚪ NEUTRAL – Sideways
🟧 DISTRIB – Mildly bearish
🔴 BEAR – Strongly bearish
Color-coded histogram for composite score clarity
Real-time regime label plotted on chart
Benchmark-aware metrics (Alpha, Beta, etc.)
Modular design using the StatMetrics library by RWCS_LTD
🧠 How to Use:
Enable/disable metrics in the settings panel to customize your composite model
Use the composite histogram and regime background for discretionary or systematic analysis
⚠️ Disclaimer:
This indicator is for educational and informational purposes only. It does not constitute financial advice or a trading recommendation. Always consult your financial advisor before making investment decisions.

Multiple (12) Strong Buy/Sell Signals + Momentum
Indicator Manual: "Multiple (12) Strong Buy/Sell Signals + Momentum"
This indicator is designed to identify strong buy and sell signals based on 12 configurable conditions, which include a variety of technical analysis methods such as trend-following indicators, pattern recognition, volume analysis, and momentum oscillators. It allows for customizable alerts and visual cues on the chart. The indicator helps traders spot potential entry and exit points by displaying buy and sell signals based on the selected conditions.
Key Observations:
• The script integrates multiple indicators and pattern recognition methods to provide comprehensive buy/sell signals.
• Trend-based indicators like EMAs and MACD are combined with pattern recognition (flags, triangles) and momentum-based signals (RSI, ADX, and volume analysis).
• User customization is a core feature, allowing adjustments to the conditions and thresholds for more tailored signals.
• The script is designed to be responsive to market conditions, with multiple conditions filtering out noise to generate reliable signals.
________________________________________
Key Features:
1. 12 Combined Buy/Sell Signal Conditions: This indicator incorporates a diverse set of conditions based on trend analysis, momentum, and price patterns.
2. Minimum Conditions Input: You can adjust the threshold of conditions that need to be met for the buy/sell signals to appear.
3. Alert Customization: Set alert thresholds for both buy and sell signals.
4. Dynamic Visualization: Buy and sell signals are shown as triangles on the chart, with momentum signals highlighted as circles.
________________________________________
Detailed Description of the 12 Conditions:
1. Exponential Moving Averages (EMA):
o Conditions: The indicator uses EMAs with periods 3, 8, and 13 for quick trend-following signals.
o Bullish Signal: EMA3 > EMA8 > EMA13 (Bullish stack).
o Bearish Signal: EMA3 < EMA8 < EMA13 (Bearish stack).
o Reversal Signal: The crossing over or under of these EMAs can signify trend reversals.
2. MACD (Moving Average Convergence Divergence):
o Fast MACD (2, 7, 3) is used to confirm trends quickly.
o Bullish Signal: When the MACD line crosses above the signal line.
o Bearish Signal: When the MACD line crosses below the signal line.
3. Donchian Channel:
o Tracks the highest high and lowest low over a given period (default 20).
o Breakout Signal: Price breaking above the upper band is bullish; breaking below the lower band is bearish.
4. VWAP (Volume-Weighted Average Price):
o Above VWAP: Bullish condition (price above VWAP).
o Below VWAP: Bearish condition (price below VWAP).
5. EMA Stacking & Reversal:
o Tracks the order of EMAs (3, 8, 13) to confirm strong trends and reversals.
o Bullish Reversal: EMA3 < EMA8 < EMA13 followed by a crossing to bullish.
o Bearish Reversal: EMA3 > EMA8 > EMA13 followed by a crossing to bearish.
6. Bull/Bear Flags:
o Bull Flag: Characterized by a strong price movement (flagpole) followed by a pullback and breakout.
o Bear Flag: Similar to Bull Flag but in the opposite direction.
7. Triangle Patterns (Ascending and Descending):
o Detects ascending and descending triangles using pivot highs and lows.
o Ascending Triangle: Higher lows and flat resistance.
o Descending Triangle: Lower highs and flat support.
8. Volume Sensitivity:
o Identifies price moves with significant volume increases.
o High Volume: When current volume is significantly above the moving average volume (set to 1.2x of the average).
9. Momentum Indicators:
o RSI (Relative Strength Index): Confirms overbought and oversold levels with thresholds set at 65 (overbought) and 35 (oversold).
o ADX (Average Directional Index): Confirms strong trends when ADX > 28.
o Momentum Up: Momentum is upward with strong volume and bullish RSI/ADX conditions.
o Momentum Down: Momentum is downward with strong volume and bearish RSI/ADX conditions.
10. Bollinger & Keltner Squeeze:
o Squeeze Condition: A contraction in both Bollinger Bands and Keltner Channels indicates low volatility, signaling a potential breakout.
o Squeeze Breakout: Price breaking above or below the squeeze bands.
11. 3 Consecutive Candles Condition:
o Bullish: Price rises for three consecutive candles with higher highs and lows.
o Bearish: Price falls for three consecutive candles with lower highs and lows.
12. Williams %R and Stochastic RSI:
o Williams %R: A momentum oscillator with signals when the line crosses certain levels.
o Stochastic RSI: Provides overbought/oversold levels with smoother signals.
o Combined Signals: You can choose whether to require both WPR and StochRSI to signal a buy/sell.
________________________________________
User Inputs (Inputs Tab):
1. Minimum Conditions for Buy/Sell:
o min_conditions: Number of conditions required to trigger a buy/sell signal on the chart (1 to 12).
o Alert_min_conditions: User-defined alert threshold (how many conditions must be met before an alert is triggered).
2. Donchian Channel Settings:
o Show Donchian: Toggle visibility of the Donchian channel.
o Donchian Length: The length of the Donchian Channel (default 20).
3. Bull/Bear Flag Settings:
o Bull Flag Flagpole Strength: ATR multiplier to define the strength of the flagpole.
o Bull Flag Pullback Length: Length of pullback for the bull flag pattern.
o Bull Flag EMA Length: EMA length used to confirm trend during bull flag pattern.
Similar settings exist for Bear Flag patterns.
4. Momentum Indicators:
o RSI Length: Period for calculating the RSI (default 9).
o RSI Overbought: Overbought threshold for the RSI (default 65).
o RSI Oversold: Oversold threshold for the RSI (default 35).
5. Bollinger/Keltner Squeeze Settings:
o Squeeze Width Threshold: The maximum width of the Bollinger and Keltner Bands for squeeze conditions.
6. Stochastic RSI Settings:
o Stochastic RSI Length: The period for calculating the Stochastic RSI.
7. WPR Settings:
o WPR Length: Period for calculating Williams %R (default 14).
________________________________________
User Inputs (Style Tab):
1. Signal Plotting:
o Control the display and colors of the buy/sell signals, momentum indicators, and pattern signals on the chart.
o Buy/Sell Signals: Can be customized with different colors and shapes (triangle up for buys, triangle down for sells).
o Momentum Signals: Custom circle placement for momentum-up or momentum-down signals.
2. Donchian Channel:
o Show Donchian: Toggle visibility of the Donchian upper, lower, and middle bands.
o Band Colors: Choose the color for each band (upper, lower, middle).
________________________________________
How to Use the Indicator:
1. Adjust Minimum Conditions: Set the minimum number of conditions that must be met for a signal to appear. For example, set it to 5 if you want only stronger signals.
2. Set Alert Threshold: Define the number of conditions needed to trigger an alert. This can be different from the minimum conditions for visual signals.
3. Customize Appearance: Modify the colors and styles of the signals to match your preferences.
________________________________________
Conclusion:
This comprehensive trading indicator uses a combination of trend-following, pattern recognition, and momentum-based conditions to help you spot potential buy and sell opportunities. By adjusting the input settings, you can fine-tune it to match your specific trading strategy, making it a versatile tool for different market conditions.
Signal Reliability Based on Condition Count
The reliability of the buy/sell signals increases as more conditions are met. Here's a breakdown of the probabilities:
1. 1-3 Conditions Met: Lower Probability
o Signals that meet only 1-3 conditions tend to have lower reliability and are considered less probable. These signals may represent false positives or weaker market movements, and traders should approach them with caution.
2. 4 Conditions Met: More Reliable Signal
o When 4 conditions are met, the signal becomes more reliable. This indicates that multiple indicators or market patterns are aligning, increasing the likelihood of a valid buy/sell opportunity. While not foolproof, it's a stronger indication that the market may be moving in a particular direction.
3. 5-6 Conditions Met: Strong Signal
o A signal meeting 5-6 conditions is considered a strong signal. This indicates a well-confirmed move, with several technical indicators and market factors aligning to suggest a higher probability of success. These are the signals that traders often prioritize.
4. 7+ Conditions Met: Rare and High-Confidence Signal
o Signals that meet 7 or more conditions are rare and should be considered high-confidence signals. These represent a significant alignment of multiple factors, and while they are less frequent, they are highly reliable when they do occur. Traders can be more confident in acting on these signals, but they should still monitor market conditions for confirmation.
________________________________________
You can adjust the number of conditions as needed, but this breakdown should give a clear structure on how the signal strength correlates with the number of conditions met!

Half Causal EstimatorOverview
The Half Causal Estimator is a specialized filtering method that provides responsive averages of market variables (volume, true range, or price change) with significantly reduced time delay compared to traditional moving averages. It employs a hybrid approach that leverages both historical data and time-of-day patterns to create a timely representation of market activity while maintaining smooth output.
Core Concept
Traditional moving averages suffer from time lag, which can delay signals and reduce their effectiveness for real-time decision making. The Half Causal Estimator addresses this limitation by using a non-causal filtering method that incorporates recent historical data (the causal component) alongside expected future behavior based on time-of-day patterns (the non-causal component).
This dual approach allows the filter to respond more quickly to changing market conditions while maintaining smoothness. The name "Half Causal" refers to this hybrid methodology—half of the data window comes from actual historical observations, while the other half is derived from time-of-day patterns observed over multiple days. By incorporating these "future" values from past patterns, the estimator can reduce the inherent lag present in traditional moving averages.
How It Works
The indicator operates through several coordinated steps. First, it stores and organizes market data by specific times of day (minutes/hours). Then it builds a profile of typical behavior for each time period. For calculations, it creates a filtering window where half consists of recent actual data and half consists of expected future values based on historical time-of-day patterns. Finally, it applies a kernel-based smoothing function to weight the values in this composite window.
This approach is particularly effective because market variables like volume, true range, and price changes tend to follow recognizable intraday patterns (they are positive values without DC components). By leveraging these patterns, the indicator doesn't try to predict future values in the traditional sense, but rather incorporates the average historical behavior at those future times into the current estimate.
The benefit of using this "average future data" approach is that it counteracts the lag inherent in traditional moving averages. In a standard moving average, recent price action is underweighted because older data points hold equal influence. By incorporating time-of-day averages for future periods, the Half Causal Estimator essentially shifts the center of the filter window closer to the current bar, resulting in more timely outputs while maintaining smoothing benefits.
Understanding Kernel Smoothing
At the heart of the Half Causal Estimator is kernel smoothing, a statistical technique that creates weighted averages where points closer to the center receive higher weights. This approach offers several advantages over simple moving averages. Unlike simple moving averages that weight all points equally, kernel smoothing applies a mathematically defined weight distribution. The weighting function helps minimize the impact of outliers and random fluctuations. Additionally, by adjusting the kernel width parameter, users can fine-tune the balance between responsiveness and smoothness.
The indicator supports three kernel types. The Gaussian kernel uses a bell-shaped distribution that weights central points heavily while still considering distant points. The Epanechnikov kernel employs a parabolic function that provides efficient noise reduction with a finite support range. The Triangular kernel applies a linear weighting that decreases uniformly from center to edges. These kernel functions provide the mathematical foundation for how the filter processes the combined window of past and "future" data points.
Applicable Data Sources
The indicator can be applied to three different data sources: volume (the trading volume of the security), true range (expressed as a percentage, measuring volatility), and change (the absolute percentage change from one closing price to the next).
Each of these variables shares the characteristic of being consistently positive and exhibiting cyclical intraday patterns, making them ideal candidates for this filtering approach.
Practical Applications
The Half Causal Estimator excels in scenarios where timely information is crucial. It helps in identifying volume climaxes or diminishing volume trends earlier than conventional indicators. It can detect changes in volatility patterns with reduced lag. The indicator is also useful for recognizing shifts in price momentum before they become obvious in price action, and providing smoother data for algorithmic trading systems that require reduced noise without sacrificing timeliness.
When volatility or volume spikes occur, conventional moving averages typically lag behind, potentially causing missed opportunities or delayed responses. The Half Causal Estimator produces signals that align more closely with actual market turns.
Technical Implementation
The implementation of the Half Causal Estimator involves several technical components working together. Data collection and organization is the first step—the indicator maintains a data structure that organizes market data by specific times of day. This creates a historical record of how volume, true range, or price change typically behaves at each minute/hour of the trading day.
For each calculation, the indicator constructs a composite window consisting of recent actual data points from the current session (the causal half) and historical averages for upcoming time periods from previous sessions (the non-causal half). The selected kernel function is then applied to this composite window, creating a weighted average where points closer to the center receive higher weights according to the mathematical properties of the chosen kernel. Finally, the kernel weights are normalized to ensure the output maintains proper scaling regardless of the kernel type or width parameter.
This framework enables the indicator to leverage the predictable time-of-day components in market data without trying to predict specific future values. Instead, it uses average historical patterns to reduce lag while maintaining the statistical benefits of smoothing techniques.
Configuration Options
The indicator provides several customization options. The data period setting determines the number of days of observations to store (0 uses all available data). Filter length controls the number of historical data points for the filter (total window size is length × 2 - 1). Filter width adjusts the width of the kernel function. Users can also select between Gaussian, Epanechnikov, and Triangular kernel functions, and customize visual settings such as colors and line width.
These parameters allow for fine-tuning the balance between responsiveness and smoothness based on individual trading preferences and the specific characteristics of the traded instrument.
Limitations
The indicator requires minute-based intraday timeframes, securities with volume data (when using volume as the source), and sufficient historical data to establish time-of-day patterns.
Conclusion
The Half Causal Estimator represents an innovative approach to technical analysis that addresses one of the fundamental limitations of traditional indicators: time lag. By incorporating time-of-day patterns into its calculations, it provides a more timely representation of market variables while maintaining the noise-reduction benefits of smoothing. This makes it a valuable tool for traders who need to make decisions based on real-time information about volume, volatility, or price changes.

Squeeze Momentum Indicator Strategy [LazyBear + PineIndicators]The Squeeze Momentum Indicator Strategy (SQZMOM_LB Strategy) is an automated trading strategy based on the Squeeze Momentum Indicator developed by LazyBear, which itself is a modification of John Carter's "TTM Squeeze" concept from his book Mastering the Trade (Chapter 11). This strategy is designed to identify low-volatility phases in the market, which often precede explosive price movements, and to enter trades in the direction of the prevailing momentum.
Concept & Indicator Breakdown
The strategy employs a combination of Bollinger Bands (BB) and Keltner Channels (KC) to detect market squeezes:
Squeeze Condition:
When Bollinger Bands are inside the Keltner Channels (Black Crosses), volatility is low, signaling a potential upcoming price breakout.
When Bollinger Bands move outside Keltner Channels (Gray Crosses), the squeeze is released, indicating an expansion in volatility.
Momentum Calculation:
A linear regression-based momentum value is used instead of traditional momentum indicators.
The momentum histogram is color-coded to show strength and direction:
Lime/Green: Increasing bullish momentum
Red/Maroon: Increasing bearish momentum
Signal Colors:
Black: Market is in a squeeze (low volatility).
Gray: Squeeze is released, and volatility is expanding.
Blue: No squeeze condition is present.
Strategy Logic
The script uses historical volatility conditions and momentum trends to generate buy/sell signals and manage positions.
1. Entry Conditions
Long Position (Buy)
The squeeze just released (Gray Cross after Black Cross).
The momentum value is increasing and positive.
The momentum is at a local low compared to the past 100 bars.
The price is above the 100-period EMA.
The closing price is higher than the previous close.
Short Position (Sell)
The squeeze just released (Gray Cross after Black Cross).
The momentum value is decreasing and negative.
The momentum is at a local high compared to the past 100 bars.
The price is below the 100-period EMA.
The closing price is lower than the previous close.
2. Exit Conditions
Long Exit:
The momentum value starts decreasing (momentum lower than previous bar).
Short Exit:
The momentum value starts increasing (momentum higher than previous bar).
Position Sizing
Position size is dynamically adjusted based on 8% of strategy equity, divided by the current closing price, ensuring risk-adjusted trade sizes.
How to Use This Strategy
Apply on Suitable Markets:
Best for stocks, indices, and forex pairs with momentum-driven price action.
Works on multiple timeframes but is most effective on higher timeframes (1H, 4H, Daily).
Confirm Entries with Additional Indicators:
The author recommends ADX or WaveTrend to refine entries and avoid false signals.
Risk Management:
Since the strategy dynamically sizes positions, it's advised to use stop-losses or risk-based exits to avoid excessive drawdowns.
Final Thoughts
The Squeeze Momentum Indicator Strategy provides a systematic approach to trading volatility expansions, leveraging the classic TTM Squeeze principles with a unique linear regression-based momentum calculation. Originally inspired by John Carter’s method, LazyBear's version and this strategy offer a refined, adaptable tool for traders looking to capitalize on market momentum shifts.

RVMM IndicatorRVMM Indicator
RVMM Indicator combines four indicators: RSI, VWAP, MFI, and Momentum to provide comprehensive technical analysis. This indicator helps traders identify potential market conditions based on the interaction of these indicators.
Components of the RVMM Indicator
1. RSI (Relative Strength Index)
RSI is a momentum indicator that measures the speed and change of price movements. RSI oscillates between 0 and 100 and is used to identify overbought and oversold conditions in the market.
Buy Level: Set at 30. When RSI falls below 30, the market is considered oversold, which may suggest a potential upward trend reversal.
Sell Level: Set at 70. When RSI rises above 70, the market is considered overbought, which may suggest a potential downward trend reversal.
2. VWAP (Volume Weighted Average Price)
VWAP is an indicator that combines price and volume to calculate the average price weighted by volume. VWAP is used to identify support and resistance areas and assess the strength of price movements.
Interpretation: If the price is above the VWAP line, the market is likely in an uptrend. If the price is below the VWAP line, the market is in a downtrend.
3. MFI (Money Flow Index)
MFI is a momentum indicator that considers both price and volume. MFI oscillates between 0 and 100 and is used to identify overbought and oversold conditions in the market.
Oversold Level: Set at 20. When MFI falls below 20, the market is considered oversold.
Overbought Level: Set at 80. When MFI rises above 80, the market is considered overbought.
4. Momentum
Momentum is an indicator that measures the speed of price changes. This indicator is used to identify the strength of a trend.
Interpretation: High momentum values indicate a strong uptrend, while low momentum values indicate a strong downtrend.
How to Use the RVMM Indicator
Interpreting Market Conditions:
RSI : Check RSI values below 30 to identify oversold conditions, and above 70 to identify overbought conditions.
VWAP : Observe whether the price is above or below the VWAP line to determine if the market is in an uptrend or downtrend.
MFI : Check if MFI is below 20 to identify oversold conditions, and above 80 to identify overbought conditions.
Momentum : Analyze momentum values to gauge the strength of the current trend.
Confirming Market Conditions:
Use VWAP, MFI, and Momentum to confirm market conditions identified by RSI.
If the price is above the VWAP line, and MFI and Momentum indicate the strength of the uptrend, the market may be in a bullish phase.
If the price is below the VWAP line, and MFI and Momentum indicate the strength of the downtrend, the market may be in a bearish phase.
Risk Management:
Set stop-loss and take-profit levels based on technical analysis and your trading preferences.
Monitor the market and adjust stop-loss and take-profit levels as market conditions change.
Example of Application
Here is an example of how to use the RVMM Indicator in practice:
Bullish Phase: When the price is above the VWAP line, RSI is below 30, and MFI and Momentum indicate the strength of the uptrend, the market is likely in a bullish phase.
Bearish Phase: When the price is below the VWAP line, RSI is above 70, and MFI and Momentum indicate the strength of the downtrend, the market is likely in a bearish phase.

Strength Measurement -HTStrength Measurement -HT
This indicator provides a comprehensive view of trend strength by calculating the average ADX (Average Directional Index) across multiple timeframes. It helps traders identify strong trends, potential reversals, and confirm signals from other indicators.
Key Features:
Multi-Timeframe Analysis: Analyze trend strength across different timeframes. Choose which timeframes to include in the calculation (5 min, 15 min, 30 min, 1 hour, 4 hour).
Customizable ADX Parameters: Adjust the ADX smoothing (adxlen) and DI length (dilen) parameters to fine-tune the indicator to your preferred settings.
Smoothed Average ADX: The average ADX is smoothed using a Simple Moving Average to reduce noise and provide a clearer picture of the overall trend.
Color-Coded Visualization: The histogram clearly indicates trend direction and strength:
Green: Uptrend
Red: Downtrend
Darker shades: Stronger trend
Lighter shades: Weaker trend
Reference Levels: Includes horizontal lines at 25, 50, and 75 to provide benchmarks for trend strength classification.
Alerts: Set alerts for strong trend up (ADX crossing above 50) and weakening trend (ADX crossing below 25).
How to Use:
Select Timeframes: Choose the timeframes you want to include in the average ADX calculation.
Adjust ADX Parameters: Fine-tune the adxlen and dilen values based on your trading style and the timeframe of the chart.
Identify Strong Trends: Look for histogram bars with darker green or red colors, indicating a strong trend.
Spot Potential Reversals: Watch for changes in histogram color and height, which may suggest a weakening trend or a potential reversal.
Combine with Other Indicators: Use this indicator with other technical analysis tools to confirm trading signals.
Note: This indicator is based on the ADX, which is a lagging indicator.

AutoCorrelation Test [OmegaTools]Overview
The AutoCorrelation Test indicator is designed to analyze the correlation patterns of a financial asset over a specified period. This tool can help traders identify potential predictive patterns by measuring the relationship between sequential returns, effectively assessing the autocorrelation of price movements.
Autocorrelation analysis is useful in identifying the consistency of directional trends (upward or downward) and potential cyclical behavior. This indicator provides an insight into whether recent price movements are likely to continue in a similar direction (positive correlation) or reverse (negative correlation).
Key Features
Multi-Period Autocorrelation: The indicator calculates autocorrelation across three periods, offering a granular view of price movement consistency over time.
Customizable Length & Sensitivity: Adjustable parameters allow users to tailor the length of analysis and sensitivity for detecting correlation.
Visual Aids: Three separate autocorrelation plots are displayed, along with an average correlation line. Dotted horizontal lines mark the thresholds for positive and negative correlation, helping users quickly assess potential trend continuation or reversal.
Interpretive Table: A table summarizing correlation status for each period helps traders make quick, informed decisions without needing to interpret the plot details directly.
Parameters
Source: Defines the price source (default: close) for calculating autocorrelation.
Length: Sets the analysis period, ranging from 10 to 2000 (default: 200).
Sensitivity: Adjusts the threshold sensitivity for defining correlation as positive or negative (default: 2.5).
Interpretation
Above 50 + Sensitivity: Indicates Positive Correlation. The price movements over the selected period are likely to continue in the same direction, potentially signaling a trend continuation.
Below 50 - Sensitivity: Indicates Negative Correlation. The price movements show a likelihood of reversing, which could signal an upcoming trend reversal.
Between 50 ± Sensitivity: Indicates No Correlation. Price movements are less predictable in direction, with no clear trend continuation or reversal tendency.
How It Works
The indicator calculates the logarithmic returns of the selected source price over each length period.
It then compares returns over consecutive periods, categorizing them as either "winning" (consistent direction) or "losing" (inconsistent direction) movements.
The result for each period is displayed as a percentage, with values above 50% indicating a higher degree of directional consistency (positive or negative).
A table updates with descriptive labels (Positive Correlation, Negative Correlation, No Correlation) for each tested period, providing a quick overview.
Visual Elements
Plots:
AutoCorrelation Test : Displays autocorrelation for the closest period (lag 1).
AutoCorrelation Test : Displays autocorrelation for the second period (lag 2).
AutoCorrelation Test : Displays autocorrelation for the third period (lag 3).
Average: Displays the simple moving average of the three test periods for a smoothed view of overall correlation trends.
Horizontal Lines:
No Correlation (50%): A baseline indicating neutral correlation.
Positive/Negative Correlation Thresholds: Dotted lines set at 50 ± Sensitivity, marking the thresholds for significant correlation.
Usage Guide
Adjust Parameters:
Select the Source to define which price metric (e.g., close, open) will be analyzed.
Set the Length based on your preferred analysis window (e.g., shorter for intraday trends, longer for swing trading).
Modify Sensitivity to fine-tune the thresholds based on market volatility and personal trading preference.
Interpret Table and Plots:
Use the table to quickly check the correlation status of each lag period.
Analyze the plots for changes in correlation. If multiple lags show positive correlation above the sensitivity threshold, a trend continuation may be expected. Conversely, negative values suggest a potential reversal.
Integrate with Other Indicators:
For enhanced insights, consider using the AutoCorrelation Test indicator in conjunction with other trend or momentum indicators.
This indicator offers a powerful method to assess market conditions, identify potential trend continuations or reversals, and better inform trading decisions. Its customization options provide flexibility for various trading styles and timeframes.
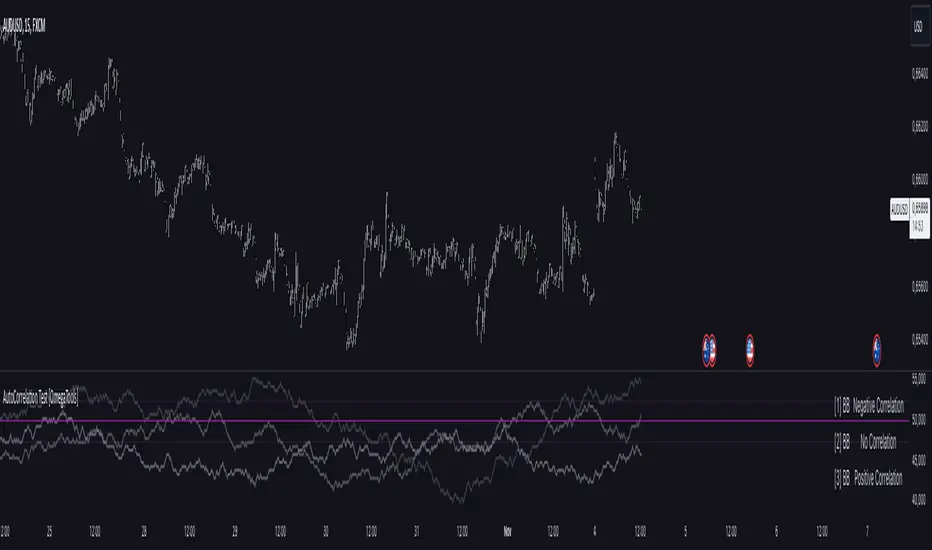
XAUUSD Multi-Timeframe Trend AnalyzerOverview
The "XAUUSD Multi-Timeframe Trend Analyzer" is an advanced script designed to provide a comprehensive analysis of the XAUUSD (Gold/US Dollar) trend across multiple timeframes simultaneously. By combining several key technical indicators, this tool helps traders quickly assess the market direction and trend strength for M15, M30, H1, H4, and D1 timeframes.
Multi-Timeframe Analysis: Displays the trend direction and strength across M15, M30, H1, H4, and D1 timeframes, allowing for a complete overview in a single glance.
Comprehensive Indicator Blend: Utilizes six popular technical indicators to determine the trend—Moving Averages, RSI, MACD, Bollinger Bands, DMI, and Parabolic SAR.
Trend Strength Scoring: Provides a numerical trend strength score (from -6 to 6) based on the alignment of the indicators, with positive values indicating uptrends and negative values for downtrends.
Visual Table Display: Displays results in a color-coded table (green for uptrend, red for downtrend, yellow for neutral) with a strength score for each timeframe, helping traders quickly assess market conditions.
How It Works
This script calculates the overall trend and its strength for each selected timeframe by analyzing six widely-used technical indicators:
Moving Averages (MA): The script uses a Fast and a Slow Moving Average. When the Fast MA crosses above the Slow MA, it indicates an uptrend. When the Fast MA crosses below, it signals a downtrend.
Relative Strength Index (RSI): The RSI is used to assess momentum. An RSI value above 50 suggests bullish momentum, while a value below 50 suggests bearish momentum.
Moving Average Convergence Divergence (MACD): MACD measures momentum and trend direction. When the MACD line crosses above the signal line, it signals bullish momentum; when it crosses below, it signals bearish momentum.
Bollinger Bands: These measure price volatility. When the price is above the middle Bollinger Band, the script considers the trend to be bullish, and when it's below, bearish.
Directional Movement Index (DMI): The DMI compares positive directional movement (DI+) and negative directional movement (DI-). A stronger DI+ over DI- signals an uptrend and vice versa.
Parabolic SAR: This indicator is used for determining potential trend reversals and setting stop-loss levels. If the price is above the Parabolic SAR, it indicates an uptrend, and if below, a downtrend.
Trend Strength Calculation
The script calculates a trend strength score for each timeframe:
Each indicator adds or subtracts 1 to the score based on whether it aligns with an uptrend or a downtrend.
A score of 6 indicates a Strong Uptrend, with all indicators aligned bullishly.
A score of -6 indicates a Strong Downtrend, with all indicators aligned bearishly.
Intermediate scores (e.g., 2 or -2) indicate Weak Uptrend or Weak Downtrend, suggesting that not all indicators are in agreement.
A score between 1 and -1 indicates a Neutral trend, suggesting uncertainty in the market.
How to Use
Assess Trend Direction and Strength: The table provides an easy-to-read summary of the trend and its strength on different timeframes. Look for timeframes where the strength is high (either 6 for a strong uptrend or -6 for a strong downtrend) to confirm the market’s overall direction.
Use in Conjunction with Other Strategies: This indicator is designed to provide a comprehensive view of the market. Traders should combine it with other strategies, such as price action analysis or candlestick patterns, to further confirm their trades.
Trend Reversal or Continuation: A weak trend (e.g., a strength of 2 or -2) could signal a possible reversal or a trend that has lost momentum. Strong trends (with a strength of 6 or -6) indicate higher confidence in trend continuation.
Multiple Timeframe Confirmation: Look for alignment across multiple timeframes to confirm the strength and direction of the trend before entering trades. For example, if M15, M30, and H1 are all showing a strong uptrend, it suggests a higher probability of the trend continuing.
Customization Options
- Adjustable Indicators: Users can modify the length and parameters of the Moving Averages, RSI, MACD, Bollinger Bands, DMI, and Parabolic SAR to suit their trading style.
- Flexible Timeframes: You can toggle between different timeframes (M15, M30, H1, H4, D1) to focus on the intervals most relevant to your strategy.
Ideal For
- Traders looking for a detailed, multi-timeframe trend analysis tool for XAUUSD.
- Traders who rely on trend-following strategies and need confirmation across multiple timeframes.
- Those who prefer a multi-indicator approach to avoid false signals and improve the accuracy of their trades.
Disclaimer
This indicator is for informational and educational purposes only. It is recommended to combine this with proper risk management strategies and your own analysis. Past performance does not guarantee future results. Always perform your own due diligence before making trading decisions.

First Heikin-Ashi Candle Tracker [CHE] First Heikin-Ashi Candle Tracker
"A Heikin-Ashi Candle Rarely Comes Alone"
1. Introduction
Fundamental Observation
- "A Heikin-Ashi Candle Rarely Comes Alone"
- This principle highlights the tendency of Heikin-Ashi candles to appear in sequences, indicating sustained trends rather than isolated movements.
- Recognizing these patterns can significantly enhance trading strategies by identifying stronger and more reliable entry points.
2. Understanding Heikin-Ashi Candles
What Are Heikin-Ashi Candles?
- Heikin-Ashi is a type of candlestick chart used to identify market trends more clearly.
- Calculation Method:
- Ha_Close: (Open + High + Low + Close) / 4
- Ha_Open: (Previous Ha_Open + Previous Ha_Close) / 2
- Ha_High: Maximum of High, Ha_Open, Ha_Close
- Ha_Low: Minimum of Low, Ha_Open, Ha_Close
- Visual Differences:
- Smoother appearance compared to traditional candlesticks.
- Helps in filtering out market noise and highlighting the prevailing trend.
Benefits of Heikin-Ashi Candles
- Trend Clarity: Easier identification of uptrends and downtrends.
- Reduced Noise: Minimizes the impact of insignificant price movements.
- Visual Appeal: Cleaner charts enhance decision-making processes.
3. Introducing the First Heikin-Ashi Candle Tracker [CHE ]
Purpose of the Indicator
- Track First Heikin-Ashi Candles: Identifies the initial appearance of Heikin-Ashi candles across multiple timeframes.
- Enhance Trading Decisions: Provides visual cues for potential long and short entries based on trend confirmations.
Key Features
- Multi-Timeframe Support: Monitor Heikin-Ashi candles across different timeframes (e.g., 240, 60, 30, 15 minutes).
- Customizable Visuals: Adjustable colors and line widths for better chart integration.
- User-Friendly Interface: Easy-to-configure settings tailored to individual trading preferences.
- Max Line Management: Controls the number of displayed lines to maintain chart clarity.
4. How to Use the First Heikin-Ashi Candle Tracker
Step-by-Step Guide
1. Enable Desired Groups:
- Activate up to four groups, each representing a different timeframe.
- Customize each group's settings according to your trading strategy.
2. Configure Timeframes:
- Select timeframes that align with your trading style (e.g., short-term vs. long-term).
3. Set Candle Types to Track:
- Choose to monitor Both, Green (Bullish), or Red (Bearish) Heikin-Ashi candles.
- Focus on specific candle types to streamline entry signals.
4. Customize Visual Indicators:
- Adjust Green Line Color and Red Line Color for clear distinction.
- Modify Line Width to ensure visibility without cluttering the chart.
5. Manage Line Limits:
- Set the Max Number of Lines to prevent overcrowding.
- The indicator will automatically remove the oldest lines when the limit is exceeded.
6. Interpret Signals:
- Green Lines: Indicate potential Long entry points.
- Red Lines: Indicate potential Short entry points.
- Observe the sequence and frequency of candles to assess trend strength.
Practical Example
- Uptrend Identification:
- Consecutive green Heikin-Ashi candles with corresponding green lines signal a strong upward trend.
- Consider entering a Long position when the first green candle appears.
- Downtrend Identification:
- Consecutive red Heikin-Ashi candles with corresponding red lines signal a strong downward trend.
- Consider entering a Short position when the first red candle appears.
5. Benefits and Utility
Enhanced Trend Detection
- Early Signals: Identify the beginning of new trends promptly.
- Confirmation: Multiple timeframes provide robust confirmation of trend direction.
Improved Entry Points
- Precision: Pinpoint optimal moments to enter trades, reducing the risk of false signals.
- Flexibility: Suitable for both Long and Short strategies across various markets.
User-Friendly Operation
- Intuitive Settings: Easily configurable to match individual trading preferences.
- Visual Clarity: Clear lines and color-coding facilitate quick decision-making.
Time Efficiency
- Automated Tracking: Saves time by automatically identifying and marking relevant candles.
- Multi-Timeframe Analysis: Consolidates information from different timeframes into a single view.
6. Why Use the First Heikin-Ashi Candle Tracker ?
Strategic Advantages
- Market Insight: Gain deeper understanding of market dynamics through Heikin-Ashi analysis.
- Risk Management: Improved entry points contribute to better risk-reward ratios.
- Versatility: Applicable to various trading instruments, including stocks, forex, and cryptocurrencies.
Why Heikin-Ashi for Entries?
- Trend Reliability: Heikin-Ashi candles smooth out price data, providing more reliable trend indicators.
- Reduced Whipsaws: Fewer false signals compared to traditional candlestick charts.
- Clarity in Decision-Making: Simplifies the process of identifying and acting on market trends.
Conclusion
- The First Heikin-Ashi Candle Tracker is an essential tool for traders seeking to enhance their trend analysis and improve entry strategies.
- By leveraging the power of Heikin-Ashi candles, this indicator offers a clear, user-friendly approach to identifying profitable trading opportunities.
7. Getting Started
Installation
1. Add the Indicator:
- Open TradingView and navigate to the Pine Script editor.
- Paste the translated Pine Script code for the First Heikin-Ashi Candle Tracker .
- Save and add the indicator to your chart.
2. Configure Settings:
- Enable desired groups and set appropriate timeframes.
- Customize colors and line widths as per your preference.
- Adjust the maximum number of lines to maintain chart clarity.
3. Start Trading:
- Monitor the chart for green and red lines indicating potential Long and Short entries.
- Combine with other analysis tools for enhanced trading decisions.
Support and Resources
- Documentation: Refer to the included comments within the Pine Script for detailed explanations.
- Community Forums: Join TradingView communities for tips and shared experiences.
- Customer Support: Reach out for assistance with installation or configuration issues.
8. Disclaimer
The content provided, including all code and materials, is strictly for educational and informational purposes only. It is not intended as, and should not be interpreted as, financial advice, a recommendation to buy or sell any financial instrument, or an offer of any financial product or service. All strategies, tools, and examples discussed are provided for illustrative purposes to demonstrate coding techniques and the functionality of Pine Script within a trading context.
Any results from strategies or tools provided are hypothetical, and past performance is not indicative of future results. Trading and investing involve high risk, including the potential loss of principal, and may not be suitable for all individuals. Before making any trading decisions, please consult with a qualified financial professional to understand the risks involved.
By using this script, you acknowledge and agree that any trading decisions are made solely at your discretion and risk.
Happy Trading!
Best regards
Chervolino (Volker)
TASC 2024.08 Volume Confirmation For A Trend System█ OVERVIEW
This script demonstrates the use of volume data to validate price movements based on the techniques Buff Pelz Dormeier discusses in his "Volume Confirmation For A Trend System" article from the August 2024 edition of TASC's Traders' Tips . It presents a trend-following system implementation that utilizes a combination of three indicators: the Average Directional Index (ADX), the Trend Thrust Indicator (TTI), and the Volume Price Confirmation Indicator (VPCI).
█ CONCEPTS
In his article, Buff Pelz Dormeier recounts his search for an optimal trend-following strategy enhanced with volume data, starting with a simple system combining the ADX , MACD , and OBV indicators. Even in these early tests, the author observed that the volume confirmation from OBV notably improved trading performance. Subsequently, the author replaced OBV with his VPCI, which considers the proportional weights of volume and price, to enhance the validation of trend momentum. Lastly, the author explored the inclusion of his TTI, a modified MACD that features volume-based enhancements, as a strategy component for improved trend-following performance.
According to the author's research, the ADX+TTI+VPCI system outperformed similar strategies he tested in the article, yielding significantly higher returns and enhanced perceived reliability. Because the system's design revolves around catching pronounced trends, it performs best with a portfolio of individual stocks. The author applies the system in the article by allocating 5% of the equity to long positions in S&P 500 components that meet the ADX+TTI+VPCI entry criteria (see the Calculations section below for details). He uses the proceeds from closing positions to enter new positions in other stocks meeting the screening criteria, holding any excess proceeds in cash.
█ CALCULATIONS
The TTI is similar to the MACD. Its calculation entails the following steps:
Calculate fast (short-term) and slow (long-term) volume-weighted moving averages (VWMAs).
Compute the volume multiple (VM) as the square of the ratio of the fast VWMA to the slow VWMA.
Adjust these averages by multiplying the fast VWMA by the VM and dividing the slow VWMA by the VM.
Calculate the difference between the adjusted VWMAs to determine the TTI value, and take the average of that series to determine the signal line value.
The VPCI utilizes differences and ratios between VWMAs and corresponding simple moving averages (SMAs) to provide an alternative volume-price confirmation tool. Its calculation is as follows:
Subtract the slow SMA from the VWMA of the same length to calculate the volume-price confirmation/contradiction (VPC) value.
Divide the fast VWMA by the corresponding fast SMA to determine the volume-price ratio (VPR).
Divide the short-term VWMA by the long-term VWMA to calculate the VM.
Compute the VPCI as the product of the VPC, VPR, and VM values.
The long entry criteria of the ADX+TTI+VPCI system are as follows:
The ADX is above 30.
The TTI crosses above its signal line.
The VPCI is above 0, confirming the trend.
Signals to close positions occur when the VPCI is below 0, indicating a contradiction .
NOTE: Unlike in the article, this script applies the ADX+TTI+VPCI system to one stock at a time , not a portfolio of S&P 500 constituents.
█ DISCLAIMER
This strategy script educates users on the trading system outlined by the TASC article. By default, it uses 10% of equity as the order size and a slippage amount of 5 ticks. Traders should adjust these settings and the commission amount when using this script.

Zero Lag Exponential Moving Average ForLoop [InvestorUnknown]Overview
The Zero Lag Exponential Moving Average (ZLEMA) ForLoop indicator is designed for traders seeking a responsive and adaptive tool to identify trend changes. By leveraging a range of lengths and different moving average (MA) types, this indicator helps smooth out price data and provides timely signals for market entry and exit.
User Inputs
Start and End Lengths: Define the range of lengths over which the IIRF values are calculated.
Moving Average Type: Choose from EMA, SMA, WMA, VWMA, or TMA for trend smoothing.
Moving Average Length: Specify the length for the chosen MA type.
Calculation Source: Select the price data used for calculations.
Signal Calculation
Signal Mode (sigmode): Determines the type of signal generated by the indicator. Options are "Fast", "Slow", "Thresholds Crossing", and "Fast Threshold".
1. Slow: is a simple crossing of the midline (0).
2. Fast: positive signal depends if the current MA > MA or MA is above 0.99, negative signals comes if MA < MA or MA is below -0.99.
3. Thresholds Crossing: simple ta.crossover and ta.crossunder of the user defined threshold for Long and Short.
4. Fast Threshold: signal changes if the value of MA changes by more than user defined threshold against the current signal
col1 = MA > 0 ? colup : coldn
var color col2 = na
if MA > MA or MA > 0.99
col2 := colup
if MA < MA or MA < -0.99
col2 := coldn
var color col3 = na
if ta.crossover(MA,longth)
col3 := colup
if ta.crossunder(MA,shortth)
col3 := coldn
var color col4 = na
if (MA > MA + fastth)
col4 := colup
if (MA < MA - fastth)
col4 := coldn
color col = switch sigmode
"Slow" => col1
"Fast" => col2
"Thresholds Crossing" => col3
"Fast Threshold" => col4
Visualization Settings
Bull Color (colup): The color used to indicate bullish signals.
Bear Color (coldn): The color used to indicate bearish signals.
Color Bars (barcol): Option to color the bars based on the signal.
Custom function
// Function to calculate an array of ZLEMA values over a range of lengths
ZLEMAForLoop(a, b, c, s) =>
// Initialize an array to hold ZLEMA trend values
var Array = array.new_float(b - a + 1, 0.0)
// Loop through the range from 'a' to 'b'
for x = 0 to (b - a)
// Calculate the current length
len = a + x
// Calculate the lag based on the length
lag = math.floor((len - 1) / 2)
// Calculate the smoothing factor alpha
alpha = 2 / (len + 1)
// Initialize the ZLEMA variable
zlema = 0.0
// Compute the ZLEMA value
zlema := na(zlema ) ? (s + s - s ) : alpha * (s + s - s ) + (1 - alpha) * nz(zlema )
// Determine the trend based on ZLEMA value
trend = zlema > zlema ? 1 : -1
// Store the trend in the array
array.set(Array, x, trend)
// Calculate the average of the trend values
Avg = array.avg(Array)
// Apply the selected moving average type to the average trend value
float MA = switch maType
"EMA" => ta.ema(Avg, c) // Exponential Moving Average
"SMA" => ta.sma(Avg, c) // Simple Moving Average
"WMA" => ta.wma(Avg, c) // Weighted Moving Average
"VWMA" => ta.vwma(Avg, c) // Volume-Weighted Moving Average
"TMA" => ta.trima(Avg, c) // Triangular Moving Average
=>
runtime.error("No matching MA type found.") // Error handling for unsupported MA type
float(na)
// Return the array of trends, the average trend, and the moving average
Important Considerations
Speed vs. Stability: The ZLEMA ForLoop is designed for fast response times, making it ideal for short-term trading strategies. However, its sensitivity also means it may generate more signals, some of which could be false positives.
Use with Other Indicators: To improve the reliability of the signals, it is recommended to use the ZLEMA ForLoop in conjunction with other technical indicators.
Customization: Tailor the settings to match your trading style and risk tolerance. Adjusting the lengths, MA type, and thresholds can significantly impact the indicator's performance.
Conclusion
The ZLEMA ForLoop indicator offers a flexible tool for traders looking to capture trend changes quickly. By providing multiple modes and customization options, it allows traders to fine-tune their analysis and make informed decisions. For best results, use this indicator alongside other analytical tools to confirm signals and avoid potential false entries.
