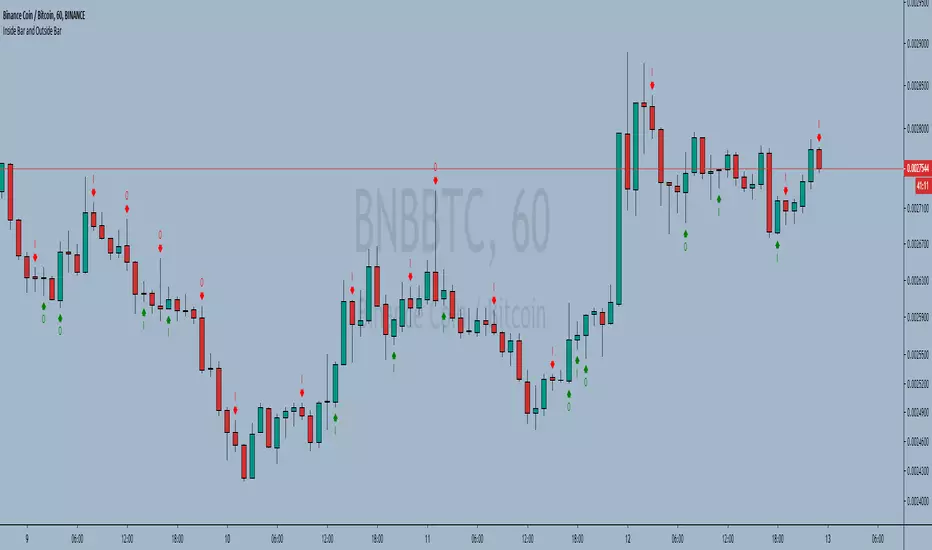
Inside Bar and Outside Bar Simple indicator, to show outside bars and inside bars
inside sellbar = "I" in red color
inside buybar = "I" in green color
Outside sellbar = "O" in red color
Outside buybar = "O" in green color
----------//---------------
PT-BR
Indicador simples, para mostrar outside bars e inside bars
inside sellbar = "I" na cor vermelha
inside buybar = "I" na cor verde
Outside sellbar = "O" na cor vermelha
Outside buybar = "O" na cor verde
Cari dalam skrip untuk "inside bar"
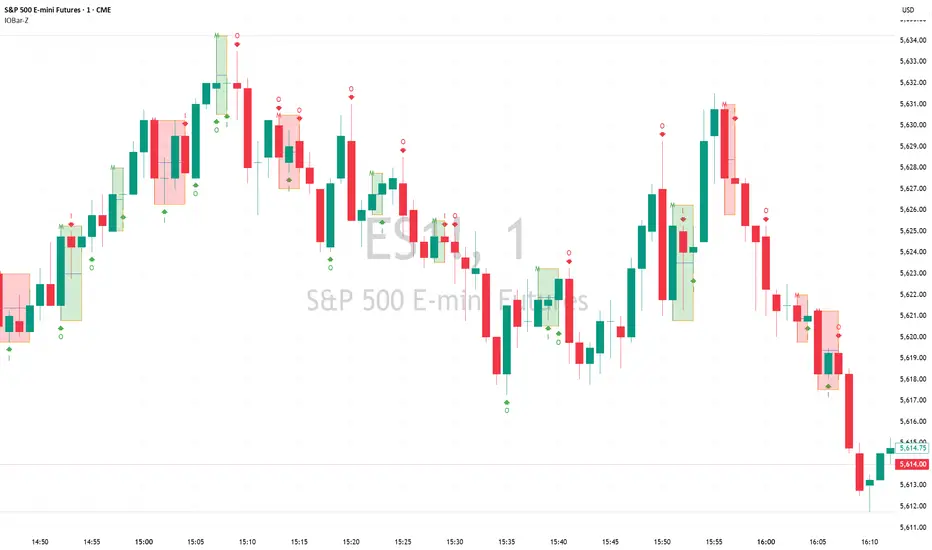
Inside Bar Breakout/Fakeout with AI Scenarios [Yosiet]Inside Bar Breakout/Fakeout Indicator with Scenarios
The Indicator is a powerful tool for traders looking to identify potential breakout and fakeout opportunities based on inside bar patterns. This indicator combines multiple technical analysis concepts to provide a comprehensive view of market behavior, helping traders make more informed decisions.
Key Features
Inside bar detection with filtering
Breakout and fakeout identification
Three distinct scenario detections
Customizable moving average calculations
Flexible visualization options
Alert conditions for various events
How It Works
The indicator identifies inside bars and filters them based on a maximum number of consecutive inside bars. It then detects breakouts and fakeouts using user-defined parameters. The script also calculates moving averages to determine trend direction.
Three specific scenarios are detected:
Strong breakout followed by a strong reversal
Weak breakout with multiple doji/weak candles
Strong breakout without reversal
These scenarios are visually represented on the chart, allowing traders to quickly identify potential trading opportunities.
How to Use
Apply the indicator to your chart
Adjust the input parameters to suit your trading style
Look for inside bar patterns and subsequent breakouts/fakeouts
Pay attention to the three scenario markers for additional context
Use the alert conditions to stay informed of potential opportunities

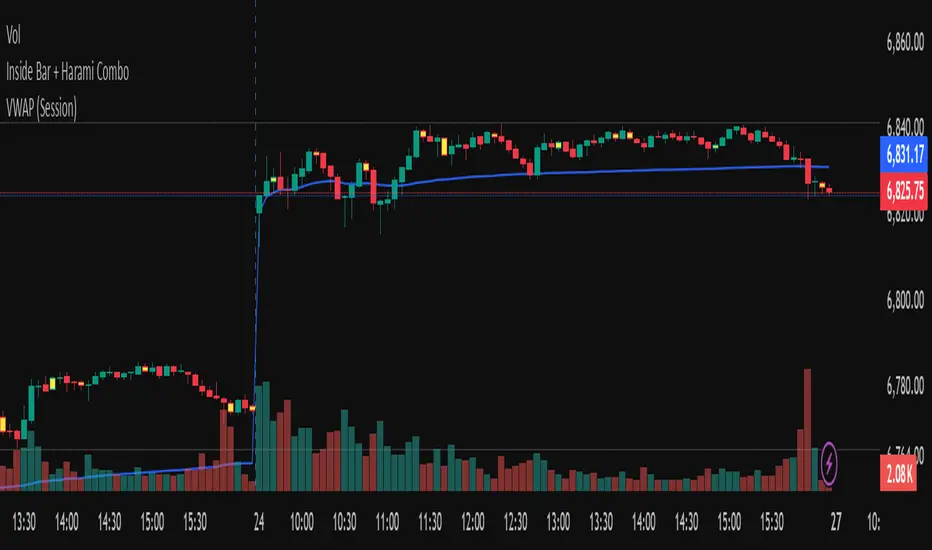
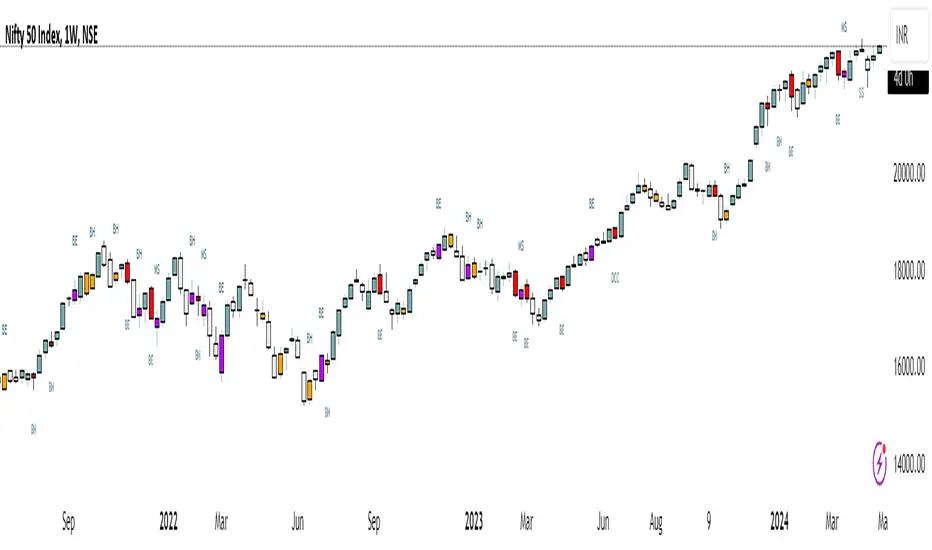
Inside Bar + Harami ComboThis indicator visually highlights Inside Bars, Outside Bars, and Harami candlestick patterns directly on your chart using clean color-coded candles — no labels, no shapes, just visual clarity.
It helps traders quickly identify potential reversal and continuation setups by coloring candles according to the detected pattern type.
🔍 Patterns Detected
🟨 Inside Bar — Current candle’s range is completely inside the previous candle’s range.
Often signals price contraction before a breakout.
💗 Outside Bar — Current candle’s high and low exceed the previous candle’s range.
Indicates volatility expansion and possible trend continuation.
🟩 Bullish Harami — A small bullish candle within the body of a prior bearish candle.
Suggests potential reversal to the upside.
🟥 Bearish Harami — A small bearish candle within the body of a prior bullish candle.
Suggests potential reversal to the downside.
⚙️ Features
Customizable colors for each pattern type.
Simple overlay visualization — no shapes, no labels, just colored candles.
Harami colors automatically override Inside/Outside colors when both occur on the same bar.
Lightweight logic for smooth performance on any timeframe or symbol.
💡 How to Use
Apply the indicator to your chart.
Configure colors in the settings panel if desired.
Watch for highlighted candles:
Inside Bars often precede breakouts.
Harami patterns can mark reversal zones.
Combine with trend tools (like moving averages) to confirm setups.
⚠️ Note
This indicator is for visual pattern detection and educational use only.
Always combine candlestick signals with broader technical or market context before trading decisions.
Inside Bar/Outside Bar/Mother Bar Box By SmartTrader888This Indicator shows:
1. Inside Bar
2. Outside Bar
3. Mother Bar box (Box the mother bar and all subsequent inside bars)
This indicator handles correctly the edge conditions such as:
1. bar close = bar open
2. current bar low equals to mother bar low or current bar high equals mother bar high
Inside Bar + Bullish and Bearish candlestick [Tarun]
Inside Bar Detection:
The function isInsideBar() checks if a bar is an inside bar, meaning its high is lower than the previous bar's high and its low is higher than the previous bar's low.
Inside bars are highlighted with an orange color.
Bearish Candlestick Patterns:
Bearish Engulfing: When the current candlestick's body completely engulfs the previous candlestick's body.
Dark Cloud Cover: When a bullish candle is followed by a bearish candle that opens above the previous bullish candle's close but closes below its midpoint.
Bearish Harami: When a small bullish candlestick is engulfed by a larger bearish candlestick.
Evening Star: A three-candle pattern consisting of a large bullish candle, a small-bodied candle with a gap up or down, and a large bearish candle that closes below the midpoint of the first candle.
Shooting Star: A single candlestick pattern with a small real body near the bottom of the price range and a long upper shadow.
Bearish Marubozu: A candlestick with a long bearish body and little to no upper or lower shadows.
Bearish candlestick patterns are highlighted with a red color and labeled with abbreviated names.
Bullish Candlestick Patterns:
Bullish Engulfing: Opposite of bearish engulfing, where the current candlestick's body completely engulfs the previous candlestick's body.
Piercing Pattern: When a bearish candle is followed by a bullish candle that opens below the previous bearish candle's low but closes above its midpoint.
Bullish Harami: Similar to bearish harami but bullish, where a small bearish candlestick is engulfed by a larger bullish candlestick.
Morning Star: A three-candle pattern opposite to the evening star, signaling a potential reversal from downtrend to uptrend.
Bullish Hammer: A single candlestick pattern with a small real body near the top of the price range and a long lower shadow.
Bullish Marubozu: A candlestick with a long bullish body and little to no upper or lower shadows.
Bullish candlestick patterns are highlighted with a purple color and labeled with abbreviated names.
Inside Bars📌 Overview:
This indicator scans for multiple inside bars during periods of consolidation by dynamically designating a “mother bar” and then marking subsequent bars that trade entirely within its range. It includes an optional doji filter on the most recent candle, helping to confirm indecision before potential breakouts.
🛠 Key Features:
✅ Dynamic Mother Bar Identification:
The script selects a mother bar when the current bar’s range exceeds that of the previous bar. This bar sets the high and low boundaries, creating a reference zone for later price action.
Once a mother bar is defined, subsequent candles that remain completely within its high and low are flagged as inside bars.
✅ Optional Doji Check:
For added precision, an optional feature lets you verify that the most recent bar is a doji—a candle where the difference between the open and close is minimal relative to its total range. This additional filter highlights periods of market indecision, which can often precede strong directional moves.
⚡ Add this script to your chart and enhance your trading strategy! 🚀
Inside Bar AlertThis software finds inside bars even when the inside bar maybe not exactly inside the previous bar. It can also find inside range or smaller range then norm candles. By being able to identify the consolidation bar, it allows you to get on-board just before a likely expansion bars will happen.

3 Consecutive Inside Bars - RSTInside bars are often used to identify potential consolidation periods or breakout setups.
This will provide tight range for 3 consecutive inside bars.
Remember that inside bar patterns are just one tool, and no indicator is perfect. Always use sound risk management.

Inside Bar Breakout Alert - RajThis indicator is based on the inside bar strategy it help you to cut down your screen time by giving you constant alerts when a inside bar forms while also gives you alert on bullish and bearish break out of the mother candle.

Inside Bar Visualizer PineV4I didn't find a study for Inside bar as I wanted. Therefore I wrote a one with PineV4. This may help you to see inside bars.
It can recalculate and works with either (opens-closes) or (highs-lows)
Cheers! :)

Inside Bar Alert I need help!!! I created the alert but it triggering during the formation not once it has printed. Does anyone know who to make it trigger the alert once the inside bar is complete and make it plot an arrow when the inside bar has formed?

Fakey pattern (Inside Bar False Breakout)Inside Bar + False-Breakout = Fakey pattern
A Fakey pattern can have a pin bar as the false-break bar or not. Fakey’s are a very important and potent price action trading strategy because they can help us identify stop-hunting and provide us with a very good clue as to what price might do next.

Inside Bar With Alert - RajThis indicator helps you reduce your screen time by giving you consistent alerts on the formation of inside bar candle and it gives you bullish and bearish alerts on breakout of the mother candle. So if you believe in inside strategy this indicator will be helpful for you.

Inside BarsMark Inside Bars with a triangle above the calendar. This indicator supports having different colors and alerts for 1, 2 or 3 consecutive inside bars.


Inside Bars - Rob Dee editCatch Inside Bars with ease with this tool.
Adjust the colour and intensity of the indication candle.


Simultaneous INSIDE Bar Break IndicatorSimultaneous Inside Bar Break Indicator (SIBBI) for The Strat Community
Overview:
The Simultaneous Inside Bar Break Indicator (SIBBI) is designed to help traders using The Strat methodology identify one of the most powerful breakout patterns: the Simultaneous Inside Bar Break across multiple symbols. This indicator detects when all four user-selected symbols form inside bars on the previous candle and then break those inside bars in the same direction (either bullish or bearish) on the current candle.
Inside bars represent consolidation periods where price action does not break the high or low of the previous candle. When a simultaneous break occurs across multiple symbols, this often signals a strong move in the market, making this a key actionable signal in The Strat trading strategy.
Key Features:
Multi-Symbol Analysis: You can track up to four different symbols simultaneously. By default, the indicator comes with SPY, QQQ, IWM, and DIA, but you can modify these to track any other assets or symbols.
Inside Bar Detection: The indicator checks whether all four symbols have inside bars on the previous candle. It only triggers when all symbols meet this condition, making it a highly specific and reliable signal.
Simultaneous Break Detection: Once all symbols have inside bars, the indicator waits for a breakout in the same direction across all four symbols. A simultaneous bullish break (prices breaking above the previous candle’s high) triggers a green label, while a simultaneous bearish break (prices breaking below the previous candle’s low) triggers a red label.
Dynamic Label Timeframe: The indicator dynamically adjusts the timeframe in the label based on the user’s selected timeframe. This allows traders to know precisely which timeframe the break is occurring on. If the user selects "Chart Timeframe," the indicator will evolve with the current chart's timeframe, making it more versatile.
Timeframe Flexibility: The indicator can be set to analyze any timeframe—15-minute, 30-minute, 60-minute, daily, weekly, and so on. It only works for the specific timeframe you set it to in the settings. If set to "Chart Timeframe," the label will adapt dynamically based on the timeframe you are currently viewing.
Customizable Labels: The user can choose the size of the labels (tiny, small, or normal), ensuring that the visual output is tailored to individual preferences and chart layouts.
Best Use Case:
The Simultaneous Inside Bar Break Indicator is particularly powerful when applied to multiple timeframes. Here’s how to use it for maximum impact:
Multi-Timeframe Setup: Set the indicator on various timeframes (e.g., 15-minute, 30-minute, 60-minute, and daily) across multiple charts. This allows you to monitor different timeframes and identify when lower timeframe breaks trigger potential moves on higher timeframes.
Anticipating Strong Moves: When a simultaneous inside bar break occurs on one timeframe (e.g., 30-minute), keep an eye on the higher timeframes (e.g., 60-minute or daily) to see if those timeframes also break. This stacking of inside bar breaks can signal powerful market moves.
Higher Conviction Signals: The indicator is designed to provide high-conviction signals. Since it requires all four symbols to break in the same direction simultaneously, it reduces false signals and focuses on higher probability setups, which is crucial for traders using The Strat to time their trades effectively.
How the Indicator Works:
Inside Bar Formation: The indicator first checks that all four selected symbols had inside bars in the previous bar (i.e., the current high and low are contained within the previous bar’s high and low).
Simultaneous Break Detection: After detecting inside bars, the indicator checks if all four symbols break out in the same direction—bullish (breaking above the previous bar’s high) or bearish (breaking below the previous bar’s low).
Label Display: When a simultaneous inside bar break occurs, a label is plotted on the chart—either green for a bullish break (below the candle) or red for a bearish break (above the candle). The label will display the timeframe you set in the settings (e.g., "IBSB 60" for a 60-minute break).
Chart Timeframe Option: If you prefer, you can set the indicator to evolve with the chart’s current timeframe. In this mode, the label will not show a specific timeframe but will still display the simultaneous inside bar break when it occurs.
Recommendations for Usage:
Focus on Multiple Timeframes: The Strat methodology is all about understanding the relationship between different timeframes. Use this indicator on multiple timeframes to get a better picture of potential moves.
Pair with Other Strat Techniques: This indicator is most powerful when combined with other Strat tools, such as broadening formations, timeframe continuity, and actionable signals (e.g., 2-2 reversals). The simultaneous inside bar break can help confirm or invalidate other signals.
Customize Symbols and Timeframes: Although the default symbols are SPY, QQQ, IWM, and DIA, feel free to replace them with symbols more relevant to your trading. This indicator works well across equities, indices, futures, and forex pairs.
How to Set It Up:
Select Symbols: Choose four symbols that you want to track. These can be index ETFs (like SPY and QQQ), individual stocks, or any other tradable instruments.
Set Timeframe: In the indicator’s settings, choose a specific timeframe (e.g., 15-minute, 30-minute, daily). The label will reflect the selected timeframe, making it clear which time-based break you are seeing.
Optional - Chart Timeframe Mode: If you want the indicator to adapt to the chart’s current timeframe, select the "Chart Timeframe" option in the settings. The indicator will plot the breaks without showing a specific timeframe in the label.
Customize Label Size: Depending on your chart layout and personal preference, you can adjust the size of the labels (tiny, small, or normal) in the settings.
Conclusion:
The Simultaneous Inside Bar Break Indicator is a powerful tool for traders using The Strat methodology, offering a highly specific and reliable signal that can indicate potential large market moves. By monitoring multiple symbols and timeframes, you can gain deeper insight into the market's behavior and act with greater confidence. This indicator is ideal for traders looking to catch high-conviction moves and align their trades with broader market continuity.
Note: The indicator works best when paired with multi-timeframe analysis, allowing you to see how breaks on lower timeframes might influence larger trends. For traders who prefer simplicity, setting it to the "Chart Timeframe" mode offers flexibility while maintaining the core benefits of this indicator.

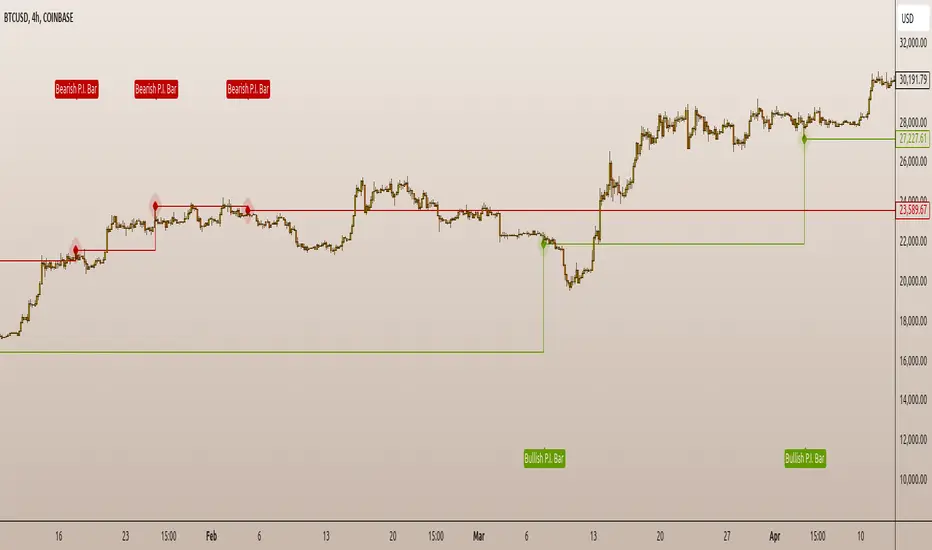
P.I.B. System (Pin Bar | Inside Bar) // AlgoFyreThe "P.I.B. System (Pin Bar | Inside Bar)" identifies bullish and bearish pin bars and inside bars on a price chart. It highlights potential market reversals by plotting labels and colorizing bars, providing traders with visual cues for better decision-making.
Description
The "P.I.B. System (Pin Bar | Inside Bar)" script is designed to help traders identify potential reversal points in the market by detecting bullish and bearish pin bars and inside bars. A pin bar is a candlestick pattern that indicates a potential reversal, characterized by a small body and a long wick. Inside bars are candlestick patterns where the current bar's high and low are within the previous bar's range, indicating potential consolidation before a breakout.
This script allows customization of various parameters to fine-tune the identification of pin bars and inside bars. When a pin bar or an inside bar is detected, the script plots a label on the chart and colorizes the bars to highlight these patterns. This tool is useful for traders looking to identify potential reversal points and make informed trading decisions.
Explanation of All Options
Pin-Wick Size Ratio Minimum Value : The minimum ratio of the wick size to the total candle size for a pin bar to be considered valid. Default is 0.66.
Candle Body Size Ratio Maximum Value : The maximum ratio of the body size to the total candle size for a pin bar to be considered valid. Default is 0.4.
Handle-Wick Wick Size Ratio Maximum Value : The maximum ratio of the opposite wick size to the total candle size for a pin bar to be considered valid. Default is 0.4.
Filter Out Small Candles : Option to filter out small candles based on the previous candle's size. Default is true.
Small Candle Size Ratio : The ratio used to determine if a candle is considered small compared to the previous candle. Default is 2.0.
Identify Inside Bars : Option to identify inside bars following a pin bar. Default is true.
Show Only P.I.B. : Option to show only the bars where a pin bar is followed by an inside bar. Default is true.
Hide Horizontal Rays : Option to hide horizontal rays drawn from the last identified pin bars. Default is false.
How to Use
To use this script, add it to your chart. Customize the input parameters to match your trading strategy. The script will automatically identify and highlight bullish and bearish pin bars and inside bars on the chart. Use the visual cues provided by the labels and colorized bars to make informed trading decisions.
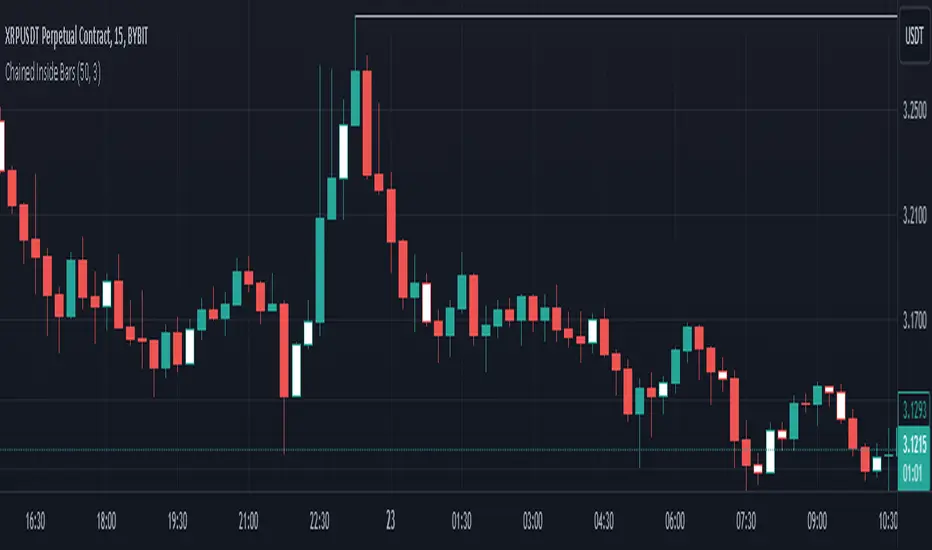
Chained Inside BarsThis script identifies consecutive inside bars by referencing only the most recent non-inside bar, so it avoids excessive lookback. An “inside” bar means its high is lower than the reference bar’s high, and its low is higher than the reference bar’s low. If the current bar is inside, it’s colored white; once price breaks outside, the script updates that new bar as the next reference.
Key Points
• Bars are compared against the last non-inside bar, chaining consecutive inside bars off that same reference bar.
• Inside bars are highlighted in white (non-inside bars retain default chart colors).
• Includes an alert condition for when a new inside bar forms.
• Prevents large dynamic indexing, making it more stable and efficient.
Use this indicator to quickly spot consecutive inside-bar formations without needing to track every single bar-to-bar relationship.
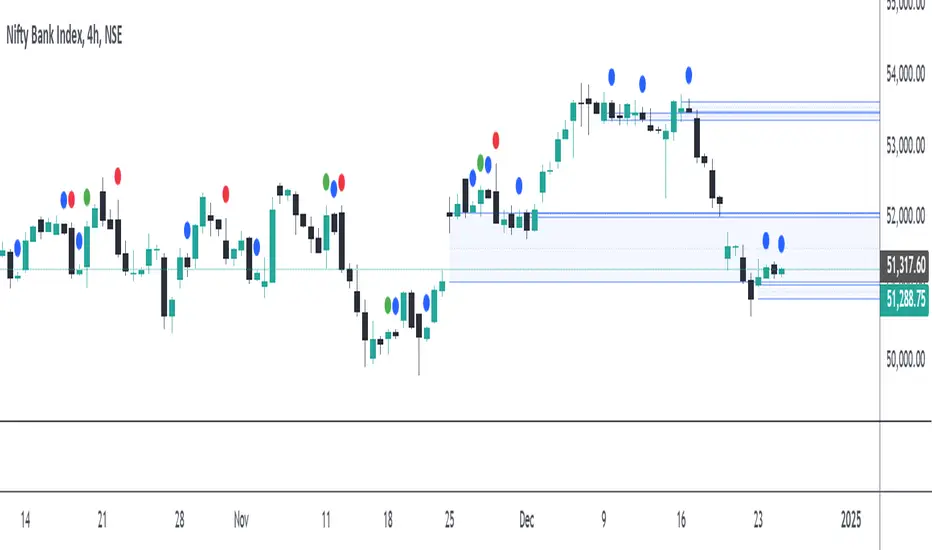
Engulfing Patterns & Inside Bar at NWOGEngulfing Patterns & Inside Bar at NWOG:
This indicator is designed to detect and display specific candlestick patterns (Bearish Engulfing, Bullish Engulfing, and Inside Bar) when they occur at the New Week Open Gap (NWOG). The indicator provides tiny dots plotted at the top of the candle for each detected pattern, keeping the chart clean and minimal. Below is a detailed description of the logic and components:
Candlestick Patterns Detected:
Bearish Engulfing:
A Bearish Engulfing pattern occurs when:
The current candle’s high is above the previous candle’s high.
The current candle’s close is below the previous candle’s low.
This pattern signals a potential downtrend and is marked by a red dot at the top of the candle.
Bullish Engulfing:
A Bullish Engulfing pattern occurs when:
The current candle’s low is below the previous candle’s low.
The current candle’s close is above the previous candle’s high.
This pattern signals a potential uptrend and is marked by a green dot at the top of the candle.
Inside Bar:
An Inside Bar pattern occurs when:
The current candle’s high is lower than the previous candle’s high.
The current candle’s low is higher than the previous candle’s low.
This pattern indicates a period of consolidation and possible breakout or breakdown, and is marked by a blue dot at the top of the candle.
New Week Open Gap (NWOG) Condition:
The patterns (Bearish Engulfing, Bullish Engulfing, and Inside Bar) are only considered valid if the candles occur within or touch the range of the New Week Open Gap (NWOG).
The NWOG is defined as the gap between:
The Friday close (previous week’s closing price).
The Monday open (current week’s opening price).
If the signal patterns (Bullish Engulfing, Bearish Engulfing, Inside Bar) align with the NWOG, a tiny dot is plotted at the top of the candle where the pattern occurs.
Visual Representation:
Red Dots: Indicate Bearish Engulfing signals that occur at the NWOG.
Green Dots: Indicate Bullish Engulfing signals that occur at the NWOG.
Blue Dots: Indicate Inside Bar Breakdown signals that occur at the NWOG.
Each dot is plotted as a tiny circle at the top of the candle, ensuring the chart remains minimal and clean without cluttering the view.
Key Features:
Minimal and Clean: The indicator only plots tiny dots at the top of the candles for the detected signals. No additional lines, labels, or other visual elements clutter the chart.
Customizable Signal Colors: Users can customize the colors for each signal type (Bearish Engulfing, Bullish Engulfing, and Inside Bar).
Alerts: Alerts are included for all detected patterns (Bullish Engulfing, Bearish Engulfing, Inside Bar) at the NWOG.
Alerts:
Bearish Engulfing Detected: Alerts when a Bearish Engulfing pattern occurs at the NWOG.
Bullish Engulfing Detected: Alerts when a Bullish Engulfing pattern occurs at the NWOG.
Inside Bar Breakdown Detected: Alerts when an Inside Bar Breakdown pattern occurs at the NWOG.
This indicator is helpful for traders who want to focus on clean, easy-to-spot patterns and trade based on market conditions near the New Week Open Gap (NWOG). The tiny dots ensure that only relevant signals are displayed without any distractions.