[delta2win] Liquidity Zone Map🔥 Liquidity Zone Map — Volume‑normalized pivot zones with adaptive ATR scaling
📊 What it does:
• Detects potential liquidity/liquidation zones above confirmed highs and below confirmed lows
• Draws dynamic zones whose height scales with ATR and whose color intensity scales with volume
• Zones extend right and terminate on rule‑based events (midline cross)
🔬 How it works (core formulas):
• Pivot detection: ta.pivothigh/ta.pivotlow with length L
• Zone height: H = max(ATR(T) × M, MinTicks)
• Intensity (volume‑normalized):
– Z‑Score mode: I = clamp((V − μ) / (σ + ε), 0..1)
– Piecewise mode: I = clamp(V ≤ μ ? V/μ : (V − μ) / (Vmax − μ + ε), 0..1)
• Gradient color: col = Gradient(I) (start → mid → end)
• Zone life‑cycle:
– Creation on new pivot (top/bottom)
– Right edge follows bar_index
– Termination when with Mid = (Top+Bottom)/2, or optional TTL timeout
• Analysis range: global or constrained (Bars Back or ±% price window). Color scaling can be global or range‑scoped.
🆕 What’s new/different:
• Selectable volume normalization (Z‑Score or Piecewise)
• Timeframe‑adaptive ATR multiplier
• Range‑scoped vs. global color scaling
• Optional midlines, borders, info legend, scale legend
• Optional TTL termination for zones (lifetime in bars)
• Object management (cleanup/pooling) for performance
🧭 How to use (suggested presets):
• 1–5m: L=2, T=200, M=0.25, Range=Bars Back 1000, Intensity=Piecewise
• 15–60m: L=3, T=200, M=0.20, Range=Bars Back 1500, Intensity=Piecewise
• 4h+: L=4, T=200, M=0.20, Range=Off, Intensity=Z‑Score
⚙️ Settings:
• Pivot length L, ATR length T, multiplier M, MinTicks
• Opacity: base/auto (min/max)
• Range: Bars Back | Price Range ±% | Off
• Scaling: global vs. range‑scoped
• Midlines/borders/legends on/off
💡 Usage notes:
• Smaller L → more reactive, less robust
• Larger M → longer‑lasting zones
• On higher TFs, constrain "Bars Back" for performance
⚠️ Limitations:
• Non‑predictive; regime/volatility dependent
• Data quality impacts intensity computation
Cari dalam skrip untuk "liquidity"

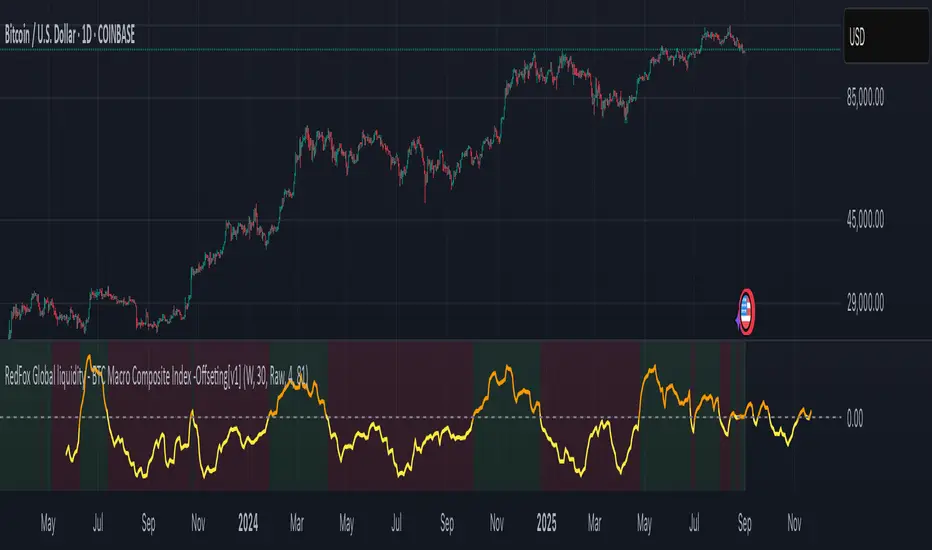
BTC Macro Composite Global liquidity Index -OffsetThis indicator is based on the thesis that Bitcoin price movements are heavily influenced by macro liquidity trends. It calculates a weighted composite index based on the following components:
• Global Liquidity (41%): Sum of central bank balance sheets (Fed , ECB , BoJ , and PBoC ), adjusted to USD.
• Investor Risk Appetite (22%): Derived from the Copper/Gold ratio, inverse VIX (as a risk-on signal), and the spread between High Yield and Investment Grade bonds (HY vs IG OAS).
• Gold Sensitivity (15–20%): Combines the XAUUSD price with BTC/Gold ratio to reflect the historical influence of gold on Bitcoin pricing.
Each component is normalized and then offset forward by 90 days to attempt predictive alignment with Bitcoin’s price.
The goal is to identify macro inflection points with high predictive value for BTC. It is not a trading signal generator but rather a macro trend context indicator.
❗ Important: This script should be used with caution. It does not account for geopolitical shocks, regulatory events, or internal BTC market structure (e.g., miner behavior, on-chain metrics).
💡 How to use:
• Use on the 1D timeframe.
• Look for divergences between BTC price and the macro index.
• Apply in confluence with other technical or fundamental frameworks.
🔍 Originality:
While similar components exist in macro dashboards, this script combines them uniquely using time-forward offsets and custom weighting specifically tailored for BTC behavior.
Svl - Trading SystemPrice can tell lies but volume cannot, so keeping this in mind I have created this indicator in which you see sell order block and buy order block on the basis of price action + volume through which we execute our trade
First of all, let us know its core concepts and logic, which will help you in taking the right decisions in it.
core concept of the " Svl - Trading System " TradingView indicator is based on professional price action, volume, and swing structure. This indicator smartly gives real-time insights of important price turning points, reversal zones, and trend continuation. Its deep explanation is given below.
Edit - default swing length -5 , change according your nature , tested With 7 For 5 minute timeframe
Core Concept:
1. Swing Structure Detection
The indicator automatically detects swing highs (HH/LH) and swing lows (HL/LL) on the chart.
HH: Higher High
HL: Higher Low
LH: Lower High
LL: Lower Low
These swings are the backbone of price action – signaling a change in trend, a bounce, reversal or trend continuation.
2. Order Block (OB) Mapping
Buy Order Block (Buy OB): When the indicator detects the HL/LL swing, we declare Buy OB, the lowest point of the swing.
Sell Order Block (Sell OB): On HH/LH swing, the highest point of our swing is called Sell OB.
Order Blocks are those important zones of price where historically price has reacted strongly – where major clusters of buyers/sellers are located in the market.
3. Volume Analysis (Optional Dashboard/Barcolor)
The candle color depends on the volume ranking on the chart (most high/low, normal, pressure blue shade).
Highest/lowest volume candles are a special highlight, which helps to spot liquidity spikes, exhaustion, or big orders.
4. Live Dashboard
There is an automated dashboard in the top-right of the chart, which shows this in real-time:
Last swing type (HH/HL/LH/LL)
Reversal price (last swing level)
Swing direction (Bull/Bear/Neutral)
Volume, Buy OB, Sell OB, etc.
This helps the trader understand the market situation at a glance.
5. Smart Plotting/Labels
Buy/Sell are plotted as distinct lines on the OB chart.
The Labels option gives clear visual swing points.
All calculations are fast and automated – the user does not need to mark manually.
This indicator is an advanced, fully-automated price action tool that combines
trend, reversal, volume, liquidity and zone detection in one smart system,
makes entry/exit decisions objective and error-free,
and provides complete trading confidence with a live monitor/dashboard.
All of its functions/properties such as: swing detect, OB plot, volume color, dashboard follow best practice for professional chart analysis!

ICT/SMC Liquidity Map V3 KyroowThe indicator is designed to map liquidity on the chart following the ICT/SMC logic, with the added feature of precise tracking of the Asian session.
It shows you:
PDH / PDL → Previous Day High & Low, automatically removed once taken out.
EQH / EQL → Equal Highs & Equal Lows (double tops/bottoms), with pip tolerance and a check to ensure no candle has already "cleared" the range.
ASH / ASL → Asian Session High & Low (the highs/lows of each closed Asian session).
Asian Session → Displayed as a box or shaded area, with visual history.
Dynamic tolerance management → EQH/EQL can have different tolerances depending on the timeframe.
Automatic removal → Levels are removed once the market takes them (via wick or body, configurable).
💡 In practice:
It helps you quickly identify likely liquidity grab zones, whether they come from the previous day, the Asian session, or equal highs/lows. This allows you to anticipate market reactions around these levels.

Advanced Liquidity & FVG Detector With Entry/Exit SignalsThe Advanced Liquidity & FVG Detector is more than just an indicator—it's a complete trading system that brings institutional-grade market analysis to individual traders. By combining liquidity detection, fair value gap analysis, sweep/grab pattern recognition, and intelligent risk management, this indicator provides everything needed for sophisticated market analysis and high-probability trading opportunities.
Whether you're a day trader, swing trader, or position trader, this indicator adapts to your style and timeframe, providing the insights needed to make informed trading decisions with confidence. The Pine Script v6 compatibility ensures future-proof performance and seamless integration with the latest TradingView features.
Transform your trading experience with professional-grade market structure analysis—tradable insights delivered in real-time, right on your chart.

Hidden Liquidity Shift DetectorPurpose
The Hidden Liquidity Shift Detector identifies candles that indicate potential hidden accumulation or distribution activity based on volume and price action behavior. These setups often represent institutional absorption of liquidity ahead of larger moves.
How It Works
The script detects candles with the following characteristics:
Small real body relative to the total candle range
A strong wick (upper or lower) indicating rejection
Volume significantly higher than the recent average
It flags:
Hidden Selling (Distribution) when a bearish candle has a long upper wick and high volume
Hidden Buying (Accumulation) when a bullish candle has a long lower wick and high volume
These candles are often missed by traditional indicators but may precede significant reversals or breakouts.
Features
Automatic detection of absorption-style candles
Volume spike filtering based on configurable multiplier
Wick and body ratio thresholds to fine-tune signal quality
Non-intrusive signal markers (colored circles)
Real-time alerts for hidden buying/selling signals
Usage Tips
Use on 15m to 4H charts for intraday detection, or Daily for swing setups
Combine with support/resistance or volume profile zones for higher conviction
Clusters of signals in the same area increase reversal probability
Can be used alongside Wyckoff-style logic or smart money concepts

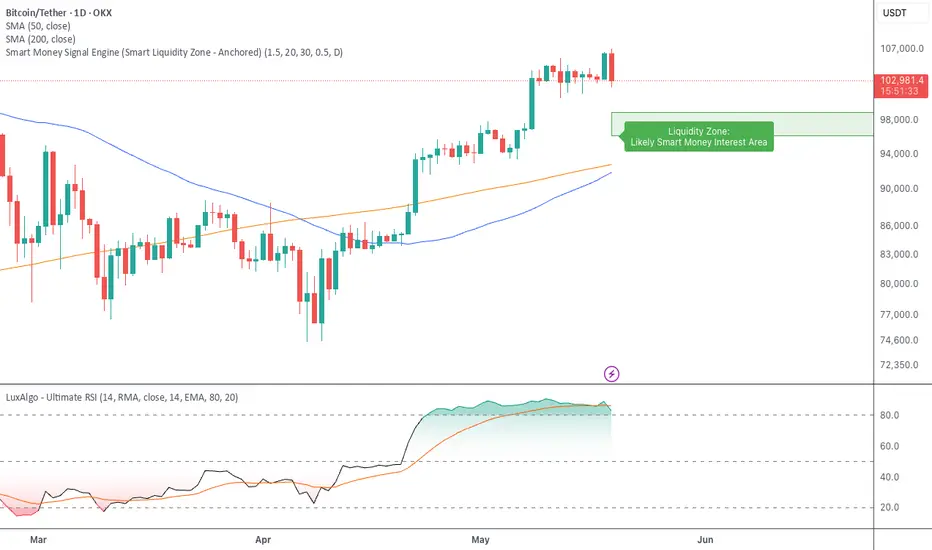
Smart Money Signal Engine (Smart Liquidity Zone - Anchored)🧭 Smart Liquidity Zone Indicator – Simple Guide
✅ What This Does
This tool helps you spot:
1. Smart Money Buy Zones (green box)
2. Fake Breakouts (trap alerts)
3. Real Breakouts (momentum alerts)
⸻
1. 🟩 Liquidity Zone (Green Box)
What it means:
Where big players (smart money) are likely interested in buying.
What you do:
• If price enters the box and holds → consider buying
• If price drops through fast → wait or look for short setups
⸻
2. 🔴 Trap Alert (Smart Money Trap)
What it means:
Price goes up fast with volume…
But no real buying power underneath = likely fakeout
On chart:
You’ll see a red label that says “Trap”
What you do:
• ❌ Don’t chase the pump
• ✅ Wait for reversal or short entry
⸻
3. 🟢 Breakout Alert
What it means:
Price breaks above a key level with strong volume
Smart money is likely behind the move
On chart:
You’ll see a green label that says “Breakout”
What you do:
• ✅ You can enter a momentum trade
• ✅ Place stop below previous structure
⸻
🔔 How to Turn on Alerts
Go to:
• TradingView > Alerts > Condition
• Choose:
• Smart Money Trap Alert
• Breakout Confirmed Alert
This way, TradingView notifies you instantly when:
• A fakeout is happening
• A real breakout begins
Silver Bullet 5 minutes Box - By KaVeHThis indicator plots high-low range boxes based on selected intraday time windows on the 5-minute chart. It's inspired by the "Silver Bullet" trading concept, highlighting key liquidity grabs and volatility pockets at predefined times. It helps traders visually identify potential smart money trading windows during the New York session and other time anchors.
⚠️ This script only works on the 5-minute chart.
📦 Main Features:
⏰ Customizable Time Boxes:
Define up to 4 separate time windows per day:
3:00 AM – 3:05 AM (New York time) (Box 1)
10:00 AM – 10:05 AM (New York time) (Box 2)
2:00 PM – 2:05 PM (New York time) (Box 3)
8:00 PM – 8:05 PM (New York time) (Box 4)
🎨 Color and Visibility Control:
Each box can be independently toggled and colored for visual distinction.
🕔 New York Time Based:
All timestamps are automatically adjusted to New York Time, aligning with institutional market behavior.
📉 Post-Box Projection:
After each time window closes, a box extends forward 6 hours (72 bars on a 5-minute chart) to highlight the range.
💡 Use Case:
These boxes are best used to:
Detect liquidity sweeps.
Mark potential entry or exit zones.
Track price behavior after specific time-based events.
For example, the 10 AM box is often used to identify setups just after the NYSE open and into the first hour of volatility.
⚠️ TradingView Compliance Notes:
This script is original and does not replicate or resell premium/paid indicators.
All logic is coded from scratch by kaveh_mirmousavi, using public concepts from ICT/Smart Money Trading.
Fully complies with the Mozilla Public License 2.0.
Does not include financial advice or signals — for educational use only.
✅ How to Use:
Apply to a 5-minute chart.
Adjust the desired time boxes in the input panel.
Watch for price action within and after the boxes.
Enjoy and feel free to share feedback or ideas for improvement!

Average Daily LiquidityIt is important to have sufficient daily trading value (liquidity) to ensure you can easily enter and, importantly, exit the trade. This indicator allows you to see if the traded value of a stock is adequate. The default average is 10 periods and it is common to average the daily traded value as both price and volume can have spikes causing trading errors. Some investors use a 5 period for a week, 10 period for 2 weeks, 20 or 21 period for 4 weeks/month and 65 periods for a quarter. You need to ascertain your buying amount such as $10000 and then have the average daily trading value be your comfortable moving average more such as average liquidity is more than 10 x MA(close x volume) or $100000 in this example. The value is extremely important for small and micro cap stocks you may wish to purchase.
M2 Global Liquidity Index [Custom Offsets]M2 Global Liquidity Index
Plots the global M2 money supply alongside price, with two user-configurable forward shifts to help you anticipate macro-driven moves in BTC (or any asset).
Key Features
Current M2 Index (no offset)
Offset A — shift M2 forward by N days (default 78)
Offset B — shift M2 forward by M days (default 109)
Extended Currencies toggle adds 9 additional central banks (CHF, CAD, INR, RUB, BRL, KRW, MXN, ZAR)
All lines share the left-hand axis and scale to trillions
Inputs
Offset A (days): integer ≥ 0 (default 78)
Offset B (days): integer ≥ 0 (default 109)
Include extended currencies?: on/off
How to Use
Add the indicator to any chart (overlay mode).
In Settings → Inputs, enter your desired lead times for Offset A and Offset B.
Toggle extended currencies if you need a broader “global liquidity” view.
Watch how price action (e.g. BTC) tracks the shifted M2 lines to spot potential turning points.
Why It Matters
Changes in money supply often lead risk assets by several weeks to months. This tool makes it easy to visualize and test those correlations directly on your favorite timeframe.
ICT Liquidity Sweep MAX RETRI (ALERT)Strategy Description: SMC + ICT Reversal Sniper | 5-Min | R2 TP
This strategy applies Smart Money Concepts (SMC) and ICT methodology to identify high-probability reversal trades using a clean, rule-based system designed for the 5-minute timeframe.
⸻
Core Logic:
• Liquidity Sweep: Identifies stop hunts beyond recent swing highs/lows using a configurable lookback window.
• Break of Structure (BOS): Validates a directional shift after the sweep.
• Fixed R2 Risk-Reward: Entry is followed by a 2:1 take-profit target. Stop loss is set at the sweep candle’s high/low.
• No Entry Between 8 PM–12 AM NY Time: Avoids the manipulation-prone and illiquid zone.
• Discreet SL Handling: SL hits close trades silently — no labels or visuals.
⸻
Entry Precision & Timing Notes:
• The strategy may occasionally fire before a confirmed liquidity sweep — this is expected. If a sweep occurs later, you may still re-enter toward equilibrium, with take profit also targeted at equilibrium.
• Alerts or trades that trigger near 9:30 AM NY often align with real direction, but this time can be volatile.
• For more reliable and lower-risk entries, focus on the 1:30 PM to 2:00 PM silver bullet window, which tends to produce cleaner setups with more favorable flow. 🖤

JJ Highlight Time Ranges with First 5 Minutes and LabelsTo effectively use this Pine Script as a day trader , here’s how the various elements can help you manage trades, track time sessions, and monitor price movements:
Key Components for a Day Trader:
1. First 5-Minute Highlight:
- Purpose: Day traders often rely on the first 5 minutes of the trading session to gauge market sentiment, watch for opening price gaps, or plan entries. This script draws a horizontal line at the high or low of the first 5 minutes, which can act as a key level for the rest of the day.
- How to Use: If the price breaks above or below the first 5-minute line, it can signal momentum. You might enter a long position if the price breaks above the first 5-minute high or a short if it breaks below the first 5-minute low.
2. Session Time Highlights:
- Morning Session (9:15–10:30 AM): The market often shows its strongest price action during the first hour of trading. This session is highlighted in yellow. You can use this highlight to focus on the most volatile period, as this is when large institutional moves tend to occur.
- Afternoon Session (12:30–2:55 PM): The blue highlight helps you track the mid-afternoon session, where liquidity may decrease, and price action can sometimes be choppier. Day traders should be more cautious during this period.
- How to Use: By highlighting these key times, you can:
- Focus on key breakouts during the morning session.
- Be more conservative in your trades during the afternoon, as market volatility may drop.
3. Dynamic Labels:
- Top/Bottom Positioning: The script places labels dynamically based on the selected position (Top or Bottom). This allows you to quickly glance at the session's start and identify where you are in terms of time.
- How to Use: Use these labels to remind yourself when major time segments (morning or afternoon) begin. You can adjust your trading strategy depending on the session, e.g., being more aggressive in the morning and more cautious in the afternoon.
Trading Strategy Suggestions:
1. Momentum Trades:
- After the first 5 minutes, use the high/low of that period to set up breakout trades.
- Long Entry: If the price breaks the high of the first 5 minutes (especially if there's a strong trend).
- Short Entry: If the price breaks the low of the first 5 minutes, signaling a potential downtrend.
2. Session-Based Strategy:
- Morning Session (9:15–10:30 AM):
- Look for strong breakout patterns such as support/resistance levels, moving average crossovers, or candlestick patterns (like engulfing candles or pin bars).
- This is a high liquidity period, making it ideal for executing quick trades.
- Afternoon Session (12:30–2:55 PM):
- The market tends to consolidate or show less volatility. Scalping and mean-reversion strategies work better here.
- Avoid chasing big moves unless you see a clear breakout in either direction.
3. Support and Resistance:
- The first 5-minute high/low often acts as a key support or resistance level for the rest of the day. If the price holds above or below this level, it’s an indication of trend continuation.
4. Breakout Confirmation:
- Look for breakouts from the highlighted session time ranges (e.g., 9:15 AM–10:30 AM or 12:30 PM–2:55 PM).
- If a breakout happens during a key time window, combine that with other technical indicators like volume spikes , RSI , or MACD for confirmation.
---
Example Day Trader Usage:
1. First 5 Minutes Strategy: After the market opens at 9:15 AM, watch the price action for the first 5 minutes. The high and low of these 5 minutes are critical levels. If the price breaks above the high of the first 5 minutes, it might indicate a strong bullish trend for the day. Conversely, breaking below the low may suggest bearish movement.
2. Morning Session: After the first 5 minutes, focus on the **9:15 AM–10:30 AM** window. During this time, look for breakout setups at key support/resistance levels, especially when paired with high volume or momentum indicators. This is when many institutions make large trades, so price action tends to be more volatile and predictable.
3. Afternoon Session: From 12:30 PM–2:55 PM, the market might experience lower volatility, making it ideal for scalping or range-bound strategies. You could look for reversals or fading strategies if the market becomes too quiet.
Conclusion:
As a day trader, you can use this script to:
- Track and react to key price levels during the first 5 minutes.
- Focus on high volatility in the morning session (9:15–10:30 AM) and **be cautious** during the afternoon.
- Use session-based timing to adjust your strategies based on the time of day.

Enigma Liquidity Concept
Enigma Liquidity Concept
Empowering Traders with Multi-Timeframe Analysis and Dynamic Fibonacci Insights
Overview
The Enigma Liquidity Concept is an advanced indicator designed to bridge multi-timeframe price action with Fibonacci retracements. It provides traders with high-probability buy and sell signals by combining higher time frame market direction and lower time frame precision entries. Whether you're a scalper, day trader, or swing trader, this tool offers actionable insights to refine your entries and exits.
What Makes It Unique?
Multi-Timeframe Signal Synchronization:
Higher time frame bullish or bearish engulfing patterns are used to define the directional bias.
Lower time frame retracements are analyzed for potential entry opportunities.
Dynamic Fibonacci Layouts:
Automatically plots Fibonacci retracement levels for the most recent higher time frame signal.
Ensures a clean chart by avoiding clutter from historical signals.
Actionable Buy and Sell Signals:
Sell Signal: When the higher time frame is bearish and the price on the lower time frame retraces above the 50% Fibonacci level before forming a bearish candle.
Buy Signal: When the higher time frame is bullish and the price on the lower time frame retraces below the 50% Fibonacci level before forming a bullish candle.
Customizable Fibonacci Visuals:
Full control over Fibonacci levels, line styles, and background shading to tailor the chart to your preferences.
Integrated Alerts:
Real-time alerts for buy and sell signals on the lower time frame.
Alerts for bullish and bearish signals on the higher time frame.
How It Works
Higher Time Frame Analysis:
The indicator identifies bullish and bearish engulfing patterns to detect key reversals or continuation points.
Fibonacci retracement levels are calculated and plotted dynamically for the most recent signal:
Bullish Signal: 100% starts at the low, 0% at the high.
Bearish Signal: 100% starts at the high, 0% at the low.
Lower Time Frame Execution:
Monitors retracements relative to the higher time frame Fibonacci levels.
Provides visual and alert-based buy/sell signals when conditions align for a high-probability entry.
How to Use It
Setup:
Select your higher and lower time frames in the settings.
Customize Fibonacci levels, line styles, and background visuals for clarity.
Trade Execution:
Use the higher time frame signals to determine directional bias.
Watch for actionable buy/sell signals on the lower time frame:
Enter short trades on red triangle sell signals.
Enter long trades on green triangle buy signals.
Alerts:
Enable alerts for real-time notifications of buy/sell signals on lower time frames and higher time frame directional changes.
Concepts Underlying the Calculations
Engulfing Patterns: Represent key reversals or continuations in price action, making them reliable for defining directional bias on higher time frames.
Fibonacci Retracements: Fibonacci levels are used to identify critical zones for potential price reactions during retracements.
Multi-Timeframe Analysis: Combines the strength of higher time frame trends with the precision of lower time frame signals to enhance trades.
Important Notes
This indicator is best used in conjunction with your existing trading strategy and risk management plan.
It does not repaint signals and ensures clarity by displaying Fibonacci levels only for the most recent signal.
Ideal For:
Swing traders, day traders, and scalpers looking to optimize entries and exits with Fibonacci retracements.
Traders who prefer clean charts with actionable insights and customizable visuals.

Liquidations [ChartPrime]Liquidations Indicator:
The Liquidations indicator is a powerful tool designed to help traders identify significant liquidation levels in financial markets. By analyzing volume data over a specified lookback period, the indicator highlights potential areas where market participants with high leverage positions may face liquidation, providing valuable insights into market dynamics.
Usage:
Traders can use the Liquidations indicator to:
◈ Identify liquidity grab opportunities: Liquidation levels often attract price action as market participants with leveraged positions face the risk of forced liquidation. Traders can anticipate price movements as the market aims to trigger these stops, potentially leading to rapid price movements or reversals.
◈ Confirm trend strength: A cluster of liquidation levels in the same direction as the prevailing trend may confirm the strength of the trend, while divergences between liquidation levels and price movements may signal potential trend reversals.
Settings:
◈ Previous Value Bars Back: Specifies the number of previous bars used in calculating the liquidation levels.
◈ Show Leverage: Allows users to selectively display liquidation levels for different leverage multiples, including 5x, 10x, 25x, 50x, and 100x.
◈ Liquidation Levels Width: Sets the width of the lines representing liquidation levels on the chart.
◈ Short Liquidations Color: Specifies the color of the lines representing short liquidation levels.
◈ Long Liquidations Color: Specifies the color of the lines representing long liquidation levels.
◈ Bar Color: Sets the color of the background bar when the indicator is active.
Visual Representation:
◈ Liquidation levels are plotted as horizontal lines on the chart, with different colors representing short and long liquidation levels.
◈ Each liquidation level is labeled with the corresponding leverage multiple (e.g., 5x, 10x, etc.).
A dashboard displays the active liquidation levels for each leverage multiple, allowing traders to quickly assess the current market conditions.
◈ Time Window allows users to cut off unnecessary part of the chart and concentrate on a current active part of the chart to make better trading decisions:
Interpretation:
Market participants tend to place stop-loss orders near liquidation levels , creating clusters of pending orders. As price approaches these levels, it may trigger a cascade of stop-loss orders, providing liquidity for market orders and potentially leading to rapid price movements in the opposite direction.
Traders can anticipate price reversals or accelerations as price interacts with liquidation levels, using them as reference points for identifying potential entry or exit opportunities.
Note:
While the Liquidations indicator provides valuable insights into market dynamics, traders should use it in conjunction with other technical analysis tools and risk management strategies to make informed trading decisions.

Volume Profile with Node Detection [LuxAlgo]The Volume Profile with Node Detection is a charting tool that allows visualizing the distribution of traded volume across specific price levels and highlights significant volume nodes or clusters of volume nodes that traders may find relevant in utilizing in their trading strategies.
🔶 USAGE
The volume profile component of the script serves as the foundation for node detection while encompassing all the essential features expected from a volume profile. See the sub-sections below for more detailed information about the indicator components and their usage.
🔹 Peak Volume Node Detection
A volume peak node is identified when the volume profile nodes for the N preceding and N succeeding nodes are lower than that of the evaluated one.
Displaying peak volume nodes along with their surrounding N nodes (Zones or Clusters) helps visualize the range, typically representing consolidation zones in the market. This feature enables traders to identify areas where trading activity has intensified, potentially signaling periods of price consolidation or indecision among market participants.
🔹 Trough Volume Node Detection
A volume trough node is identified when the volume profile nodes for the N preceding and N succeeding nodes are higher than that of the evaluated one.
🔹 Highest and Lowest Volume Nodes
Both the highest and lowest volume areas play significant roles in trading. The highest volume areas typically represent zones of strong price acceptance, where a significant amount of trading activity has occurred. On the other hand, the lowest volume areas signify price levels with minimal trading activity, often indicating zones of price rejection or areas where market participants have shown less interest.
🔹 Volume profile
Volume profile is calculated based on the volume of trades that occur at various price levels within a specified timeframe. It divides the price range into discrete price intervals, typically known as "price buckets" or "price bars," and then calculates the total volume of trades that occur at each price level within those intervals. This information is then presented graphically as a histogram or profile, where the height of each bar represents the volume of trades that occurred at that particular price level.
🔶 SETTINGS
🔹 Volume Nodes
Volume Peaks: Toggles the visibility of either the "Peaks" or "Clusters" on the chart, depending on the specified percentage for detection.
Node Detection Percent %: Specifies the percentage for the Volume Peaks calculation.
Volume Troughs: Toggles the visibility of either the "Troughs" or "Clusters" on the chart, depending on the specified percentage for detection.
Node Detection Percent %: Specifies the percentage for the Volume Troughs calculation.
Volume Node Threshold %: A threshold value specified as a percentage is utilized to detect peak/trough volume nodes. If a value is set, the detection will disregard volume node values lower than the specified threshold.
Highest Volume Nodes: Toggles the visibility of the highest nodes for the specified count.
Lowest Volume Nodes: Toggles the visibility of the lowest nodes for the specified count.
🔹 Volume Profile - Components
Volume Profile: Toggles the visibility of the volume profile with either classical display or gradient display.
Value Area Up / Down: Color customization option for the volume nodes within the value area of the profile.
Profile Up / Down Volume: Color customization option for the volume nodes outside of the value area of the profile.
Point of Control: Toggles the visibility of the point of control, allowing selection between "developing" or "regular" modes. Sets the color and width of the point of control line accordingly.
Value Area High (VAH): Toggles the visibility of the value area high level and allows customization of the line color.
Value Area Low (VAL): Toggles the visibility of the value area low level and allows customization of the line color.
Profile Price Labels: Toggles the visibility of the Profile Price Levels and allows customization of the text size of the levels.
🔹 Volume Profile - Display Settings
Profile Lookback Length: Specifies the length of the profile lookback period.
Value Area (%): Specifies the percentage for calculating the value area.
Profile Placement: Specify where to display the profile.
Profile Number of Rows: Specify the number of rows the profile will have.
Profile Width %: Adjusts the width of the rows in the profile relative to the profile range.
Profile Horizontal Offset: Adjusts the horizontal offset of the profile when it is selected to be displayed on the right side of the chart.
Value Area Background: Toggles the visibility of the value area background and allows customization of the fill color.
Profile Background: Toggles the visibility of the profile background and allows customization of the fill color.
🔶 RELATED SCRIPTS
Supply-Demand-Profiles
Liquidity-Sentiment-Profile
Thanks to our community for recommending this script. For more conceptual scripts and related content, we welcome you to explore by visiting >>> LuxAlgo-Scripts .

Money Flow Profile [LuxAlgo]The Money Flow Profile is a charting tool that measures the traded volume or the money flow at all price levels on the market over a specified time period and highlights the relationship between the price of a given asset and the willingness of traders to either buy or sell it, allowing traders to reveal dominant and/or significant price levels and to analyze the trading activity of a particular user-selected range.
This tool combines a volume/money flow profile, a sentiment profile, and price levels, where the right side of the profile highlights the distribution of the traded activity/money flow at different price levels, the left side of the profile highlights the market sentiment at those price levels, and in the middle the price levels.
🔶 USAGE
A volume/money flow profile is an advanced charting tool that displays the traded volume/money flow at different price levels over a specific period. It helps traders visualize where the majority of trading activity/money flow has occurred.
A sentiment profile is a difference between buy and sell volume/money flow aiming to highlight the sentiment/dominance at specific price levels.
Each row of the profile presents figures on volume and money flow specific to price levels.
High volume/money flow nodes indicate areas of high activity and are likely to act as support or resistance in the future. They attract price and try to hold it there. Conversely, low-volume nodes are areas with low trading activity, that are less subject to get revisited by the price. The market often bounces right over these levels, not staying for long. The "Profile Heatmap" option of the script helps to better emphasize the trading activity within each areas.
By measuring the traded activity at each price level the script presents an ability to highlight the consolidation zones, in other words, highlights accumulation and distribution zones. When the price moves toward one end of the consolidation and volume pick up, it can foreshadow a potential breakout.
Level of Significance, Point of Control, Highest Sentiment Zone, and Profile Price levels are some of the other profile-related options available with the script.
🔶 SETTINGS
The script takes into account user-defined parameters and plots the profiles, where detailed usage for each user-defined input parameter in indicator settings is provided with the related input's tooltip.
🔹 Profile Generic Settings
Lookback Length / Fixed Range: Sets the lookback length.
Profile Source: Sets the profile source, Volume, or Money Flow.
🔹 Profile Presentation Settings
Volume/Money Flow Profile: Toggles the visibility of the Volume/Money Flow Profile.
High Traded Nodes: Threshold and Color option for high traded nodes.
Average Traded Nodes: Color option for average traded nodes.
Low Traded Nodes: Threshold and Color option for low traded nodes.
🔹 Sentiment Profile Settings
Sentiment Profile: Toggles the visibility of the Sentiment Profile.
Sentiment Polarity Method: Sets the method used to calculate the up/down volume/money flow.
Bullish Nodes: Color option for Bullish Nodes.
Bearish Nodes: Color option for Bearish Nodes.
🔹 Profile Heatmap Settings
Profile Heatmap: Toggles the visibility of the profile heatmap.
Heatmap Source: Sets the source of the profile heatmap, Volume/Money Flow Profile, or Sentiment Profile.
Heatmap Transparency: Control the transparency of the profile heatmap.
🔹 Other Presentation Settings
Level of Significance: Toggles the visibility of the level of significance line/zone.
Consolidation Zones: Toggles the visibility of the consolidation zones.
Consolidation Threshold, Color: Sets the threshold value and zone color.
Highest Sentiment Zone: Toggles the visibility of the highest bullish or bearish sentiment zone.
Profile Price Levels, Color, Size: Toggles the visibility of the profile price levels, and sets the color and the size of the level labels.
Profile Range Background Fill: Toggles the visibility of the profiles range.
🔹 Other Settings
Number of Rows: Specify how many rows each profile histogram will have.
Profile Width %: Alters the width of the rows in the histogram, relative to the profile length
Profile Text Size: Alters the size of the text. Setting to Auto will keep the text within the box limits.
Profile Horizontal Offset: Enables to move profile in the horizontal axis.
🔶 RELATED SCRIPTS
Liquidity-Sentiment-Profile
Swing-Volume-Profiles
For more and other conceptual scripts you are kindly invited to visit LuxAlgo-Scripts .

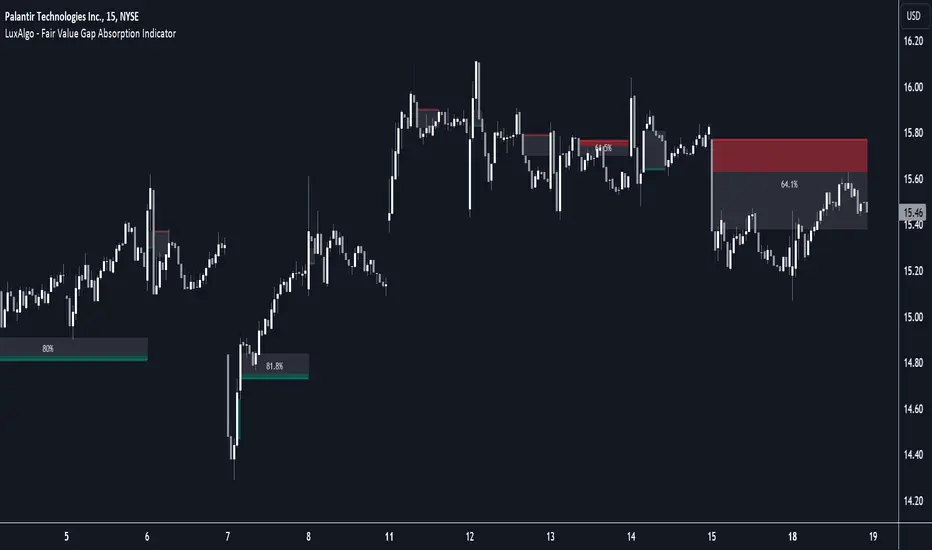
Fair Value Gap Absorption Indicator [LuxAlgo]The Fair Value Gap Absorption Indicator aims to detect fair value gap imbalances and tracks the mitigation status of the detected fair value gap by highlighting the mitigation level till a new fair value gap is detected.
The Fair Value Gap (FVG) is a widely utilized tool among price action traders to detect market inefficiencies or imbalances. These imbalances arise when buying or selling pressure is significant, resulting in a large upward or downward move, leaving behind an imbalance in the market.
🔶 USAGE
A fair value gap appears in a triple-candle pattern when there is a large candle whose previous candle’s high and subsequent candle’s low do not fully overlap the large candle. The space between these wicks is known as the fair value gap.
Price can come back to these imbalance areas and mitigate them, however, this is sometimes a process involving multiple bars, the displayed imbalances by the indicator allow tracking the current mitigation level of a displayed imbalance.
Fair value gaps can become a magnet for the price before continuing in the same direction. Traders commonly wait for the price to revert toward the fair value gap to clear out the imbalance before continuing to move toward the prevailing trend.
🔶 SETTINGS
🔹Fair Value Gaps
Fair Value Gap Width Filter: defines the filtering multiplier, please refer to the tooltip of the input option for further details.
Bullish, Imbalance and Mitigation: color customization option.
Bearish, Imbalance and Mitigation: color customization option.
Display Percentage of Mitigation: Display the percentage of the mitigation areas.
Historical Fair Value Gaps: toggles the visibility of the historical fair value gaps.
🔶 LIMITATIONS
Please note that filtering cannot be applied for the first 144 (atr fixed-length) candles since the atr value won't be present that is used for filtering.
🔶 RELATED SCRIPTS
Fair-Value-Gap
HTF-Fair-Value-Gap
Liquidity-Voids-FVG
VOLD Ratio (Volume Difference Ratio) by TenozenAnother helpful indicator is here! VOLD Ratio is calculated by the net volume of a buying candle, divided by the net volume of a sell candle.
Formula:
buying net volume/selling net volume
It's a simple indicator, but don't underestimate this simplicity. It's a powerful indicator that would help you to decide whether the volume is getting interested in the direction that the market would take. So assume when the market is above the Bollinger Bands, it means that the volume is at a buying extreme, by that, we could expect the market to get back towards the mean, as there is a lot of buying demand that entered the market. How about below the Bollinger Bands? it means that the volume is at a selling extreme, we could expect that there is a lot of volume getting in toward the sellers, so we could take advantage of the opportunity to go for a long. Lastly, the Bollinger Bands would help you guys to determine the liquidity of the market, if the Bollinger Bands get smaller over time, it means there is no interest for the market to enter yet, and if the Bollinger Bands get bigger over time, it means there is interest for the market to enter in the session.
Tips & Reminder:
- We shouldn't use this indicator by itself, make sure to use an Indicator that would help you guys to determine the momentum and the liquidity of the market.
- The higher the timeframe, the slower this indicator would signal an entry, by that use a smaller timeframe... I suggest using a 15M chart for the execution.
- Always trade in the medium-longterm direction if you want to have a high probability trade.
- Be patient in your execution, it's more likely the market would go higher or lower after going in the extreme of the Bollinger Bands.
Well, that's it! Hope you guys enjoy using this indicator, let me know if there is any question or suggestion. Ciao...

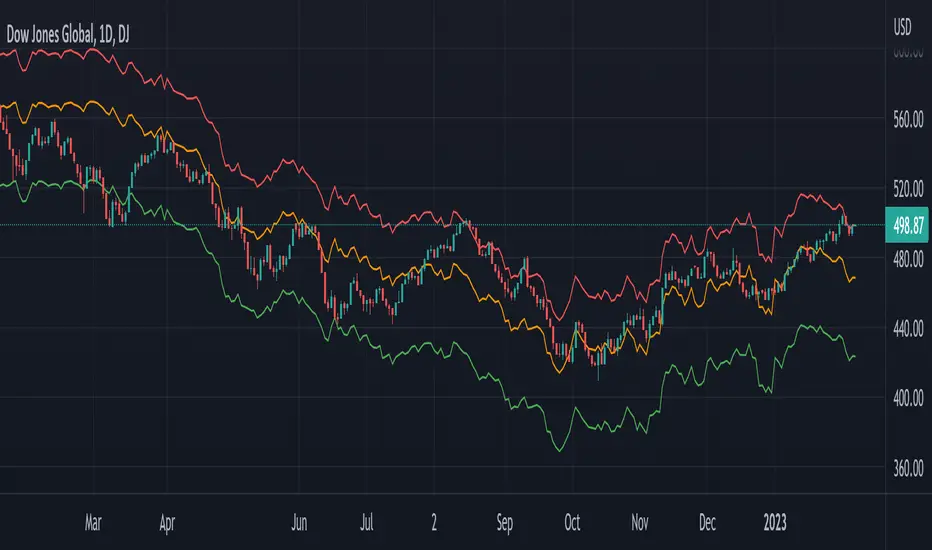
Global Net Liquidity - Dow Jones Global Fair ValueThis is similar to Global Net Liquidity - SPX Fair Value except it's for Dow Jones Global (symbol: W1DOW here on TradingView).
This is experimental and may change at any time.
Fed LiquidityFed liquidity model based on #MaxJAnderson's work. Incorporates the Treasury General Account, Reverse Repo and Fed balance sheet to determine how much "net liquidity" is available to markets. Very much a beta version.

Futures Exchange Sessions 2.0Description
Successor to Futures Exchange Sessions indicator. Completely rebuilt code from the ground up. Every feature has been redesigned and refactored to be the most beneficial while allowing for complete configuration by the user.
This indicator displays Futures Sessions as live boxes that expand dynamically as price moves over the time interval. These boxes make liquidity levels extremely easy to spot and visualize. It helps the user identify market structure and develop their own bias of price action. Everything about the Session boxes can be configured. Box color, border color, border style, and border width are all individually controllable. Each Future Session can be turned on or off at any time. Also, each box has their own text label (Asian Session, London Session, New York Session) and this text can be moved around the box, change color, and change size.
Previous days highs and lows (major liquidity levels) are always important to the futures trader. This indicator now allows the user to individually display the three previous days highs and low levels as lines with optional label. Each line can be independently toggled on or off and like always, every conceivable customization option is available to the user. And the labels can be moved to the right (via the Input Settings) to allow unobstructed views of candles.
The midnight EST open and 8:30 AM EST open horizontal lines (developed by the Inner Circle Trader) are returning in this indicator. But the biggest improvement is that the lines stop at the current bar or the last bar of the trading day. Additionally, the time lines are displayed on previous days so the user can easily see how the candles reacted to these important times of the day.
The Session boxes and the horizontal time lines now can be set to only display a certain number of day back. If the user wants just to see Session boxes for the previous day only, they can do that. If the user wants to see the last 15 days of boxes or lines it is very easy to increase the days back in the settings. Currently, the max days back is 80 calendar days.
Additional Images
Easily visualize and understand price action across time
Everything is customizable so the user can easily match this indicator to their color preferences
Special Notes
To turn off box session text set opacity to 0%
Boxes and horizontal time lines only display when timeframe is <= 30 minute

[A618] Liquidity Levels Based OBV SR with KAMAWe all know OBV plays a very important role in figuring out price volume divergences and it can help anyone analyse the directivity force of the market and has a very good tradeoff if applied correctly
In this Experiment i have derived liquidity levels for OBV using volume jumps inside the market
A volume jump is classified as:
Good Volume Jump = 1.618 times the Average Volume (WMA or 2pole ButterWorth's Filter of Volume)
Great Volume Jump = 2 times the Average Volume (WMA or 2pole ButterWorth's Filter of Volume)
Extreme Volume Jump = 3 times the Average Volume (WMA or 2pole ButterWorth's Filter of Volume)
So the horizontal levels which you see on the indicator (colored in red/ blue / gray lines) are the derived Liquidity Levels for OBV in the Market, these are the levels where OBV is most likely to perform a movement or come back
Also I have applied KAMA indicator on top of OBV for better Directive guidance, as of my experiments KAMA seems to be most stable and consistence of all the other moving averages,
KAMA's Length inculde:
KAMA - 8
KAMA - 34
KAMA - 200
Hope this Script help you guys!
Thanks to Tradingview for providing such an awesome platform
##Note for Credits ::
The Ehlers 2 pole butterworth Filter function is derived from @cheatcountry script ()

3SPC Three Candle Price Action Setup3SPC (Three Candle Price Action Setup) is an open-source indicator designed to detect
a simple and clearly defined three-candle price action pattern.
The logic is based on the following structure:
• The first two candles move in the same direction (bullish or bearish).
• The third candle interacts with the real bodies of both previous candles,
which may indicate a short-term liquidity sweep or price reaction.
• A bullish setup is confirmed when price holds above the open of the first candle.
• A bearish setup is confirmed when price holds below the open of the first candle.
This script does not use oscillators or lagging indicators.
It is intended as a visual aid for discretionary traders and should be used
together with market context, risk management and higher timeframe analysis.
The script is published as open-source for educational and transparency purposes.
UI Labels Translation:
- نمایش ستاپ صعودی: Show bullish setups
- نمایش ستاپ نزولی: Show bearish setups
