Pure Price Action Liquidity Sweeps [LuxAlgo]The Pure Price Action Liquidity Sweeps indicator is a pure price action adaptation of our previously published and highly popular Liquidity-Sweeps script.
Similar to its earlier version, this indicator detects the presence of liquidity sweeps on the user's chart, while also identifying potential areas of support/resistance or entry when liquidity levels are taken. The key difference, however, is that this price action version relies solely on price patterns, eliminating the need for numerical swing length settings.
🔶 USAGE
A Liquidity Sweep occurs when the price breaks through a liquidity level , after which the price returns below/above the liquidity level , forming a wick.
The examples below show a bullish and bearish scenario of "a wick passing through a liquidity level where the price quickly comes back".
Short-term liquidity sweep detection is based on short-term swing levels. Some of these short-term levels, depending on further market developments, may evolve into intermediate-term levels and, in the long run, become long-term levels. Therefore, enabling short-term detection with the script means showing all levels, including minor and temporal ones. Depending on the trader's style, some of these levels may be considered noise. Enabling intermediate and long-term levels can help filter out this noise and provide more significant levels for trading decisions. For further details on how swing levels are identified please refer to the details section.
The Intermediate-term option selection for the same chart as above, filters out minor or noisy levels, providing clearer and more significant levels for traders to observe.
🔶 DETAILS
The swing points detection feature relies exclusively on price action, eliminating the need for numerical user-defined settings.
The first step involves detecting short-term swing points, where a short-term swing high (STH) is identified as a price peak surrounded by lower highs on both sides. Similarly, a short-term swing low is recognized as a price trough surrounded by higher lows on both sides.
Intermediate-term swing and long-term swing points are detected using the same approach but with a slight modification. Instead of directly analyzing price candles, we now utilize the previously detected short-term swing points. For intermediate-term swing points, we rely on short-term swing points, while for long-term swing points, we use the intermediate-term ones.
🔶 SETTINGS
Detection: Period options of the detected swing points.
🔶 RELATED SCRIPTS
Pure-Price-Action-Structures.
Liquidity-Sweeps.
Cari dalam skrip untuk "liquidity"

[TehThomas] - ICT Liquidity sweepsThe ICT Liquidity Sweeps Indicator is designed to track liquidity zones in the market areas where stop-losses and pending orders are typically clustered. This indicator marks buyside liquidity (resistance) and sellside liquidity (support), helping traders identify areas where price is likely to manipulate liquidity before making a significant move.
This tool is based on Inner Circle Trader (ICT) Smart Money Concepts, which emphasize how institutional traders, or “Smart Money,” manipulate liquidity to fuel price movements. By identifying these zones, traders can anticipate liquidity sweeps and position themselves accordingly.
⚙️ How It Works
1️⃣ Detects Key Liquidity Zones
The script automatically identifies significant swing highs and swing lows in price action using a pivot-based method.
A swing high (buyside liquidity) is a peak where price struggles to break higher, forming a resistance level.
A swing low (sellside liquidity) is a valley where price struggles to go lower, creating a support level.
These liquidity points are prime targets for liquidity sweeps before a true trend direction is confirmed.
2️⃣ Draws Liquidity Lines
Once a swing high or low is identified, a horizontal line is drawn at that level.
The lines extend to the right, serving as future liquidity targets until they are broken.
The indicator allows customization in terms of color, line width, and maximum number of liquidity lines displayed at once.
3️⃣ Handles Liquidity Sweeps
When price breaks a liquidity level, the indicator reacts based on the chosen action setting:
Dotted/Dashed: The line remains visible but changes style to indicate a sweep.
Delete: The line is completely removed once price has interacted with it.
This feature ensures that traders can easily spot where liquidity has been taken and determine whether a reversal or continuation is likely.
4️⃣ Prevents Chart Clutter
To maintain a clean chart, the script limits the number of liquidity lines displayed at any given time.
When new liquidity zones are formed, the oldest lines are automatically removed, keeping the focus on the most relevant liquidity zones.
🎯 How to Use the ICT Liquidity Sweeps Indicator
🔍 Identifying Liquidity Grabs
This indicator helps you identify areas where Smart Money is targeting liquidity before making a move.
Buyside Liquidity (BSL) Sweeps:
Occur when price spikes above a resistance level before reversing downward.
Indicate that Smart Money has hunted stop-losses and buy stops before driving price lower.
Sellside Liquidity (SSL) Sweeps:
Occur when price drops below a support level before reversing upward.
Indicate that Smart Money has collected liquidity from stop-losses and sell stops before pushing price higher.
📈 Combining with Market Structure Shifts (MSS)
One of the best ways to use this indicator is in conjunction with our Market Structure Shifts Indicator.
Liquidity sweeps + MSS Confirmation give strong high-probability trade setups:
Wait for a liquidity sweep (price takes out a liquidity level).
Look for an MSS in the opposite direction (e.g., price sweeps a high, then breaks a recent low).
Enter the trade in the new direction with stop-loss above/below the liquidity sweep.
📊 Entry & Exit Strategies
Long Trade Example:
Price sweeps a key sellside liquidity level (SSL) → creates a false breakdown.
MSS confirms a reversal (price breaks structure upwards).
Enter long position after confirmation.
Stop-loss below the liquidity grab to minimize risk.
Short Trade Example:
Price sweeps a key buyside liquidity level (BSL) → takes liquidity above resistance.
MSS confirms a bearish move (price breaks a key support level).
Enter short position after confirmation.
Stop-loss above the liquidity grab.
🚀 Why This Indicator is a Game-Changer
✅ Helps Identify Smart Money Manipulation – Understand where institutions are likely to grab liquidity before the real move happens.
✅ Enhances Market Structure Analysis – When paired with MSS, liquidity sweeps become powerful signals for trend reversals.
✅ Filters Out False Breakouts – Many traders get caught in liquidity grabs. This indicator helps avoid bad entries.
✅ Keeps Your Chart Clean – The auto-limiting feature ensures that only the most relevant liquidity levels remain visible.
✅ Works on Any Timeframe – Whether you’re a scalper, day trader, or swing trader, liquidity concepts apply universally.
📌 Final Thoughts
The ICT Liquidity Sweeps Indicator is a must-have tool for traders who follow Smart Money Concepts. By tracking liquidity levels and highlighting sweeps, it allows traders to enter trades with precision while avoiding false breakouts.
When combined with Market Structure Shifts (MSS), this strategy becomes even more powerful, offering traders an edge in spotting reversals and timing entries effectively.
__________________________________________
Thanks for your support!
If you found this idea helpful or learned something new, drop a like 👍 and leave a comment—I’d love to hear your thoughts! 🚀
Make sure to follow me for more price action insights, free indicators, and trading strategies. Let’s grow and trade smarter together! 📈✨

Draw on Liquidity [PhenLabs]📊 Draw on Liquidity (DOL) Indicator
Version: PineScript™ v6
Description
The Draw on Liquidity (DOL) indicator is an advanced technical analysis tool designed to identify and visualize significant liquidity zones in the market. It combines volume analysis, pivot point detection, and real-time proximity alerts to help traders identify potential support and resistance levels where significant trading activity occurs. The indicator features dual display modes, adaptive volume thresholds, and a comprehensive real-time dashboard.
🔧 Components
• Liquidity Detection: Advanced pivot point analysis with volume validation
• Volume Analysis: Adaptive volume threshold system
• Display Modes: Historical and Current visualization options
• Proximity Detection: Real-time price-to-level distance monitoring
• Visual Dashboard: Dynamic status display with alert system
🚨 Important Dashboard Features 🚨
The dashboard provides real-time information about:
• High Draw Zones: Resistance levels with significant liquidity
• Low Draw Zones: Support levels with high trading activity
• Current Price: Real-time price monitoring
• Active Alerts: Proximity warnings when price approaches liquidity zones
📈 Visualization
• Historical Mode: Displays all past and present liquidity zones
• Current Mode: Shows only active, unhit liquidity levels
• Color-coded lines: Blue for high liquidity, Red for low liquidity
• Dynamic line extension: Updates with price movement
• Alert indicators: Visual signals when price approaches zones
Historical Visualization
Current Visualization
📌 Usage Guidelines
The indicator is highly customizable with several key parameters:
Pivot Settings:
• Shorter lengths (3-7): More frequent zones, suitable for scalping
• Longer lengths (7-15): Major zones, better for swing trading
Volume Analysis:
• Lower multiplier (1.5-2.0): More zones, higher sensitivity
• Higher multiplier (2.0-3.0): Major zones only, reduced noise
✅ Best Practices:
• Start with default settings and adjust based on timeframe
• Use Historical mode for analysis, Current mode for active trading
• Monitor dashboard alerts for potential trade setups
• Combine with trend analysis for better entry/exit points
⚠️ Limitations
• Requires sufficient volume data for accurate analysis
• Performance varies with market volatility
• Historical mode may become visually cluttered on longer timeframes
• Best performance during regular market hours
What Makes This Unique
• Dual Display System: Choose between historical analysis and current trading modes
• Volume-Validated Zones: Only marks levels with significant trading activity
• Real-time Proximity Alerts: Dynamic warnings when approaching liquidity zones
• Adaptive Threshold System: Automatically adjusts to market conditions
• Comprehensive Dashboard: All-in-one view of current market status
🔧 How It Works
The indicator processes market data through three main components:
1. Liquidity Detection (40% weight):
• Identifies pivot points using customizable lookback periods
• Validates levels with volume analysis
• Marks significant zones based on combined criteria
2. Volume Analysis (40% weight):
• Calculates dynamic volume thresholds
• Compares current volume to moving average
• Filters out low-volume noise
3. Proximity Analysis (20% weight):
• Monitors price distance to active zones
• Triggers alerts based on customizable thresholds
• Updates dashboard status in real-time
💡 Note: For optimal results, combine with price action analysis and consider using multiple timeframes for confirmation. The indicator performs best in markets with consistent volume and clear trend structure.

Quantura - Liquidity Sweep & Run LevelsIntroduction
“Quantura – Liquidity Sweep & Run Levels” is a structural price-action indicator designed to automatically detect swing-based liquidity zones and visualize potential sweep and run events. It helps traders identify areas where liquidity has likely been taken (sweep) or released (run), improving precision in market structure analysis and timing of entries or exits.
Originality & Value
This tool translates institutional liquidity concepts into an automated visual framework. Instead of simply marking highs and lows, it dynamically monitors swing points, tracks their breaches, and identifies subsequent reactions. The indicator is built to highlight the liquidity dynamics that often precede reversals or continuations.
Its originality lies in:
Automatic identification and tracking of swing highs and lows.
Real-time detection of broken levels and liquidity sweeps.
Distinction between “Run” and “Sweep” modes for different market behaviors.
Persistent historical visualization of liquidity levels using clean line structures.
Configurable signal markers for bullish and bearish sweep confirmations.
Functionality & Core Logic
Detects swing highs and lows using a user-defined Swing Length parameter.
Stores and updates all swing levels dynamically with arrays for efficient memory handling.
Draws horizontal lines from each detected swing point to visualize potential liquidity zones.
Monitors when price breaks a swing level and marks that event as “broken.”
Generates signals when the market either sweeps above/below or runs away from those levels, depending on the chosen mode.
Provides optional visual signal markers (“▲” for bullish sweeps, “▼” for bearish sweeps).
Parameters & Customization
Mode: Choose between “Sweep” (detects liquidity grabs) or “Run” (detects breakout continuations).
Swing Length: Sets the sensitivity for detecting swing highs/lows. A higher value focuses on larger structures, while smaller values detect micro liquidity points.
Bullish Color / Bearish Color: Customize color themes for sweep/run lines and signal markers.
Signals: Enables or disables visual up/down markers for confirmed events.
Visualization & Display
Horizontal lines represent potential liquidity levels (unbroken swing highs/lows).
Once broken, lines automatically stop extending, marking the moment liquidity is taken.
Depending on the selected mode:
“Sweep” mode identifies false breaks or stop-hunt behavior.
“Run” mode highlights breakouts that continue the trend.
Colored arrows indicate the direction and type of liquidity reaction.
Clean, non-intrusive visualization suitable for overlaying on price charts.
Use Cases
Detect liquidity sweeps before major reversals.
Identify breakout continuations after liquidity runs.
Combine with Supply/Demand or FVG indicators for multi-layered confirmation.
Validate liquidity bias in algorithmic or discretionary strategies.
Analyze market manipulation patterns and institutional stop-hunting behavior.
Limitations & Recommendations
This indicator identifies structural behavior but does not guarantee trade direction or profitability.
Works best on liquid markets with clear swing structures (e.g., crypto, forex, indices).
Signal interpretation should be combined with confluence tools such as volume, order flow, or structure-based filters.
Excessively small swing settings may cause over-signaling in volatile markets.
Markets & Timeframes
Optimized for all major asset classes — including crypto, Forex, indices, and equities — and for intraday to higher-timeframe structural analysis (5-minute up to daily charts).
Author & Access
Developed 100% by Quantura. Published as a Open-source script indicator. Access is free.
Compliance Note
This description fully complies with TradingView’s Script Publishing Rules and House Rules . It avoids performance claims, provides transparency on methodology, and clearly describes indicator behavior and limitations.

Thin Liquidity Zones [PhenLabs]Thin Liquidity Zones with Volume Delta
Our advanced volume analysis tool identifies and visualizes significant liquidity zones using real-time volume delta analysis. This indicator helps traders pinpoint and monitor critical price levels where substantial trading activity occurs, providing precise volume flow measurement through lower timeframe analysis.
The tool works by leveraging the fact that hedge funds, institutions, and other large market participants strategically fill their orders in areas of thin liquidity to minimize slippage and market impact. By detecting these zones, traders gain valuable insights into potential areas of accumulation, distribution, and liquidity traps, allowing for more informed trading decisions.
🔍 Key Features
Real-time volume delta calculation using lower timeframe data
Dynamic zone creation based on volume spikes
Automatic timeframe optimization
Size-filtered zones to avoid noise
Custom delta timeframe scanning
Flexible analysis period selection
📊 Visual Demonstration
💡 How It Works
The indicator continuously scans for high-volume areas where trading activity exceeds the specified threshold (default 6.0x average volume). When detected, it creates zones that display the net volume delta, showing whether buying or selling pressure dominated that price level.
Key zone characteristics:
Size filtering prevents noise from large price swings
Volume delta shows actual buying/selling pressure
Zones automatically expire based on lookback period
Real-time updates as new volume data arrives
⚙️ Settings
Time Settings
Analysis Timeframe: 15M to 1W options
Custom Period: User-defined bar count
Delta Timeframe: Automatic or manual selection
Volume Analysis
Volume Threshold: Minimum spike multiple
Volume MA Length: Averaging period
Maximum Zone Size: Size filter percentage
Display Options
Zone Color: Customizable with transparency
Delta Display: On/Off toggle
Text Position: Left/Center/Right alignment
📌 Tips for Best Results
Adjust volume threshold based on instrument volatility
Monitor zone clusters for potential support/resistance
Consider reducing max zone size in volatile markets
Use in conjunction with price action and other indicators
⚠️ Important Notes
Requires volume data from your data provider
Lower timeframe scanning may impact performance
Maximum 500 zones maintained for optimization
Zone creation is filtered by both volume and size
🔧 Volume Delta Calculation
The indicator uses TradingView’s advanced volume delta calculation, which:
Scans lower timeframe data for precision
Measures actual buying vs selling pressure
Updates in real-time with new data
Provides clear positive/negative flow indication
This tool is ideal for traders focusing on volume analysis and order flow. It helps identify key levels where significant trading activity has occurred and provides insight into the nature of that activity through volume delta analysis.
Note: Performance may vary based on your chart’s timeframe. Adjust settings according to your trading style and the instrument’s characteristics. Past performance is not indicative of future results, DYOR.

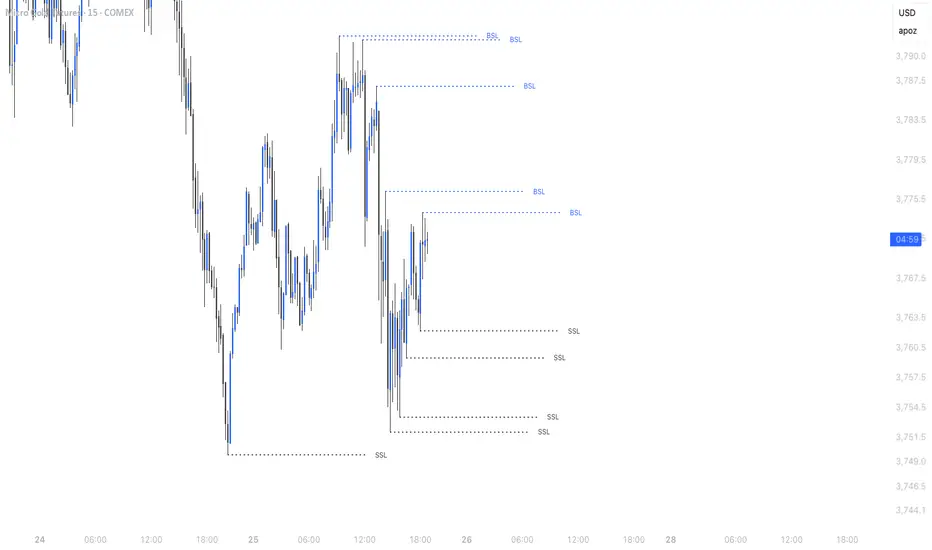
Simple Liquidity Sweep [rare_gold_steak]- Shows when the liquidity was swept.
- Shows BSL and SSL.
- Simple options to change styling.
I use it personally and some people liked it so I thought i'll share it with the public.
HTF Liquidity Levels█ OVERVIEW
The indicator introduces a new representation of the previous days, weeks, and months highs & lows ( DWM HL ) with a focus on untapped levels.
█ CONCEPTS
Untapped Levels
It is popularly known that the liquidity is located behind swing points or beyond higher time frames highs/lows (in a sense, an intraday swing point is a day high/low). These key areas are said "liquid" because of the accumulation of resting orders, mainly in the form of stop-loss orders. And this more significantly on higher time frames which have more time for stacking orders. As the result, the indicator aims to keep track of untapped levels that have their liquidity states intact.
Liquidity Pools
Once a liquidity level identified, or better, a cluster of liquidity levels work as magnets for the market. The price is more likely to make its way towards heavier pockets of liquidity, by proximity (the closest liquidity pool), and by difficulty (path with less obstacles). This phenomenon is referred as liquidity run, raid, purge, grab, hunt, sweep, you name it. Consequently, the indicator can help you frame a directional bias during your trading session.
█ NOTES
Drawings
Once a level is tapped, it is highlighted. At the end of each day, all tapped levels are cleared.

SMC Statistical Liquidity Walls [PhenLabs]📊 SMC Statistical Liquidity Walls
Version: PineScript™ v6
📌 Description
The SMC Statistical Liquidity Walls indicator is designed to visualize market volatility and potential reversal zones using advanced statistical modeling. Unlike traditional Bollinger Bands that use simple lines, this script utilizes an “Inverted Sigmoid” opacity function to create a “fog of war” effect. This visualizes the density of liquidity: the further price moves from the equilibrium (mean), the “harder” the liquidity wall becomes.
This tool solves the problem of over-trading in low-probability areas. By automatically mapping “Premium” (Resistance) and “Discount” (Support) zones based on Standard Deviation (SD), traders can instantly see when price is overextended. The result is a clean, intuitive overlay that helps you identify high-probability mean reversion setups without cluttering your chart with manual drawings.
🚀 Points of Innovation
Inverted Sigmoid Logic: A custom mathematical function maps Standard Deviation to opacity, creating a realistic “wall” density effect rather than linear gradients.
Dynamic “Solidity”: The indicator is transparent at the center (Equilibrium) and becomes visually solid at the edges, mimicking physical resistance.
Separated Directional Bias: distinct Red (Premium) and Green (Discount) coding helps SMC traders instantly recognize expensive vs. cheap pricing.
Smart “Safe” Deviation: Includes fallback logic to handle calculation errors if deviation hits zero, ensuring the indicator never crashes during data gaps.
🔧 Core Components
Basis Calculation: Uses a Simple Moving Average (SMA) to determine the market’s equilibrium point.
Standard Deviation Zones: Calculates 1SD, 2SD, and 3SD levels to define the statistical extremes of price action.
Sigmoid Alpha Calculation: Converts the SD distance into a transparency value (0-100) to drive the visual gradient.
🔥 Key Features
Automated Premium/Discount Zones: Red zones indicate overbought (Premium) areas; Green zones indicate oversold (Discount) areas.
Customizable Density: Users can adjust the “Steepness” and “Midpoint” of the sigmoid curve to control how fast the walls become solid.
Integrated Alerts: Built-in alert conditions trigger when price hits the “Solid” wall (2SD or higher), perfect for automated trading or notifications.
Visual Clarity: The center of the chart remains clear (high transparency) to keep focus on price action where it matters most.
🎨 Visualization
Equilibrium Line: A gray line representing the mean price.
Gradient Fills: The space between bands fills with color that increases in opacity as it moves outward.
Premium Wall: Upper zones fade from transparent red to solid red.
Discount Wall: Lower zones fade from transparent green to solid green.
📖 Usage Guidelines
Range Period: Default 20. Controls the lookback period for the SMA and Standard Deviation calculation.
Source: Default Close. The price data used for calculations.
Center Transparency: Default 100 (Clear). Controls how transparent the middle of the chart is.
Edge Transparency: Default 45 (Solid). Controls the opacity of the outermost liquidity wall.
Wall Steepness: Default 2.5. Adjusts how aggressively the gradient transitions from clear to solid.
Wall Start Point: Default 1.5 SD. The deviation level where the gradient shift begins to accelerate.
✅ Best Use Cases
Mean Reversion Trading: Enter trades when price hits the solid 2SD or 3SD wall and shows rejection wicks.
Take Profit Targets: Use the Equilibrium (Gray Line) as a logical first target for reversal trades.
Trend Filtering: Do not initiate new long positions when price is deep inside the Red (Premium) wall.
⚠️ Limitations
Lagging Nature: As a statistical tool based on Moving Averages, the walls react to past price data and may lag during sudden volatility spikes.
Trending Markets: In strong parabolic trends, price can “ride” the bands for extended periods; mean reversion should be used with caution in these conditions.
💡 What Makes This Unique
Physics-Based Visualization: We treat liquidity as a physical barrier that gets denser the deeper you push, rather than just a static line on a chart.
🔬 How It Works
Step 1: The script calculates the mean (SMA) and the Standard Deviation (SD) of the source price.
Step 2: It defines three zones above and below the mean (1SD, 2SD, 3SD).
Step 3: The custom `get_inverted_sigmoid` function calculates an Alpha (transparency) value based on the SD distance.
Step 4: Plot fills are colored dynamically, creating a seamless gradient that hardens at the extremes to visualize the “Liquidity Wall.”
💡 Note
For best results, combine this indicator with Price Action confirmation (such as pin bars or engulfing candles) when price touches the solid walls.

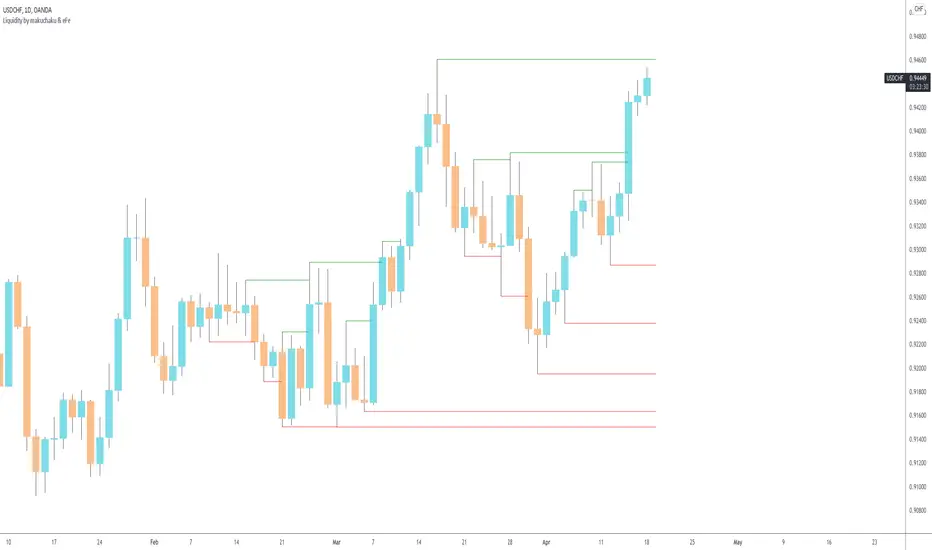
Makuchaku's trading tools - Liquidity visualizerThis indicator plots those pivots/fractals which have not been taken out by price, whereby showing where are the clusters of highs/lows where stop orders (or liquidity) could be hiding.
This is a fantastic tool for taking reversal trades.
Timeframe LiquidityTimeframe Liquidity – Multi-Timeframe Highs & Lows by
Timeframe Liquidity automatically plots previous day, week, month, and year highs and lows, key liquidity zones used by smart money and price-action traders. These levels extend into the future and can automatically stop once price wicks through, showing clear liquidity sweeps and tested zones.
Perfect for traders using ICT / SMC concepts, liquidity theory, or market structure analysis. Instantly see where liquidity rests, where it’s been taken, and how price reacts at major support and resistance.
Features:
Auto-plots PDH/PDL, PWH/PWL, PMH/PML, PYH/PYL
Custom line styles, colors, and label sizes
Option to stop line on wick (liquidity sweep)
Smart timeframe visibility (hides same-TF levels)
Accurate UTC offset handling
Identify liquidity pools fast, trade cleaner charts, and track where smart money hunts liquidity.
Built for precision, clarity, and confluence.

Liquidity LayoutLiquidity Layout
The Liquidity Layout is a comprehensive macroeconomic indicator that tracks global liquidity conditions by aggregating multiple financial data streams from major economies (US, EU, China, Japan, UK, Canada, Switzerland). It provides traders with a macro view of market liquidity to help identify favorable conditions for risk assets
⚠️ Important: Timeframe Settings
This indicator is designed for the 1W (weekly) timeframe. If you use other timeframes, you must adjust the offset parameter in the settings to properly align the data with price action. The default offset of 12 is calibrated for weekly charts.
What It Measures
This indicator combines seven key components of global liquidity:
1. Global M2 Money Supply - Tracks broad money supply (M2) plus 10% of narrow money supply (M1) across major economies, weighted by currency strength. This represents the total amount of money circulating in the private sector.
2. Central Bank Balance Sheets (CBBS) - Monitors the combined balance sheets of major central banks (Fed, ECB, BoJ, PBoC, etc.), reflecting quantitative easing and monetary expansion policies.
3. Foreign Exchange Reserves (FER) - Aggregates forex reserves held by central banks, indicating international liquidity buffers and capital flows.
4. Current Account + Capital Flows (CA) - Combines current account balances with capital flows to measure cross-border money movement and trade liquidity.
5. Government Spending (GSP) - Tracks government expenditure minus a portion of federal expenses, representing fiscal stimulus and public sector liquidity injection.
6. World Currency Unit (WCU) - A custom forex composite that weights major and emerging market currencies to capture global currency strength dynamics.
7. Bond Market Conditions - Analyzes yield curves, spreads, and bond indices to assess credit conditions and risk appetite in fixed income markets.
The Formula
The indicator uses two main calculation modes:
ADJ Global Liquidity (Default):
×
This multiplies liquidity components by currency and bond market factors to capture the interactive effects between monetary conditions and market sentiment.
TPI (Trend Power Index) Mode:
A normalized version that combines all components with optimized weights:
Global Liquidity Index: 10%
Bonds: 17.5%
Bond Yields: 25%
Currency Strength: 25%
Government Spending: 5%
Current Account: 5%
M2: 2.5%
Central Bank Balance Sheets: 2.5%
Forex Reserves: 5%
Oil (macro risk indicator): 2.5%
How to Use It
Visualization Modes:
Background Mode (default): Orange background appears when TPI is positive (favorable liquidity conditions)
Line Mode: Displays the indicator as an orange line with customizable offset
Interpreting the Signal:
Positive/Rising = Expanding liquidity, generally bullish for risk assets
Negative/Falling = Contracting liquidity, risk-off environment
TPI > 1 = Extremely favorable conditions (upper threshold)
TPI < -1 = Severe liquidity stress (lower threshold)
Best Practices:
Use on higher timeframes (daily, weekly) for macro trend analysis
Combine with price action - liquidity often leads market moves by weeks or months
Watch for divergences between liquidity and asset prices
Particularly relevant for Bitcoin, equities, and risk assets
Data Sources
The indicator pulls real-time economic data from TradingView's ECONOMICS database and major market indices, including central bank statistics, government reports, and forex rates across G7 and major emerging markets.
Settings
Data Plot: Choose which liquidity component to display
Plot Type: Switch between raw Index values or normalized TPI
Offset: Shift the plot forward/backward for alignment (default: 12 for weekly charts)
Style: Background shading or line plot
Notes
This is a macro-level indicator best suited for understanding the broader liquidity environment rather than short-term trading signals. It helps answer the question: "Is the global financial system expanding or contracting liquidity?"

Open Liquidity Heatmap [BigBeluga]Open Liquidity Heatmap is an indicator designed to display accumulated resting liquidity on the chart.
Unlike any other liquidity heatmap, this aims to accumulate liquidity at specific levels that build up over time, showing larger areas of liquidity.
🔶 FEATURES
The indicator includes the following settings:
Lookback : Used to determine the range calculation of the heatmap.
Leverage : Leverage of the liquidation (Counted as % in price, Example: 4.5 will return a distance from price of 4.5%, indicating any possible resting liquidity in this range).
Levels : Amount of levels to display (Each level is counted as liquidity resting on the chart; fewer levels will return a bigger area of liquidity sitting on the chart).
Mode : Apply a color gradient from the minimum liquidation to the maximum liquidity level. Set the maximum color gradient value (Counted as volume).
Offset : Automatically determine the offset range of the Volume Profiles. Manual offset of the Volume Profiles.
🔶 CALCULATION
for i = 0 to step - 1
float plotter = na
switch i
0 =>
plotter := hs
=>
plotter := hs - diff * ( i )
cls.hm.gnL(plotter)
cls.vp.put(plotter, 0)
We calculate levels like a normal volume profile with steps, from the highest point within the lookback to the lowest one. Each level will contain the corresponding amount of volume that the candle has closed in that range.
As we can see in the image above, we add liquidity each time the distance in % from price is between two levels.
Unlike many liquidity indicators that provide a single candle liquidity heatmap, this aims to add up liquidity (volume) in already present levels.
This can be extremely useful to see which levels are likely to be more liquid and tend to get a bigger reaction to the price.
Imagine it like a range of levels that each time price revisits that area, a new position area is added; we add volume in that area each time price visits that zone. Liquidity builds up in those zones, causing a bigger reaction to the price once the price visits it.
This indicator is not the same as a single candle heatmap like many others. What is a single candle heatmap?
A single candle heatmap is when a level is created on every new candle, coloring the level based on the total volume of it.
This indicator, on the contrary, aims to provide a more specific use by adding up liquidity each time price visits it.
🔶 BASIC DEMOSTRATION
This is a basic demonstration of how we can spot high liquidity points overall using confluence:
We see the POC of the liquidation in a low volume area of the normal volume profile adding up as confluence.
Resistance from the POC Volume Profile suggesting price will go lower.
Major long open liquidity down.
As we can see, price takes out all the long liquidity and right after pumping, indicating that all the major liquidity got taken out.
Some key note to take is that a POC in the liquidation heatmap in a low volume area of the normal Volume Profile add confluence of a possible big reaction in that zone.
In the forex market, we suggest to use a low distance from price (Leverage) while in a crypto market you can use the one that fit the best the current timeframe.
🔶 CONCLUSION
This indicator aims to show open resting liquidity that had built up over time, showing the most amount of liquidation in specific areas in an aggregated way unlike many liquidation heatmap indicators that show single-level liquidation.
🔶 RELATED SCRIPT

Fractal Break Imbalance / Fair Value Gap (FVG) / Liquidity VoidFractal Break Imbalance / Fair Value Gap (FVG) / Liquidity Void
Order imbalances in either direction, either excess buy or sell orders, reduce liquidity. The market will seek to fill gaps sooner or later. The script marks an imbalance / FVG after a fractal break. It also marks any other imbalance.
Default Colours:
Green - Imbalance after fractal break to the upside
Red - Imbalance after fractal break to the downside
Yellow - Other imbalances
How To Use:
Gaps can be used to determine possible entries and targets. Those familiar with liquidity raids, supply and demand, and ICT concepts may realise it's potential.
Indicator in use:

Structural Liquidity Signals [BullByte]Structural Liquidity Signals (SFP, FVG, BOS, AVWAP)
Short description
Detects liquidity sweeps (SFPs) at pivots and PD/W levels, highlights the latest FVG, tracks AVWAP stretch, arms percentile extremes, and triggers after confirmed micro BOS.
Full description
What this tool does
Structural Liquidity Signals shows where price likely tapped liquidity (stop clusters), then waits for structure to actually change before it prints a trigger. It spots:
Liquidity sweeps (SFPs) at recent pivots and at prior day/week highs/lows.
The latest Fair Value Gap (FVG) that often “pulls” price or serves as a reaction zone.
How far price is stretched from two VWAP anchors (one from the latest impulse, one from today’s session), scaled by ATR so it adapts to volatility.
A “percentile” extreme of an internal score. At extremes the script “arms” a setup; it only triggers after a small break of structure (BOS) on a closed bar.
Originality and design rationale, why it’s not “just a mashup”
This is not a mashup for its own sake. It’s a purpose-built flow that links where liquidity is likely to rest with how structure actually changes:
- Liquidity location: We focus on areas where stops commonly cluster—recent pivots and prior day/week highs/lows—then detect sweeps (SFPs) when price wicks beyond and closes back inside.
- Displacement context: We track the last Fair Value Gap (FVG) to account for recent inefficiency that often acts as a magnet or reaction zone.
- Stretch measurement: We anchor VWAP to the latest N-bar impulse and to the Daily session, then normalize stretch by ATR to assess dislocation consistently across assets/timeframes.
- Composite exhaustion: We combine stretch, wick skew, and volume surprise, then bend the result with a tanh transform so extremes are bounded and comparable.
- Dynamic extremes and discipline: Rather than triggering on every sweep, we “arm” at statistical extremes via percent-rank and only fire after a confirmed micro Break of Structure (BOS). This separates “interesting” from “actionable.”
Key concepts
SFP (liquidity sweep): A candle briefly trades beyond a level (where stops sit) and closes back inside. We detect these at:
Pivots (recent swing highs/lows confirmed by “left/right” bars).
Prior Day/Week High/Low (PDH/PDL/PWH/PWL).
FVG (Fair Value Gap): A small 3‑bar gap (bar2 high vs bar1 low, or vice versa). The latest gap often acts like a magnet or reaction zone. We track the most recent Up/Down gap and whether price is inside it.
AVWAP stretch: Distance from an Anchored VWAP divided by ATR (volatility). We use:
Impulse AVWAP: resets on each new N‑bar high/low.
Daily AVWAP: resets each new session.
PR (Percentile Rank): Where the current internal score sits versus its own recent history (0..100). We arm shorts at high PR, longs at low PR.
Micro BOS: A small break of the recent high (for longs) or low (for shorts). This is the “go/no‑go” confirmation.
How the parts work together
Find likely liquidity grabs (SFPs) at pivots and PD/W levels.
Add context from the latest FVG and AVWAP stretch (how far price is from “fair”).
Build a bounded score (so different markets/timeframes are comparable) and compute its percentile (PR).
Arm at extremes (high PR → short candidate; low PR → long candidate).
Only print a trigger after a micro BOS, on a closed bar, with spacing/cooldown rules.
What you see on the chart (legend)
Lines:
Teal line = Impulse AVWAP (resets on new N‑bar extreme).
Aqua line = Daily AVWAP (resets each session).
PDH/PDL/PWH/PWL = prior day/week levels (toggle on/off).
Zones:
Greenish box = latest Up FVG; Reddish box = latest Down FVG.
The shading/border changes after price trades back through it.
SFP labels:
SFP‑P = SFP at Pivot (dotted line marks that pivot’s price).
SFP‑L = SFP at Level (at PDH/PDL/PWH/PWL).
Throttle: To reduce clutter, SFPs are rate‑limited per direction.
Triggers:
Triangle up = long trigger after BOS; triangle down = short trigger after BOS.
Optional badge shows direction and PR at the moment of trigger.
Optional Trigger Zone is an ATR‑sized box around the trigger bar’s close (for visualization only).
Background:
Light green/red shading = a long/short setup is “armed” (not a trigger).
Dashboard (Mini/Pro) — what each item means
PR: Percentile of the internal score (0..100). Near 0 = bullish extreme, near 100 = bearish extreme.
Gauge: Text bar that mirrors PR.
State: Idle, Armed Long (with a countdown), or Armed Short.
Cooldown: Bars remaining before a new setup can arm after a trigger.
Bars Since / Last Px: How long since last trigger and its price.
FVG: Whether price is in the latest Up/Down FVG.
Imp/Day VWAP Dist, PD Dist(ATR): Distance from those references in ATR units.
ATR% (Gate), Trend(HTF): Status of optional regime filters (volatility/trend).
How to use it (step‑by‑step)
Keep the Safety toggles ON (default): triggers/visuals on bar‑close, optional confirmed HTF for trend slope.
Choose timeframe:
Intraday (5m–1h) or Swing (1h–4h). On very fast/thin charts, enable Performance mode and raise spacing/cooldown.
Watch the dashboard:
When PR reaches an extreme and an SFP context is present, the background shades (armed).
Wait for the trigger triangle:
It prints only after a micro BOS on a closed bar and after spacing/cooldown checks.
Use the Trigger Zone box as a visual reference only:
This script never tells you to buy/sell. Apply your own plan for entry, stop, and sizing.
Example:
Bullish: Sweep under PDL (SFP‑L) and reclaim; PR in lower tail arms long; BOS up confirms → long trigger on bar close (ATR-sized trigger zone shown).
Bearish: Sweep above PDH/pivot (SFP‑L/P) and reject; PR in upper tail arms short; BOS down confirms → short trigger on bar close (ATR-sized trigger zone shown).
Settings guide (with “when to adjust”)
Safety & Stability (defaults ON)
Confirm triggers at bar close, Draw visuals at bar close: Keep ON for clean, stable prints.
Use confirmed HTF values: Applies to HTF trend slope only; keeps it from changing until the HTF bar closes.
Performance mode: Turn ON if your chart is busy or laggy.
Core & Context
ATR Length: Bigger = smoother distances; smaller = more reactive.
Impulse AVWAP Anchor: Larger = fewer resets; smaller = resets more often.
Show Daily AVWAP: ON if you want session context.
Use last FVG in logic: ON to include FVG context in arming/score.
Show PDH/PDL/PWH/PWL: ON to see prior day/week levels that often attract sweeps.
Liquidity & Microstructure
Pivot Left/Right: Higher values = stronger/rarer pivots.
Min Wick Ratio (0..1): Higher = only more pronounced SFP wicks qualify.
BOS length: Larger = stricter BOS; smaller = quicker confirmations.
Signal persistence: Keeps SFP context alive for a few bars to avoid flicker.
Signal Gating
Percent‑Rank Lookback: Larger = more stable extremes; smaller = more reactive extremes.
Arm thresholds (qHi/qLo): Move closer to 0.5 to see more arms; move toward 0/1 to see fewer arms.
TTL, Cooldown, Min bars and Min ATR distance: Space out triggers so you’re not reacting to minor noise.
Regime Filters (optional)
ATR percentile gate: Only allow triggers when volatility is at/above a set percentile.
HTF trend gate: Only allow longs when the HTF slope is up (and shorts when it’s down), above a minimum slope.
Visuals & UX
Only show “important” SFPs: Filters pivot SFPs by Volume Z and |Impulse stretch|.
Trigger badges/history and Max badge count: Control label clutter.
Compact labels: Toggle SFP‑P/L vs full names.
Dashboard mode and position; Dark theme.
Reading PR (the built‑in “oscillator”)
PR ~ 0–10: Potential bullish extreme (long side can arm).
PR ~ 90–100: Potential bearish extreme (short side can arm).
Important: “Armed” ≠ “Enter.” A trigger still needs a micro BOS on a closed bar and spacing/cooldown to pass.
Repainting, confirmations, and HTF notes
By default, prints wait for the bar to close; this reduces repaint‑like effects.
Pivot SFPs only appear after the pivot confirms (after the chosen “right” bars).
PD/W levels come from the prior completed candles and do not change intraday.
If you enable confirmed HTF values, the HTF slope will not change until its higher‑timeframe bar completes (safer but slightly delayed).
Performance tips
If labels/zones clutter or the chart lags:
Turn ON Performance mode.
Hide FVG or the Trigger Zone.
Reduce badge history or turn badge history off.
If price scaling looks compressed:
Keep optional “score”/“PR” plots OFF (they overlay price and can affect scaling).
Alerts (neutral)
Structural Liquidity: LONG TRIGGER
Structural Liquidity: SHORT TRIGGER
These fire when a trigger condition is met on a confirmed bar (with defaults).
Limitations and risk
Not every sweep/extreme reverses; false triggers occur, especially on thin markets and low timeframes.
This indicator does not provide entries, exits, or position sizing—use your own plan and risk control.
Educational/informational only; no financial advice.
License and credits
© BullByte - MPL 2.0. Open‑source for learning and research.
Built from repeated observations of how liquidity runs, imbalance (FVG), and distance from “fair” (AVWAPs) combine, and how a small BOS often marks the moment structure actually shifts.

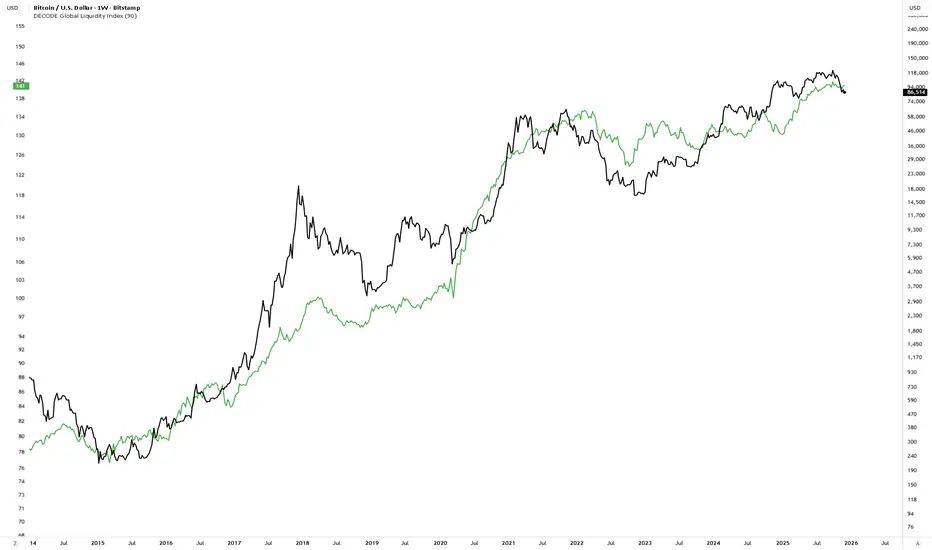
DECODE Global Liquidity IndexDECODE Global Liquidity Index 🌊
The DECODE Global Liquidity Index is a powerful tool designed to track and aggregate global liquidity by combining data from the world's 13 largest economies. It offers a comprehensive view of financial liquidity, providing crucial insights into the underlying currents that can influence asset prices and market trends.
The economies covered are: United States, China, European Union, Japan, India, United Kingdom, Brazil, Canada, Russia, South Korea, Australia, Mexico, and Indonesia. The European Union accounts for major individual economies within the EU like Germany, France, Italy, Spain, Netherlands, Poland, etc.
Key Features:
1. Customizable Liquidity Sources
Include Global M2: You can opt to include the M2 money supply from the 13 listed economies. M2 is a broad measure of money supply that includes cash, checking deposits, savings deposits, money market securities, mutual funds, and other time deposits. (Note: Australia uses M3 as its primary measure, which is included when M2 is selected for Australia).
Include Central Bank Balance Sheets (CBBS): Alternatively, or in addition, you can include the total assets held by the central banks of these economies. Central bank balance sheets expand or contract based on monetary policy operations like quantitative easing (QE) or tightening (QT).
Combined View: If you select both M2 and CBBS, and data is available for both, the indicator will display an average of the two aggregated values. If only one source type is selected, or if data for one type is unavailable despite both being selected, the indicator will display the single available and selected component. This provides flexibility in how you define and analyze global liquidity.
2. Lead/Lag Analysis (Forward Projection):
Lead Offset (Days): This feature allows you to project the liquidity index forward by a specified number of days.
Why it's useful: Global liquidity changes can often be a leading indicator for various asset classes, particularly those sensitive to risk appetite, like Bitcoin or growth stocks. These assets might lag shifts in liquidity. By applying a lead (e.g., 90 days), you can shift the liquidity data forward on your chart to more easily visualize potential correlations and identify if current asset price movements might be responding to past changes in liquidity.
3. Rate of Change (RoC) Oscillator:
Year-over-Year % View: Instead of viewing aggregate liquidity, you can switch to a Year-over-Year (YoY%) Rate of Change (ROC) oscillator.
Why it's useful:
Momentum Identification: The ROC highlights the speed and direction of liquidity changes. Positive values indicate liquidity is increasing compared to a year ago, while negative values show it's decreasing.
Turning Points: Oscillators make it easier to spot potential accelerations, decelerations, or reversals in liquidity trends. A cross above the zero line can signal strengthening liquidity momentum, while a cross below can signal weakening momentum.
Cycle Analysis: It helps in assessing the cyclical nature of liquidity provision and its potential impact on market cycles.
This indicator aims to provide a clear, customizable, and insightful measure of global liquidity to aid traders and investors in their market analysis.
Liquidation Levels with Liquidity Sweeps/Breakouts [AlgoAlpha]🌊📈 Dive into the depths of market liquidity with "Liquidation Levels with Liquidity Sweeps/Breakouts" - your ultimate tool for navigating the turbulent waters of trading! 🧹💹 Crafted by the wizards at AlgoAlpha, this Pine Script™ masterpiece illuminates the unseen liquidity levels and sweeps, guiding you through the financial seas with insight. 🚀🔍
Key Features:
🕒 Timeframe Flexibility: Customize your analysis with a TimeFrame Multiplier, allowing the indicator to operate on higher timeframes for broader market insight.
💥 Dynamic Volume Threshold: Set your sensitivity to breakouts with the High Volume Threshold, ensuring you catch significant market movements while avoiding fakeouts.
👀 Visibility Controls: Toggle the display of swept liquidity and highlight liquidity breakouts with customizable background colors for clear, actionable insights.
🎨 Custom Appearance: Personalize your chart with bullish, bearish, and breakout colors to match your trading style.
How to Use the Liquidity Levels with Liquidation Sweeps Indicator:
Maximize your trading efficiency with the Liquidity Levels with Liquidation Sweeps Indicator by following these simple steps! 🚀🌟
⚙️ Customize Settings: Access the indicator settings to personalize the TimeFrame Multiplier, High Volume Threshold, and Relative Volume Period. Tailor these settings to match your trading strategy and chart preferences.
👁️ Analyze Liquidity Levels: Monitor the chart for liquidity levels and sweeps. Bullish sweeps are marked with green labels, bearish sweeps with red, and breakouts highlighted by the chart background.
🔔 Set Alerts: Enable alert conditions for liquidity breakouts and sweeps within the indicator's settings. This feature allows you to receive real-time notifications, helping you to act promptly on trading opportunities.
How It Works:
The heart of this indicator lies in its ability to track and highlight liquidity levels derived from swing pivots, and sweeps across multiple timeframes. By calculating relative volume against a user-defined threshold, it identifies strong volume movements indicative of liquidity breakouts, this helps filter out fake-outs. When a liquidity level is breached but not completely mitigated, it's either marked as a bullish or bearish sweep, which come with the option to show an estimate of the number of liquidations during the sweep.
if peakform and peakprinted != 1
aR.push(line.new(bar_index-mult, h.get(1), bar_index+1, h.get(1), color = red))
aRv.push(h.get(1))
peakprinted := 1
if valleyform and valleyprinted != 1
aS.push(line.new(bar_index-mult, l.get(1), bar_index+1, l.get(1), color = green))
aSv.push(l.get(1))
valleyprinted := 1

Buyside & Sellside Liquidity [LuxAlgo]The Buyside & Sellside Liquidity indicator aims to detect & highlight the first and arguably most important concept within the ICT trading methodology, Liquidity levels.
🔶 SETTINGS
🔹 Liquidity Levels
Detection Length: Lookback period
Margin: Sets margin/sensitivity for a liquidity level detection
🔹 Liquidity Zones
Buyside Liquidity Zones: Enables display of the buyside liquidity zones.
Margin: Sets margin/sensitivity for the liquidity zone boundaries.
Color: Color option for buyside liquidity levels & zones.
Sellside Liquidity Zones: Enables display of the sellside liquidity zones.
Margin: Sets margin/sensitivity for the liquidity zone boundaries.
Color: Color option for sellside liquidity levels & zones.
🔹 Liquidity Voids
Liquidity Voids: Enables display of both bullish and bearish liquidity voids.
Label: Enables display of a label indicating liquidity voids.
🔹 Display Options
Mode: Controls the lookback length of detection and visualization, where Present assumes last 500 bars and Historical assumes all data available to the user
# Visible Levels: Controls the amount of the liquidity levels/zones to be visualized.
🔶 USAGE
Definitions of Liquidity refer to the availability of orders at specific price levels in the market, allowing transactions to occur smoothly.
In the context of Inner Circle Trader's teachings, liquidity mainly relates to stop losses or pending orders and liquidity level/pool, highlighting a concentration of buy or sell orders at specific price levels. Smart money traders, such as banks and other large institutions, often target these liquidity levels/pools to accumulate or distribute their positions.
There are two types of liquidity; Buyside liquidity and Sellside liquidity .
Buyside liquidity represents a level on the chart where short sellers will have their stops positioned, and Sellside liquidity represents a level on the chart where long-biased traders will place their stops.
These areas often act as support or resistance levels and can provide trading opportunities.
When the liquidity levels are breached at which many stop/limit orders are placed have been traded through, the script will create a zone aiming to provide additional insight to figure out the odds of the next price action.
Reversal: It’s common that the price may reverse course and head in the opposite direction, seeking liquidity at the opposite extreme.
Continuation: When the zone is also broken it is a sign for continuation price action.
It's worth noting that ICT concepts are specific to the methodology developed by Michael J. Huddleston and may not align with other trading approaches or strategies.
🔶 DETAILS
Liquidity voids are sudden changes in price when the price jumps from one level to another. Liquidity voids will appear as a single or a group of candles that are all positioned in the same direction. These candles typically have large real bodies and very short wicks, suggesting very little disagreement between buyers and sellers. The peculiar thing about liquidity voids is that they almost always fill up.
🔶 ALERTS
When an alert is configured, the user will have the ability to be notified in case;
Liquidity level is detected/updated.
Liquidity level is breached.
🔶 RELATED SCRIPTS
ICT-Concepts
ICT-Macros
Imbalance-Detector

Liquidity Point LinesLiquidity Point Lines
The "Liquidity Point Lines" indicator helps traders identify potential areas of liquidity in the market by drawing lines at specific price levels where significant "liquidation events" may have occurred. These events are determined by analyzing the MACD Histogram and identifying pivot points that suggest strong movements, which are often associated with the flushing out of short or long positions.
How It Works
This indicator leverages the MACD Histogram to gauge the strength of price momentum. It then identifies pivot highs and lows within the MACD Histogram's values. When a significant pivot is detected, the indicator interprets this as a potential "liquidity point" — a price level where a substantial amount of buy or sell orders (often due to liquidations) may have been executed.
The indicator distinguishes between:
Shorts Liquidation Points (Resistance): These are identified when the MACD Histogram registers a pivot high, suggesting a strong upward movement that could have liquidated short positions. Lines are drawn at the high price of the bar where this pivot occurred.
Longs Liquidation Points (Support): Conversely, these are identified when the MACD Histogram registers a pivot low, indicating a strong downward movement that might have liquidated long positions. Lines are drawn at the low price of the bar where this pivot occurred.
Key Features and Settings
The "Liquidity Point Lines" indicator offers extensive customization to tailor its sensitivity and visual representation:
MACD Settings for Liquidity: Configure the underlying MACD calculation with adjustable Fast Length, Slow Length, Source, Signal Smoothing, and MA Types (SMA/EMA) for both the Oscillator and Signal Line.
Liquidity Points Settings:
Pivot Lookback Left/Right: Define the number of bars to look back on either side to identify a pivot in the MACD Histogram.
Dynamic Strength Thresholds: This powerful feature allows the indicator to dynamically calculate the significance of a liquidation event. When enabled, it uses the average absolute histogram value over a specified Dynamic Threshold Lookback Period and applies Small and Medium Threshold Factors to determine the strength (Small, Medium, or Large) of the liquidity point.
Fixed Strength Thresholds: If dynamic thresholds are disabled, you can set fixed numerical values for Small and Medium Histogram Thresholds to define the strength categories.
Color & Style Customization: Assign distinct colors for Small, Medium, and Large liquidation points, choose the Line Style (Solid, Dashed, Dotted), and set the Label Text Color.
Label X Offset (To Right): Adjust the horizontal position of the liquidity point labels on your chart.
Liquidity Points Management:
Max Active Liquidity Lines: Control the maximum number of liquidity lines displayed simultaneously on your chart. Older lines are automatically removed to maintain clarity, except for lines that have been "touched" (i.e., price has interacted with that liquidity level).
Visual Interpretation
Each liquidity line is colored according to the strength of the detected liquidation event, making it easy to visually assess the potential significance of the price level. Lines extend to the right, serving as ongoing reference points. When the price interacts with a liquidity line (i.e., "touches" it), the line and its corresponding label are removed, indicating that the liquidity at that level may have been absorbed.
This indicator can be a valuable tool for identifying potential support and resistance levels, understanding market reactions to "liquidation cascades," and informing your trading decisions.

Low Liquidity Zones [PhenLabs]📊 Low Liquidity Zones
Version: PineScript™ v6
📌 Description
Low Liquidity Zones identifies and highlights periods of unusually low trading volume on your chart, marking areas where price movement occurred with minimal participation. These zones often represent potential support and resistance levels that may be more susceptible to price breakouts or reversals when revisited with higher volume.
Unlike traditional volume analysis tools that focus on high volume spikes, this indicator specializes in detecting low liquidity areas where price moved with minimal resistance. Each zone displays its volume delta, providing insight into buying vs. selling pressure during these thin liquidity periods. This combination of low volume detection and delta analysis helps traders identify potential price inefficiencies and weak structures in the market.
🚀 Points of Innovation
• Identifies low liquidity zones that most volume indicators overlook but which often become significant technical levels
• Displays volume delta within each zone, showing net buying/selling pressure during low liquidity periods
• Dynamically adjusts to different timeframes, allowing analysis across multiple time horizons
• Filters zones by maximum size percentage to focus only on precise price levels
• Maintains historical zones until they expire based on your lookback settings, creating a cumulative map of potential support/resistance areas
🔧 Core Components
• Low Volume Detection: Identifies candles where volume falls below a specified threshold relative to recent average volume, highlighting potential liquidity gaps.
• Volume Delta Analysis: Calculates and displays the net buying/selling pressure within each low liquidity zone, providing insight into the directional bias during low participation periods.
• Dynamic Timeframe Adjustment: Automatically scales analysis periods to match your selected timeframe preference, ensuring consistent identification of low liquidity zones regardless of chart settings.
• Zone Management System: Creates, tracks, and expires low liquidity zones based on your configured settings, maintaining visual clarity on the chart.
🔥 Key Features
• Low Volume Identification: Automatically detects and highlights candles where volume falls below your specified threshold compared to the moving average.
• Volume Delta Visualization: Shows the net volume delta within each zone, providing insight into whether buyers or sellers were dominant despite the low overall volume.
• Flexible Timeframe Analysis: Analyze low liquidity zones across multiple predefined timeframes or use a custom lookback period specific to your trading style.
• Zone Size Filtering: Filters out excessively large zones to focus only on precise price levels, improving signal quality.
• Automatic Zone Expiration: Older zones are automatically removed after your specified lookback period to maintain a clean, relevant chart display.
🎨 Visualization
• Volume Delta Labels: Each zone displays its volume delta with “+” or “-” prefix and K/M suffix for easy interpretation, showing the strength and direction of pressure during the low volume period.
• Persistent Historical Mapping: Zones remain visible for your specified lookback period, creating a cumulative map of potential support and resistance levels forming under low liquidity conditions.
📖 Usage Guidelines
Analysis Timeframe
Default: 1D
Range/Options: 15M, 1HR, 3HR, 4HR, 8HR, 16HR, 1D, 3D, 5D, 1W, Custom
Description: Determines the historical period to analyze for low liquidity zones. Shorter timeframes provide more recent data while longer timeframes offer a more comprehensive view of significant zones. Use Custom option with the setting below for precise control.
Custom Period (Bars)
Default: 1000
Range: 1+
Description: Number of bars to analyze when using Custom timeframe option. Higher values show more historical zones but may impact performance.
Volume Analysis
Volume Threshold Divisor
Default: 0.5
Range: 0.1-1.0
Description: Maximum volume relative to average to identify low volume zones. Example: 0.5 means volume must be below 50% of the average to qualify as low volume. Lower values create more selective zones while higher values identify more zones.
Volume MA Length
Default: 15
Range: 1+
Description: Period length for volume moving average calculation. Shorter periods make the indicator more responsive to recent volume changes, while longer periods provide a more stable baseline.
Zone Settings
Zone Fill Color
Default: #2196F3 (80% transparency)
Description: Color and transparency of the low liquidity zones. Choose colors that stand out against your chart background without obscuring price action.
Maximum Zone Size %
Default: 0.5
Range: 0.1+
Description: Maximum allowed height of a zone as percentage of price. Larger zones are filtered out. Lower values create more precise zones focusing on tight price ranges.
Display Options
Show Volume Delta
Default: true
Description: Toggles the display of volume delta within each zone. Enabling this provides additional insight into buying vs. selling pressure during low volume periods.
Delta Text Position
Default: Right
Options: Left, Center, Right
Description: Controls the horizontal alignment of the delta text within zones. Adjust based on your chart layout for optimal readability.
✅ Best Use Cases
• Identifying potential support and resistance levels that formed during periods of thin liquidity
• Spotting price inefficiencies where larger players may have moved price with minimal volume
• Finding low-volume consolidation areas that may serve as breakout or reversal zones when revisited
• Locating potential stop-hunting zones where price moved on minimal participation
• Complementing traditional support/resistance analysis with volume context
⚠️ Limitations
• Requires volume data to function; will not work on symbols where the data provider doesn’t supply volume information
• Low volume zones don’t guarantee future support/resistance - they simply highlight potential areas of interest
• Works best on liquid instruments where volume data has meaningful fluctuations
• Historical analysis is limited by the maximum allowed box count (500) in TradingView
• Volume delta in some markets may not perfectly reflect buying vs. selling pressure due to data limitations
💡 What Makes This Unique
• Focus on Low Volume: Unlike some indicators that highlight high volume events particularly like our very own TLZ indicator, this tool specifically identifies potentially significant price zones that formed with minimal participation.
• Delta + Low Volume Integration: Combines volume delta analysis with low volume detection to reveal directional bias during thin liquidity periods.
• Flexible Lookback System: The dynamic timeframe system allows analysis across any timeframe while maintaining consistent zone identification criteria.
• Support/Resistance Zone Generation: Automatically builds a visual map of potential technical levels based on volume behavior rather than just price patterns.
🔬 How It Works
1. Volume Baseline Calculation:
The indicator calculates a moving average of volume over your specified period to establish a baseline for normal market participation. This adaptive baseline accounts for natural volume fluctuations across different market conditions.
2. Low Volume Detection:
Each candle’s volume is compared to the moving average and flagged when it falls below your threshold divisor. The indicator also filters zones by maximum size to ensure only precise price levels are highlighted.
3. Volume Delta Integration:
For each identified low volume candle, the indicator retrieves the volume delta from a lower timeframe. This delta value is formatted with appropriate scaling (K/M) and displayed within the zone.
4. Zone Management:
New zones are created and tracked in a dynamic array, with each zone extending rightward until it expires. The system automatically removes expired zones based on your lookback period to maintain a clean chart.
💡 Note:
Low liquidity zones often represent areas where price moved with minimal participation, which can indicate potential market inefficiencies. These zones frequently become important support/resistance levels when revisited, especially if approached with higher volume. Consider using this indicator alongside traditional technical analysis tools for comprehensive market context. For best results, experiment with different volume threshold settings based on the specific instrument’s typical volume patterns.

Current Hourly Open Liquidity with Sweep DetectionStatistics indicate that if the current hourly candle reaches the high or low of the previous hourly candle, there is a strong likelihood that the price will return to the current hour's open, depending on how quickly the previous hour's high or low was swept. If the sweep occurs within the first 20 minutes, there is a 75% chance the current hour's open will be reached; if it takes between 21 and 40 minutes, the probability decreases to 50%; and if it takes longer than 41 minutes, the chance drops to 25%.
These statistics can help identify manipulation on the hourly timeframe and guide trade decisions accordingly. For instance, if the previous hourly high is taken within the first 20 minutes but the current hour's open is not reached, it may be wise to avoid long positions until it happens or consider short positions in the direction of the open liquidity, using your existing entry rules and risk management.
The indicator highlights the current hour's open with a line and label to visually represent that liquidity pool, adjusting the line's color based on whether and when the previous hour's high or low was tapped. Once the open is reached, the indicator can, depending on settings, remove the line and label from the chart (this is enabled by default) since the liquidity pool is no longer relevant, preventing chart clutter.
All colors, line widths, label text sizes, and colors can be customized.

Emibap's HEX Uniswap v3 Liquidity PoolThis script will display a histogram of the Uniswap V3 HEX liquidity pool, versus as many tokens as possible.
Current supported pairs:
HEX/USDC
HEX/WETH
HEX/WETH.USD (Ethereum expressed in USD)
HEX/USDT (Just showing the USDC liquidity)
Similar to what you can see in the liquidity section of the Uniswap pool page but conveniently rendered alongside your chart.
It's meant to be used on a HEX / WETH chart only. The price should be expressed in WETH for it to work.
One of the main motivations for using this in your chart is to get an idea of the current sentiment: If most of the volume is above the price it might be an indication of an upcoming move up, for instance.
I'll try to update the liquidity regularly.
Using the 4h, daily, or weekly time frames is highly recommended.
The options are straightforward:
Histogram bars color. Default is blue
Histogram background color. Default is black at 20% opacity
Upper price limit of the diagram: Visible upper bound price limit for the histogram, based on the current price. I.E: 200%: If the price is 1, the histogram will show 3 as the upper bound
Lower price limit of the diagram. Visible lower bound price limit for the histogram, based on the current price. I.E: 99%: If the price is 1, the histogram will show 0. 01 as the upper bound
Width of the widest bar: Width (in bars) for the widest bar of the histogram. The more the higher resolution you'll get
Locked volume marker line thickness
Locked volume marker color

Emibap's Uniswap V3 HEX/WETH 0.3% Liquidity PoolThis script will display a histogram of the Uniswap V3 HEX / WETH 3% liquidity pool.
Similar to what you can see in the liquidity section of the Uniswap pool page but conveniently rendered alongside your chart.
It's meant to be used on a HEX / WETH chart only. The price should be expressed in WETH for it to work.
One of the main motivations for using this in your chart is to get an idea of the current sentiment: If most of the volume is below the price it might be an indication of an upcoming move up, for instance.
I'll try to update the liquidity regularly.
Using the 4h, daily, or weekly time frames is highly recommended.
The options are straightforward:
Histogram bars color. Default is blue
Histogram background color. Default is black at 20% opacity
Upper price limit of the diagram: Visible upper bound price limit for the histogram, based on the current price. I.E: 200%: If the price is 1, the histogram will show 3 as the upper bound
Lower price limit of the diagram. Visible lower bound price limit for the histogram, based on the current price. I.E: 99%: If the price is 1, the histogram will show 0. 01 as the upper bound
Width of the widest bar: Width (in bars) for the widest bar of the histogram. The more the higher resolution you'll get

NY Open Breakout Strategy - High Liquidity & Favorable RRR Pine Description:
The NY Open Breakout Strategy is an advanced Pine Script indicator tailored for the TradingView platform. This strategy is specifically designed to exploit the high liquidity found during the New York session opening in the Forex market. Its primary goal is to provide traders with an opportunity to engage in positions with lower risk and higher potential profits, thereby ensuring an advantageous risk-to-reward ratio (RRR).
Core Objectives:
Leveraging High Liquidity: Capitalizes on the significant market movements at the New York session opening, known for its high liquidity, to identify strong breakout signals.
Achieving Favorable RRR: By setting strategic stop-loss and take-profit levels, the strategy aims for a higher RRR. This approach can lead to overall profitability, even if the win rate is lower than the loss rate.
Functionality:
Dynamic Breakout Identification: Uses the first 15-minute candle’s high and low after NY open as benchmarks for detecting potential breakouts.
Customizable Stop-Loss & Take-Profit: Provides options to configure stop-loss at the last swing or the previous candle’s close. The take-profit levels are determined based on a favorable risk-reward ratio.
Visual Session Indicators: Includes distinct background coloring and vertical lines to mark the New York session for easy visibility.
Methodology:
This strategy hinges on the premise that the opening of the New York session often triggers key price movements due to an influx of trading activity. By focusing on these moments, our indicator aims to capture strong trends and breakout patterns. The carefully calibrated stop-loss and take-profit settings ensure that each trade aims for a higher potential reward compared to the risk undertaken.
Unique Features:
Enhanced Risk Management: With adaptable risk-reward settings, traders can tailor their trading strategies to align with individual risk appetites.
Personalized User Experience: Offers a range of customizable settings for visual elements, allowing traders to adjust the look and feel of the indicator to their preferences.
Usage Guidelines:
Customize the indicator settings, including the stop-loss reference and risk-reward ratio, to match your trading style.
Watch for 'Buy Enter' and 'Sell Enter' signals during the New York session opening.
Utilize the displayed stop-loss and take-profit levels to effectively manage each trade.
This NY Open Breakout Strategy is ideal for traders who prioritize efficient risk management while aiming to capitalize on the high liquidity periods of the Forex market. The strategy is designed to be robust, providing a pathway to profitability even in scenarios where the number of losing trades surpasses winning ones, thanks to its emphasis on a high risk-to-reward ratio.
