Elliott Wave [LuxAlgo]The Elliott Wave indicator allows users to detect Elliott Wave (EW) impulses as well as corrective segments automatically on the chart. These are detected and displayed serially, allowing users to keep track of the evolution of an impulse or corrective wave.
Fibonacci retracements constructed from detected impulse waves are also included.
This script additionally allows users to get alerted on a wide variety of trigger conditions (see the ALERTS section below).
🔶 SETTINGS
🔹 Source
• "high" -> options high, close, maximum of open/close
• "low" -> options low, close, minimum of open/close
🔹 ZigZag
• The source and length are used to check whether a new Pivot Point is found.
Example:
• source = high/low, length = 10:
• There is a new pivot high when:
- previous high is higher than current high
- the highs of 10 bars prior to previous high are all lower
• These pivot points are used to form the ZigZag lines, which in their turn are used for pattern recognition
🔶 USAGE
The basic principles we use to identify Elliott Wave impulses are:
• A movement in the direction of the trend ( Motive/Impulse wave ) is divided in 5 waves (Wave 1 -> 5)
• The Corrective Wave (against the trend) is divided in 3 waves (Wave A -> C)
• The waves can be subdivided in smaller waves
• Wave 2 can’t retrace more than the beginning of Wave 1
• Wave 4 does not overlap with the price territory of Wave 1
Here we see an example:
Let's look at the development:
• 1 bar after point (5) a confirmed 5 Motive Wave pattern is found (1 -> 5; The 5 Waves can also be seen as one large Wave 1 ).
• Next, the script draws a set of Fibonacci lines, which are area's where the Corrective Wave potentially will bounce.
Here we see the fifth wave is getting larger, the previous highest point is updated, and the Wave 5 is larger than Wave 3 :
(At this point, the pattern is invalidated, and it display as dotted)
Further progression in time:
At this point, a confirmed " 3 Corrective Wave pattern " is found (a -> c)
When a new high has developed, a circle is drawn (in the same color of the lines)
However, when the bottom of the drawn box has breached, a red cross will be visualized.
Further progression:
Later on, a bearish confirmed " 5 Motive Wave pattern " is found (1 -> 5):
When a Corrective Wave becomes invalidated, the ABC pattern will display as dashed (not dotted):
🔶 TECHNIQUES
Pine Script™ introduces methods!
• More information can be found here:
• Pine Script™ v5 User Manual 👉 Methods
• Pine Script™ language reference manual 👉 method
🔶 ALERTS
Dynamic alerts are included in the script, you only need to set 1 alert to receive following messages:
• When a new EW Motive Pattern is found (Bullish/Bearish )
• When a new EW Corrective Pattern is found (Bullish/Bearish )
• When an EW Motive Pattern is invalidated (Bullish/Bearish )
• When an EW Corrective Pattern is invalidated (Bullish/Bearish )
• When possible, a start of a new EW Motive Wave is found (Bullish/Bearish )
• Here is information how you can set these alerts()
Cari dalam skrip untuk "luxalgo"

Buy Sell Calendar [LuxAlgo]The Buy Sell Calendar indicator displays a calendar showing the sentiment for the current day/month. Three different methods can be used to determine this sentiment.
The calendar can also highlight the percentage of bullish days/months for a month/year.
🔶 SETTINGS
Frequency: Calendar frequency, options include "Daily" and "Monthly"
Sentiment Method: Method used to determine the sentiment for the day/month, options include: "Linreg", "Accumulated Deltas", and "Max/Min"
Timezone Offset: UTC time zone offset.
Limit Date: Limit date used by the calendar, the sentiment of days/months outside this limit will not be returned.
🔹 Calendar
Show Calendar: Determines whether to display or hide the calendar.
Location: Location of the calendar on the chart.
Size: Calendar size.
🔶 USAGE
The proposed script can allow users to quickly determine if a specific day/month is considered bullish or bearish. A green cell is used for bullish days/months, while a red one is used for bearish days/months.
Additionally vertical lines are displayed on new days/months with a color highlighting the current sentiment for this specific day/month. Note that this is done retrospectively, the color of a line set at time t might differ at time t+n .
🔶 SENTIMENT METHODS
Determining whether a day/month is bullish or bearish can be done using three different methods. Note that each method makes use of the closing price as the input, and as such can eventually return different results depending on the selected timeframe. Each method is described below:
🔹 Linreg
The Linreg method fit lines between each day/month using the method of least squares and determines if that particular day is bullish or bearish based on the line slope sign. For example, a rising line would indicate a bullish day/month.
🔹 Accumulated Deltas
The method of accumulated deltas simply accumulates bullish and bearish price changes for the current day/month, the result with the highest magnitude determines the sentiment for that day/month.
🔹 Max/Min
The max/min method computes a trailing maximum and a trailing minimum for the current day/month. The sentiment is determined by the price position relative to the average between the obtained maximum/minimum, with a bullish sentiment being determined if price is above the average.

SMA Directional Matrix [LuxAlgo]This script was created in collaboration with alexgrover and displays a simple & elegant panel showing the direction of simple moving averages with periods in a user-selected range (Min, Max). The displayed number in the panel is the period of a simple moving average and the symbol situated at the right of it is associated with the direction this moving average is taking.
Settings
Min: Minimum period of the moving average
Max: Maximum period of the moving average
Src: Source input of the moving averages
Number Of Columns: Number of columns to be displayed in the panel, handy when using a large range of periods.
Usage
Looking at the direction of moving averages with different periods is extremely useful when it comes to having information about the short/mid/long term overall market sentiment, and can also tell us if the market is trending or ranging.
Here we use periods ranging from 25 to 50, we can see that shorter moving averages react to the recent upward price variation, longer-term moving averages however are still affected by the overall downward variation you can see on the image. We can as such get information about the presence of potentials divergences, with shorter-term moving averages reacting to the divergence while the longer-term moving averages will still display the direction of the main trend.
As such the indicator can give information about how clean a trend is, with a clean trend being defined as a variation containing no retracements. When our trend contains no retracement, the mid/long term moving averages will all have the same direction, however, when a retracement is present, the midterm moving averages might be affected by it, thus displaying a direction contrary to the main trend.
When the market is ranging we can expect the panel to display an equal number of decreasing/increasing moving averages.
Possible Issues
When using a large range of periods, you might have an error message showing: "String is too long", try lowering the range of periods by increasing Min or decreasing Max .
If the script displays the error message "Loop is too long to execute", try resetting the settings and change them back to the one you wanted to use.

amir Liquidity Sweeps [amir]this indicator is from luxalgon i think this is the code that made this incdicator never get destroyed by aanyone

Market Structure Trailing Stop MTF [Inspired by LuxAlgo]# Market Structure Trailing Stop MTF
**OPEN-SOURCE SCRIPT**
*208k+ views on original · Modified for MTF Support*
This indicator is a direct adaptation of the renowned **Market Structure Trailing Stop** by **LuxAlgo** (original script: [Market Structure Trailing Stop ]()). The core logic remains untouched, providing dynamic trailing stops based on market structure breaks (CHoCH/BOS). The **only modification** is the addition of **Multi-Timeframe (MTF) support**, allowing users to apply the trailing stops and structures from **higher timeframes (HTF)** directly on their current chart. This enhances usability for traders analyzing cross-timeframe confluence without switching charts.
**Special thanks to LuxAlgo** for releasing this powerful open-source tool under CC BY-NC-SA 4.0. Your contributions to the TradingView community have inspired countless traders—grateful for the solid foundation!
## 🔶 How the Script Works: A Deep Dive
At its heart, this indicator detects **market structure shifts** (bullish or bearish breaks of swing highs/lows) and uses them to generate **adaptive trailing stops**. These stops trail the price while protecting profits and acting as dynamic support/resistance levels. The MTF enhancement pulls this logic from user-specified higher timeframes, overlaying HTF structures and stops on the lower timeframe chart for seamless multi-timeframe analysis.
### Core Logic (Unchanged from LuxAlgo's Original)
1. **Pivot Detection**:
- Uses `ta.pivothigh()` and `ta.pivotlow()` with a user-defined lookback (`length`) to identify swing highs (PH) and lows (PL).
- Coordinates (price `y` and bar index/time `x`) are stored in persistent variables (`var`) for tracking recent pivots.
2. **Market Structure Detection**:
- **Bullish Structure (BOS/CHoCH)**: Triggers when `close > recent PH` (break above swing high).
- If `resetOn = 'CHoCH'`, resets only on major shifts (Change of Character); otherwise, on all breaks.
- Sets trend state `os = 1` (bullish) and highlights the break with a horizontal line (dashed for CHoCH, dotted for BOS).
- Initializes trailing stop at the local minimum (lowest low since the pivot) using a backward loop: `btm = math.min(low , btm)`.
- **Bearish Structure**: Triggers when `close < recent PL`, mirroring the bullish logic (`os = -1`, local maximum for stop).
- Structure state `ms` tracks the break type (1 for bull, -1 for bear, 0 neutral), resetting based on user settings.
3. **Trailing Stop Calculation**:
- Tracks **trailing max/min**:
- On new bull structure: Reset `max = close`.
- On new bear: Reset `min = close`.
- Otherwise: `max = math.max(close, max)` / `min = math.min(close, min)`.
- **Stop Adjustment** (the "trailing" magic):
- On fresh structure: `ts = btm` (bull) or `top` (bear).
- In ongoing trend: Increment/decrement by a percentage of the max/min change:
- Bull: `ts += (max - max ) * (incr / 100)`
- Bear: `ts += (min - min ) * (incr / 100)`
- This creates a **ratcheting effect**: Stops move favorably with the trend but never against it, converging toward price at a controlled rate.
- **Visuals**:
- Plots `ts` line colored by trend (teal for bull, red for bear).
- Fills area between `close` and `ts` (orange on retracements).
- Draws structure lines from pivot to break point.
4. **Edge Cases**:
- Variables like `ph_cross`/`pl_cross` prevent multiple triggers on the same pivot.
- Neutral state (`ms = 0`) preserves prior `max/min` until a new structure.
### MTF Enhancement (Our Addition)
- **request.security() Integration**:
- Wraps the entire core function `f()` in a security call for each timeframe (`tf1`, `tf2`).
- Returns HTF values (e.g., `ts1`, `os1`, structure times/prices) to the chart's context.
- Uses `lookahead=barmerge.lookahead_off` for accurate historical repainting-free data.
- Structures are drawn using `xloc.bar_time` to align HTF lines precisely on the LTF chart.
- **Multi-Output Handling**:
- Separate plots/fills/lines for each TF (e.g., `plot_ts1`, `plot_ts2`).
- Colors and toggles per TF to distinguish HTF1 (e.g., teal/red) from HTF2 (e.g., blue/maroon).
- **Benefits**: Spot HTF bias on LTF entries, e.g., enter longs only if both TF1 (1H) and TF2 (4H) show bullish `os=1`.
This keeps the script lightweight—**no repainting, max 500 lines**, and fully compatible with LuxAlgo's original behavior when TFs are set to the chart's timeframe.
## 🔶 SETTINGS
### Core Parameters
- **Pivot Lookback** (`length = 14`): Bars left/right for pivot detection. Higher = smoother structures, fewer signals; lower = more noise.
- **Increment Factor %** (`incr = 100`): Speed of stop convergence (0-∞). 100% = full ratchet (mirrors max/min exactly); <100% = slower trail, reduces whipsaws.
- **Reset Stop On** (`'CHoCH'`): `'CHoCH'` = Reset only on major reversals (dashed lines); `'All'` = Reset on every BOS/CHoCH (tighter stops).
### MTF Support
- **Timeframe 1** (`tf1 = ""`): HTF for first set (e.g., "1H"). Empty = current chart.
- **Timeframe 2** (`tf2 = ""`): Second HTF (e.g., "4H"). Enables dual confluence.
### Display Toggles
- **Show Structures** (`true`): Draws horizontal lines for breaks (per TF colors).
- **Show Trailing Stop TF1/TF2** (`true`): Plots the stop line.
- **Show Fill TF1/TF2** (`true`): Area fill between close and stop.
### Candle Coloring (Optional)
- **Color Candles** (`false`): Enables custom `plotcandle` for body/wick/border.
- **Candle Color Based On TF** (`"None"`): `"TF1"`, `"TF2"`, or none. Colors bull trend green, bear red.
- **Candle Colors**: Separate inputs for bull/bear body, wick, border (e.g., solid green body, transparent wick).
### Alerts
- **Enable MS Break Alerts** (`false`): Notifies on structure breaks (bull/bear per TF) **only on bar close** (`barstate.isconfirmed` + `alert.freq_once_per_bar_close`).
- **Enable Stop Hit Alerts** (`false`): Triggers on stop breaches (long/short per TF), using `ta.crossunder/crossover`.
### Colors
- **TF1 Colors**: Bullish (teal), Bearish (red), Retracement (orange).
- **TF2 Colors**: Bullish (blue), Bearish (maroon), Retracement (orange).
- **Area Transparency** (`80`): Fill opacity (0-100).
## 🔶 USAGE
Trailing stops shine in **trend-following strategies**:
- **Entries**: Use structure breaks as signals (e.g., long on bullish BOS from HTF1).
- **Exits**: Trail stops for profit-locking; alert on hits for automation.
- **Confluence**: Overlay HTF1 (e.g., 1H) for bias, HTF2 (e.g., Daily) for major levels—enter LTF only on alignment.
- **Risk Management**: Lower `incr` avoids early stops in chop; reset on `'All'` for aggressive trailing.
! (i.imgur.com)
*HTF1 shows bullish structure (teal line), trailing stop ratchets up—long entry confirmed on LTF pullback.*
! (i.imgur.com)
*TF1 (blue) bearish, TF2 (red) neutral—avoid shorts until alignment.*
! (i.imgur.com)
*Colored based on TF1 trend: Green bodies on bull `os=1`.*
Pro Tip: Test on demo—pair with LuxAlgo's other tools like Smart Money Concepts for full structure ecosystem.
## 🔶 DETAILS: Mathematical Breakdown
On bullish break:
- Local min: `btm = ta.lowest(n - ph_x)` (optimized loop equivalent).
- Stop init: `ts = btm`.
- Update: `Δmax = max - max `, `ts_new = ts + Δmax * (incr/100)`.
Bearish mirrors with `Δmin` (negative, so decrements `ts`).
In MTF: HTF `time` aligns lines via `line.new(htf_time, level, current_time, level, xloc.bar_time)`.
No logs/math libs needed—pure Pine v5 efficiency.
## Disclaimer
This is for educational purposes. Not financial advice. Backtest thoroughly. Original by LuxAlgo—modify at your risk. See TradingView's (www.tradingview.com). Licensed under CC BY-NC-SA 4.0 (attribution to LuxAlgo required).

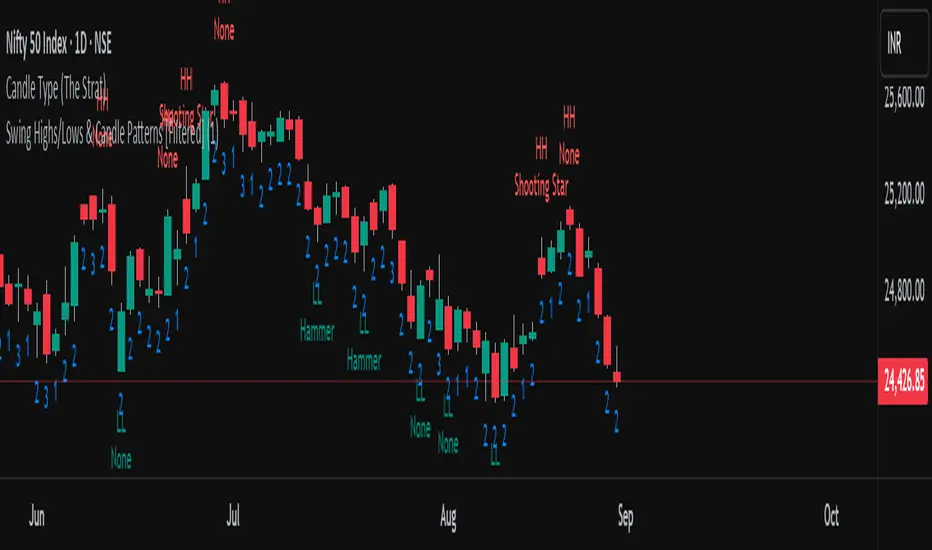
Swing Highs/Lows & Candle Patterns[LuxAlgo] [Filtered]Swing Highs/Lows & Candle Patterns - Tweaked Version
This indicator is a customized and enhanced version of LuxAlgo’s original Swing Highs/Lows & Candle Patterns indicator. It identifies and labels critical swing high and swing low points to help visualize market structure, alongside detecting key reversal candlestick patterns such as Hammer, Inverted Hammer, Bullish Engulfing, Hanging Man, Shooting Star, and Bearish Engulfing.
With added options to selectively display only Lower Highs (LH) and Higher Lows (HL), this tweaked version offers greater flexibility for traders focusing on specific market dynamics. Users can also customize the lookback length and label styling to fit their preferences.
Credit to LuxAlgo for the original concept and foundation of this powerful tool, which this script builds upon to support more tailored technical analysis. Ideal for swing traders and technical analysts seeking improved entry and exit signals through a combination of price swings and candlestick pattern recognition.
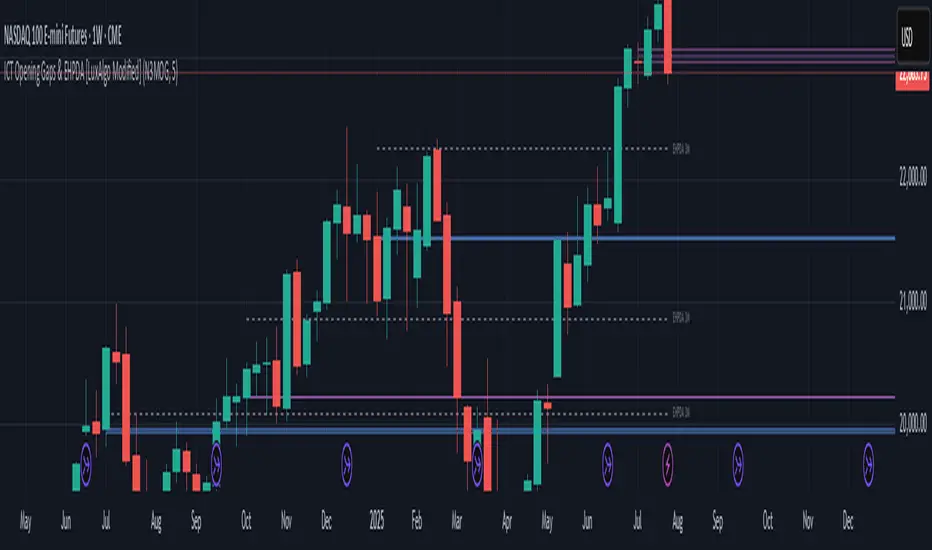
ICT Opening Gaps & EHPDA [LuxAlgo Modified]Modified version of LuxAlgo's original opening gap indicator to include NMOGs and NYOGs
Horns Pattern Identifier with alertsUpdated version of LuxAlgo indicator to add the ability to change the displayed line widths and to raise alerts when the pattern is detected.
The original indicator and it's history are at
Their description:
The following script detects regular and inverted horn patterns. Detected patterns are displayed alongside their respective confirmation and take profit levels derived from the pattern measure rule. Breakout of the confirmation levels are highlighted with labels.
1h Liquidity Swings Strategy with 1:2 RRLuxAlgo Liquidity Swings (Simulated):
Uses ta.pivothigh and ta.pivotlow to detect 1h swing highs (resistance) and swing lows (support).
The lookback parameter (default 5) controls swing point sensitivity.
Entry Logic:
Long: Uptrend, price crosses above 1h swing low (ta.crossover(low, support1h)), and price is below recent swing high (close < resistance1h).
Short: Downtrend, price crosses below 1h swing high (ta.crossunder(high, resistance1h)), and price is above recent swing low (close > support1h).
Take Profit (1:2 Risk-Reward):
Risk:
Long: risk = entryPrice - initialStopLoss.
Short: risk = initialStopLoss - entryPrice.
Take-profit price:
Long: takeProfitPrice = entryPrice + 2 * risk.
Short: takeProfitPrice = entryPrice - 2 * risk.
Set via strategy.exit’s limit parameter.
Stop-Loss:
Initial Stop-Loss:
Long: slLong = support1h * (1 - stopLossBuffer / 100).
Short: slShort = resistance1h * (1 + stopLossBuffer / 100).
Breakout Stop-Loss:
Long: close < support1h.
Short: close > resistance1h.
Managed via strategy.exit’s stop parameter.
Visualization:
Plots:
50-period SMA (trendMA, blue solid line).
1h resistance (resistance1h, red dashed line).
1h support (support1h, green dashed line).
Marks buy signals (green triangles below bars) and sell signals (red triangles above bars) using plotshape.
Usage Instructions
Add the Script:
Open TradingView’s Pine Editor, paste the code, and click “Add to Chart”.
Set Timeframe:
Use the 1-hour (1h) chart for intraday trading.
Adjust Parameters:
lookback: Swing high/low lookback period (default 5). Smaller values increase sensitivity; larger values reduce noise.
stopLossBuffer: Initial stop-loss buffer (default 0.5%).
maLength: Trend SMA period (default 50).
Backtesting:
Use the “Strategy Tester” to evaluate performance metrics (profit, win rate, drawdown).
Optimize parameters for your target market.
Notes on Limitations
LuxAlgo Liquidity Swings:
Simulated using ta.pivothigh and ta.pivotlow. LuxAlgo may include proprietary logic (e.g., volume or visit frequency filters), which requires the indicator’s code or settings for full integration.
Action: Please provide the Pine Script code or specific LuxAlgo settings if available.
Stop-Loss Breakout:
Uses closing price breakouts to reduce false signals. For more sensitive detection (e.g., high/low-based), I can modify the code upon request.
Market Suitability:
Ideal for high-liquidity markets (e.g., BTC/USD, EUR/USD). Choppy markets may cause false breakouts.
Action: Backtest in your target market to confirm suitability.
Fees:
Take-profit/stop-loss calculations exclude fees. Adjust for trading costs in live trading.
Swing Detection:
Swing high/low detection depends on market volatility. Optimize lookback for your market.
Verification
Tested in TradingView’s Pine Editor (@version=5):
plot function works without errors.
Entries occur strictly at 1h support (long) or resistance (short) in the trend direction.
Take-profit triggers at 1:2 risk-reward.
Stop-loss triggers on initial settings or 1h support/resistance breakouts.
Backtesting performs as expected.
Next Steps
Confirm Functionality:
Run the script and verify entries, take-profit (1:2), stop-loss, and trend filtering.
If issues occur (e.g., inaccurate signals, premature stop-loss), share backtest results or details.
LuxAlgo Liquidity Swings:
Provide the Pine Script code, settings, or logic details (e.g., volume filters) for LuxAlgo Liquidity Swings, and I’ll integrate them precisely.

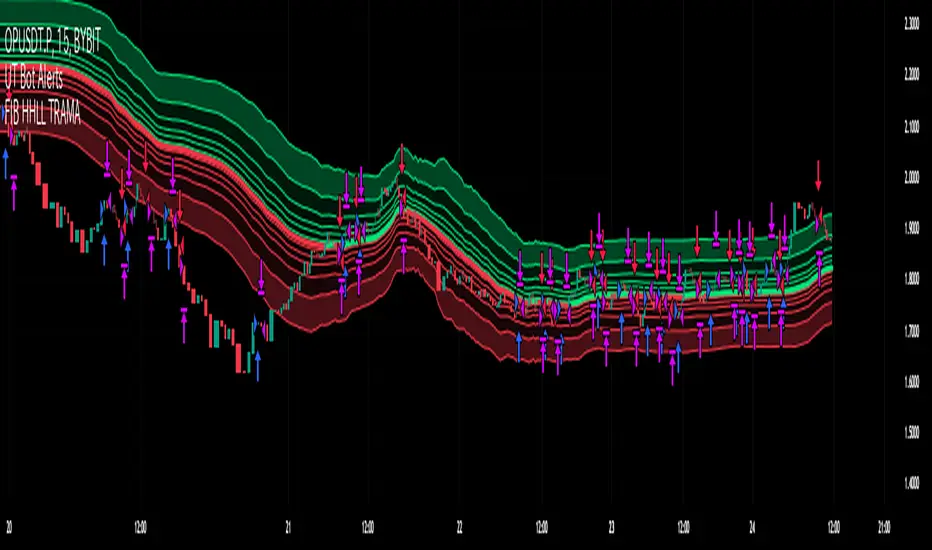
Fibonacci HH LL TRAMA BandLuxAlgo's Trend Moving Adaptive Moving Average was used as a reference to create bands by reading the highest and lowest prices of past bars based on Fibonacci numbers and then multiplying them by the Fibonacci ratio.
LuxAlgo/ LuxAlgo/
In particular, the so-called TRAMA is characterized by its adaptation to the average of the highest and lowest prices over a specific period of time and is used to identify support/resistance.
In order to apply this feature to the maximum extent possible, I used the high or low prices as the source of input, rather than the closing price.
For example,
src = high
not original like
src = close
In addition, I created 6 levels by multiplying the Fibonacci ratio
//Midline
mah = ama1
mal = ama2
m = (mah + mal)/2
//Half Mean Range
dist = (mah - mal)/2
//Levels
h6 = m + dist * 11.089
h5 = m + dist * 6.857
h4 = m + dist * 4.235
h3 = m + dist * 2.618
h2 = m + dist * 1.618
h1 = m + dist * 0.618
l1 = m - dist * 0.618
l2 = m - dist * 1.618
l3 = m - dist * 2.618
l4 = m - dist * 4.235
l5 = m - dist * 6.857
l6 = m - dist * 11.089
If you want to use it for scalping, such as 15 minutes, you can include Fibonacci numbers such as 21,34,55 for a quick reaction type to detect the trend. Also, by including Fibonacci numbers such as 89,144,233, you can see where you stand in the larger trend. Some examples are included below.
For Investors
BTCUSDT 1day Chart Fibonacci number "55"
For Daytraders
BTCUSDT 4hour Chart Fibonacci number "34"
For Scalpers
BTCUSDT 15min Chart Fibonacci number "55"
BTCUSDT 15min Chart Fibonacci number "89"
BTCUSDT 15min Chart Fibonacci number "233"
Fibonacci numbers are 1, 1, 2, 3, 5, 8, 13, 21, 34, 55, 89, 144, 233, 377, 610, etc.,
Fibonacci ratios are 0.618, 1.618, 2.618, 4.236, 6.854, 11.089, etc.,
Nadaraya-Watson Envelope [Dynamic Adaptive Working]LuxAlgo'a kernel channel-based, modified for dynamic stochastic bandwidth adaptation.
Nadaraya-Watson Envelope , "NWE Adaptive (Working)"

TradeIQ - Crazy Scalping Trading Strategy [Kaspricci]This strategy script is a combination of two indicators developed by LuxAlgo:
Triangular Momentum Oscillator & Real Time Divergences ( TMO )
Adjustable MA & Alternating Extremities (AMA)
The script combines the BUY and SELL signals from the TMO indicator with the BUY and SELL extremities shown by the AMA script and waits for the smoothed candles to grow in size. It places a SHORT or LONG order and sets a stop loss at the latest swing high or low (highes high or lowest low for a defined number of recent bars). A new LONG trade is highlighted by a green background. A new SHORT trade is highlighted by red background.
The trades will be closed once a new TMO indicator BUY or SELL signal appears or the color of the AMA extremities is switching from green to red and vice versa.
All parameters of TOM and AMA indicators are added as well and work the same way as in the original scripts provided by LuxAlgo.
The idea to combine these two indicators has been provided to me by TradIQ in his youtube video.
Please leave a comment in case you find a bug. In case you find a combination of parameters with a high win rat and high PnL I would be interested as well.

Stock Relative Strength Rotation Graph🔄 Visualizing Market Rotation & Momentum (Stock RSRG)
This tool visualizes the sector rotation of your watchlist on a single graph. Instead of checking 40 different charts, you can see the entire market cycle in one view. It plots Relative Strength (Trend) vs. Momentum (Velocity) to identify which assets are leading the market and which are lagging.
📜 Credits & Disclaimer
Original Code: Adapted from the open-source " Relative Strength Scatter Plot " by LuxAlgo.
Trademark: This tool is inspired by Relative Rotation Graphs®. Relative Rotation Graphs® is a registered trademark of JOOS Holdings B.V. This script is neither endorsed, nor sponsored, nor affiliated with them.
📊 How It Works (The Math)
The script calculates two metrics for every symbol against a benchmark (Default: SPX):
X-Axis (RS-Ratio): Is the trend stronger than the benchmark? (>100 = Yes)
Y-Axis (RS-Momentum): Is the trend accelerating? (>100 = Yes)
🧩 The 4 Market Quadrants
🟩 Leading (Top-Right): Strong Trend + Accelerating. (Best for holding).
🟦 Improving (Top-Left): Weak Trend + Accelerating. (Best for entries).
⬜ Weakening (Bottom-Right): Strong Trend + Decelerating. (Watch for exits).
🟥 Lagging (Bottom-Left): Weak Trend + Decelerating. (Avoid).
✨ Significant Improvements
This open-source version adds unique features not found in standard rotation scripts:
📝 Quick-Input Engine: Paste up to 40 symbols as a single comma-separated list (e.g., NVDA, AMD, TSLA). No more individual input boxes.
🎯 Quadrant Filtering: You can now hide specific quadrants (like "Lagging") to clear the noise and focus only on actionable setups.
🐛 Trajectory Trails: Visualizes the historical path of the rotation so you can see the direction of momentum.
🛠️ How to Use
Paste Watchlist: Go to settings and paste your symbols (e.g., US Sectors: XLK, XLF, XLE...).
Find Entries: Look for tails moving from Improving ➔ Leading.
Find Exits: Be cautious when tails move from Leading ➔ Weakening.
Zoom: Use the "Scatter Plot Resolution" setting to zoom in or out if dots are bunched up.

PriceActionLibrary "PriceAction"
Hi all!
This library will help you to plot the market structure and liquidity. By now, the only part in the price action section is liquidity, but I plan to add more later on. The market structure will be split into two parts, 'Internal' and 'Swing' with separate pivot lengths. For these two trends it will show you:
• Break of structure (BOS)
• Change of character (CHoCH/CHoCH+) (mandatory)
• Equal high/low (EQH/EQL)
It's inspired by "Smart Money Concepts (SMC) " by LuxAlgo.
This library is now the same code as the code in my library 'MarketStructure', but it has evolved into a more price action oriented library than just a market structure library. This is more accurate and I will continue working on this library to keep it growing.
This code does not provide any examples, but you can look at my indicators 'Market structure' () and 'Order blocks' (), where I use the 'MarketStructure' library (which is the same code).
Market structure
Both of these market structures can be enabled/disabled by setting them to 'na'. The pivots lengths can be configured separately. The pivots found will be the 'base' of and will show you when price breaks it. When that happens a break of structure or a change of character will be created. The latest 5 pivots found within the current trends will be kept to take action on. They are cleared on a change of character, so nothing (break of structures or change of characters) can happen on pivots before a trend change. The internal market structure is shown with dashed lines and swing market structure is shown with solid lines.
Labels for a change of character can have either the text 'CHoCH' or 'CHoCH+'. A Change of Character plus is formed when price fails to form a higher high or a lower low before reversing. Note that a pivot that is created after the change of character might have a higher high or a lower low, thus not making the break a 'CHoCH+'. This is not changed after the pivot is found but is kept as is.
A break of structure is removed if an earlier pivot within the same trend is broken, i.e. another break of structure (with a longer distance) is created. Like in the images below, the first pivot (in the first image) is removed when an earlier pivot's higher price within the same trend is broken (the second image):
[image [https://www.tradingview.com/x/PRP6YtPA/
Equal high/lows have a configurable color setting and can be configured to be extended to the right. Equal high/lows are only possible if it's not been broken by price. A factor (percentage of width) of the Average True Length (of length 14) that the pivot must be within to to be considered an Equal high/low. Equal highs/lows can be of 2 pivots or more.
You are able to show the pivots that are used. "HH" (higher high), "HL" (higher low), "LH" (lower high), "LL" (lower low) and "H"/"L" (for pivots (high/low) when the trend has changed) are the labels used. There are also labels for break of structures ('BOS') and change of characters ('CHoCH' or 'CHoCH+'). The size of these texts is set in the 'FontSize' setting.
When programming I focused on simplicity and ease of read. I did not focus on performance, I will do so if it's a problem (haven't noticed it is one yet).
You can set alerts for when a change of character, break of structure or an equal high/low (new or an addition to a previously found) happens. The alerts that are fired are on 'once_per_bar_close' to avoid repainting. This has the drawback to alert you when the bar closes.
Price action
The indicator will create lines and zones for spotted liquidity. It will draw a line (with dotted style) at the price level that was liquidated, but it will also draw a zone from that level to the bar that broke the pivot high or low price. If that zone is large the liquidation is big and might be significant. This can be disabled in the settings. You can also change the confirmation candles (that does not close above or below the pivot level) needed after a liquidation and how many pivots back to look at.
The lines and boxes drawn will look like this if the color is orange:
Hope this is of help!
Will draw out the market structure for the disired pivot length.
Liqudity(liquidity)
Will draw liquidity.
Parameters:
liquidity (Liquidity) : The 'PriceAction.Liquidity' object.
Pivot(structure)
Sets the pivots in the structure.
Parameters:
structure (Structure)
PivotLabels(structure)
Draws labels for the pivots found.
Parameters:
structure (Structure)
EqualHighOrLow(structure)
Draws the boxes for equal highs/lows. Also creates labels for the pivots included.
Parameters:
structure (Structure)
BreakOfStructure(structure)
Will create lines when a break of strycture occures.
Parameters:
structure (Structure)
Returns: A boolean that represents if a break of structure was found or not.
ChangeOfCharacter(structure)
Will create lines when a change of character occures. This line will have a label with "CHoCH" or "CHoCH+".
Parameters:
structure (Structure)
Returns: A boolean that represents if a change of character was found or not.
VisualizeCurrent(structure)
Will create a box with a background for between the latest high and low pivots. This can be used as the current trading range (if the pivots broke strucure somehow).
Parameters:
structure (Structure)
StructureBreak
Holds drawings for a structure break.
Fields:
Line (series line) : The line object.
Label (series label) : The label object.
Pivot
Holds all the values for a found pivot.
Fields:
Price (series float) : The price of the pivot.
BarIndex (series int) : The bar_index where the pivot occured.
Type (series int) : The type of the pivot (-1 = low, 1 = high).
Time (series int) : The time where the pivot occured.
BreakOfStructureBroken (series bool) : Sets to true if a break of structure has happened.
LiquidityBroken (series bool) : Sets to true if a liquidity of the price level has happened.
ChangeOfCharacterBroken (series bool) : Sets to true if a change of character has happened.
Structure
Holds all the values for the market structure.
Fields:
LeftLength (series int) : Define the left length of the pivots used.
RightLength (series int) : Define the right length of the pivots used.
Type (series Type) : Set the type of the market structure. Two types can be used, 'internal' and 'swing' (0 = internal, 1 = swing).
Trend (series int) : This will be set internally and can be -1 = downtrend, 1 = uptrend.
EqualPivotsFactor (series float) : Set how the limits are for an equal pivot. This is a factor of the Average True Length (ATR) of length 14. If a low pivot is considered to be equal if it doesn't break the low pivot (is at a lower value) and is inside the previous low pivot + this limit.
ExtendEqualPivotsZones (series bool) : Set to true if you want the equal pivots zones to be extended.
ExtendEqualPivotsStyle (series string) : Set the style of equal pivot zones.
ExtendEqualPivotsColor (series color) : Set the color of equal pivot zones.
EqualHighs (array) : Holds the boxes for zones that contains equal highs.
EqualLows (array) : Holds the boxes for zones that contains equal lows.
BreakOfStructures (array) : Holds all the break of structures within the trend (before a change of character).
Pivots (array) : All the pivots in the current trend, added with the latest first, this is cleared when the trend changes.
FontSize (series int) : Holds the size of the font displayed.
AlertChangeOfCharacter (series bool) : Holds true or false if a change of character should be alerted or not.
AlertBreakOfStructure (series bool) : Holds true or false if a break of structure should be alerted or not.
AlerEqualPivots (series bool) : Holds true or false if equal highs/lows should be alerted or not.
Liquidity
Holds all the values for liquidity.
Fields:
LiquidityPivotsHigh (array) : All high pivots for liquidity.
LiquidityPivotsLow (array) : All low pivots for liquidity.
LiquidityConfirmationBars (series int) : The number of bars to confirm that a liquidity is valid.
LiquidityPivotsLookback (series int) : A number of pivots to look back for.
FontSize (series int) : Holds the size of the font displayed.
PriceAction
Holds all the values for the general price action and the market structures.
Fields:
Liquidity (Liquidity)
Swing (Structure) : Placeholder for all objects used for the swing market structure.
Internal (Structure) : Placeholder for all objects used for the internal market structure.

Fractals + FVG [Combined]Звісно, ось варіант опису англійською, який можна використати для публікації індикатора в TradingView.
Description
This script combines two powerful and widely-used trading concepts into a single, comprehensive indicator: Bill Williams Fractals with dynamic support/resistance lines and Fair Value Gaps (FVG) based on the popular logic from LuxAlgo.
The goal is to provide a cleaner chart by merging two essential tools, allowing traders to analyze market structure and imbalances simultaneously.
Features
1. Williams Fractals with Invalidation Lines
This part of the indicator identifies classic Bill Williams fractals and enhances them with a unique visualization feature.
Fractal Detection: Automatically identifies both bullish (bottom) and bearish (top) fractals. You can choose between a 3-bar or 5-bar pattern in the settings.
Dynamic S/R Lines: A horizontal line is automatically drawn from every confirmed fractal, acting as a potential support or resistance level.
Automatic Invalidation: A line is considered "invalidated" or breached when the body of a candle closes past it. When this happens, the line stops extending, changes its color to the "invalidated" color, and remains on the chart as a historical reference. This provides a clear, objective signal that a level has been broken.
Customization: You can fully customize the colors for the support, resistance, and invalidated lines to match your chart theme.
2. Fair Value Gaps (FVG) / Imbalance
This module incorporates the robust FVG detection logic from LuxAlgo to automatically identify and display market imbalances.
FVG Detection: Highlights bullish and bearish Fair Value Gaps on the chart with colored boxes, representing inefficiencies in price delivery.
Automatic Mitigation: The FVG boxes are automatically removed from the chart once the price has "mitigated" or filled the gap, keeping your workspace clean and focused on active imbalances.
Multi-Timeframe (MTF): You can set the indicator to find and display FVGs from a higher timeframe directly on your current chart.
Dashboard: An optional on-screen dashboard provides a quick summary of the total count of bullish/bearish FVGs and the percentage that have been mitigated.
Full Customization: Control the colors of FVG boxes, extend their length, and configure other visual style settings.
How to Use
Fractal Lines: Use the active support and resistance lines as key levels for potential bounces or breaks. A line's invalidation can serve as confirmation of a shift in market structure.
FVG Zones: Fair Value Gaps often act as "magnets" for price. Use these zones as potential targets for your trades or as areas of interest for entries when price retraces to fill the imbalance.
Combined Strategy: The true power of this indicator comes from combining both concepts. For example, a bullish FVG forming near a key fractal support level can create a high-probability confluence zone for a long entry. Similarly, a break and invalidation of a fractal resistance line might signal that price is heading towards the next bearish FVG above.
This indicator is a tool for analysis and should be used in conjunction with your own trading strategy and risk management rules.

Smart Money Concepts by WeloTradesThe "Smart Money Concepts by WeloTrades" indicator is designed to offer traders a comprehensive tool that integrates multiple advanced features to aid in market analysis. By combining order blocks, liquidity levels, fair value gaps, trendlines, and market structure analysis, the indicator provides a holistic approach to understanding market dynamics and making informed trading decisions.
Components and Their Integration:
Order Blocks and Breaker Blocks Detection
Functionality: Order blocks represent areas where significant buying or selling occurred, creating potential support or resistance zones. Breaker blocks signal potential reversals.
Integration: By detecting and visualizing these blocks, the indicator helps traders identify key levels where price might react, aiding in entry and exit decisions. The customizable settings allow traders to adjust the visibility and parameters to suit their specific trading strategy.
Liquidity Levels Analysis
Functionality: Liquidity levels indicate zones where significant price movements can occur due to the presence of large orders. These are areas where smart money might be executing trades.
Integration: By tracking these high-probability liquidity areas, traders can anticipate potential price movements. Customizable display limits and mitigation strategies ensure that the information is tailored to the trader’s needs, providing precise and actionable insights.
Fair Value Gaps (FVG)
Functionality: Fair value gaps highlight areas where there is an imbalance between buyers and sellers. These gaps often represent potential trading opportunities.
Integration: The ability to identify and analyze FVGs helps traders spot potential entries based on market inefficiencies. The touch and break detection functionalities provide further refinement, enhancing the precision of trading signals.
Trendlines
Functionality: Trendlines help in identifying the direction of the market and potential reversal points. The additional trendline adds a layer of confirmation for breaks or retests.
Integration: Automatically drawn trendlines assist traders in visualizing market trends and making decisions about potential entries and exits. The additional trendline for stronger confirmation reduces the risk of false signals, providing more reliable trading opportunities.
Market Structure Analysis
Functionality: Understanding market structure is crucial for identifying key support and resistance levels and overall market dynamics. This component displays internal, external, and composite market structures.
Integration: By automatically highlighting shifts in market structure, the indicator helps traders recognize important levels and potential changes in market direction. This analysis is critical for strategic planning and execution in trading.
Customizable Alerts
Functionality: Alerts ensure that traders do not miss significant market events, such as the formation or breach of order blocks, liquidity levels, and trendline interactions.
Integration: Customizable alerts enhance the user experience by providing timely notifications of key events. This feature ensures that traders can act quickly and efficiently, leveraging the insights provided by the indicator.
Interactive Visualization
Functionality: Customizable visual aspects of the indicator allow traders to tailor the display to their preferences and trading style.
Integration: This feature enhances user engagement and usability, making it easier for traders to interpret the data and make informed decisions. Personalization options like colors, styles, and display formats improve the overall effectiveness of the indicator.
How Components Work Together
Comprehensive Market Analysis
Each component of the indicator addresses a different aspect of market analysis. Order blocks and liquidity levels highlight potential support and resistance zones, while fair value gaps and trendlines provide additional context for potential entries and exits. Market structure analysis ties everything together by offering a broad view of market dynamics.
Synergistic Insights
The integration of multiple features allows for cross-validation of trading signals. For instance, an order block coinciding with a high-probability liquidity level and a fair value gap can provide a stronger signal than any of these features alone. This synergy enhances the reliability of the insights and trading signals generated by the indicator.
Enhanced Decision Making
By combining these advanced features into a single tool, traders are equipped with a powerful resource for making informed decisions. The customizable alerts and interactive visualization further support this by ensuring that traders can act quickly on the insights provided.
Order Blocks ( OB) & Breaker Blocks (BB) Visuals:
📝 OB Input Settings
📊 Timeframe #1
TF #1🕑: Enable or disable Timeframe 1.
What it is: A boolean input to toggle the use of the first timeframe.
What it does: Enables or disables Timeframe 1 for the OB settings.
How to use it: Check or uncheck the box to enable or disable.
📊 Timeframe 1 Selection
Timeframe #1🕑: Select the timeframe for Timeframe 1.
What it is: A dropdown to select the desired timeframe.
What it does: Sets the timeframe for Timeframe 1.
How to use it: Choose a timeframe from the dropdown list.
📊 Timeframe #2
TF #2🕑: Enable or disable Timeframe 2.
What it is: A boolean input to toggle the use of the second timeframe.
What it does: Enables or disables Timeframe 2 for the OB settings.
How to use it: Check or uncheck the box to enable or disable.
📊 Timeframe 2 Selection
Timeframe #2🕑: Select the timeframe for Timeframe 2.
What it is: A dropdown to select the desired timeframe.
What it does: Sets the timeframe for Timeframe 2.
How to use it: Choose a timeframe from the dropdown list.
Additional Info: Higher TF Chart & Lower TF Setting / Lower TF Chart & Higher TF Setting.
📏 Show OBs
OB (Length)📏: Toggle the display of Order Blocks.
What it is: A boolean input to enable or disable the display of Order Blocks.
What it does: Shows or hides Order Blocks based on the selected swing length.
How to use it: Check or uncheck the box to enable or disable.
📏 Swing Length Option
Swing Length Option: Select the swing length option.
What it is: A dropdown to choose between SHORT, MID, LONG, or CUSTOM.
What it does: Sets the length of swings for Order Blocks.
How to use it: Choose an option from the dropdown.
Additional Info: Default lengths are SHORT=10, MID=28, LONG=50.
🔧 Custom Swing Length
🔧custom: Specify a custom swing length.
What it is: An integer input for setting a custom swing length.
What it does: Overrides the default swing lengths if set to CUSTOM.
How to use it: Enter a custom integer value (only shown when CUSTOM is selected).
📛 Show BBs
BB (Method)📛: Toggle the display of Breaker Blocks.
What it is: A boolean input to enable or disable the display of Breaker Blocks.
What it does: Shows or hides Breaker Blocks.
How to use it: Check or uncheck the box to enable or disable.
📛 OB End Method
OB End Method: Select the method for determining the end of a Breaker Block.
What it is: A dropdown to choose between Wick and Close.
What it does: Sets the criteria for when a Breaker Block is considered mitigated.
How to use it: Choose an option from the dropdown.
Additional Info: Wicks: OB is mitigated when the price wicks through the OB Level. Close: OB is mitigated when the closing price is within the OB Level.
🔍 Max Bullish Zones
🔍Max Bullish: Set the maximum number of Bullish Order Blocks to display.
What it is: A dropdown to select the maximum number of Bullish Order Blocks.
What it does: Limits the number of Bullish Order Blocks shown on the chart.
How to use it: Choose a value from the dropdown (1-10).
🔍 Max Bearish Zones
🔍Max Bearish: Set the maximum number of Bearish Order Blocks to display.
What it is: A dropdown to select the maximum number of Bearish Order Blocks.
What it does: Limits the number of Bearish Order Blocks shown on the chart.
How to use it: Choose a value from the dropdown (1-10).
🟩 Bullish OB Color
Bullish OB Color: Set the color for Bullish Order Blocks.
What it is: A color picker to set the color of Bullish Order Blocks.
What it does: Changes the color of Bullish Order Blocks on the chart.
How to use it: Select a color from the color picker.
🟥 Bearish OB Color
Bearish OB Color: Set the color for Bearish Order Blocks.
What it is: A color picker to set the color of Bearish Order Blocks.
What it does: Changes the color of Bearish Order Blocks on the chart.
How to use it: Select a color from the color picker.
🔧 OB & BB Range
↔ OB & BB Range: Select the range option for OB and BB.
What it is: A dropdown to choose between RANGE and CUSTOM.
What it does: Sets how far the OB or BB should extend.
How to use it: Choose an option from the dropdown.
Additional Info: RANGE = Current price, CUSTOM = Adjustable Range.
🔧 Custom OB & BB Range
🔧Custom: Specify a custom range for OB and BB.
What it is: An integer input for setting a custom range.
What it does: Defines how far the OB or BB should go, based on a custom value.
How to use it: Enter a custom integer value (range: 1000-500000).
💬 Text Options
💬Text Options: Set text size and color for OB and BB.
What it is: A dropdown to select text size and a color picker to choose text color.
What it does: Changes the size and color of the text displayed for OB and BB.
How to use it: Select a size from the dropdown and a color from the color picker.
💬 Show Timeframe OB
Text: Toggle to display the timeframe of OB.
What it is: A boolean input to show or hide the timeframe text for OB.
What it does: Displays the timeframe information for Order Blocks on the chart.
How to use it: Check or uncheck the box to enable or disable.
💬 Show Volume
Volume: Toggle to display the volume of OB.
What it is: A boolean input to show or hide the volume information for Order Blocks.
What it does: Displays the volume information for Order Blocks on the chart.
How to use it: Check or uncheck the box to enable or disable.
Additional Info:
What it represents: The volume displayed represents the total trading volume that occurred during the formation of the Order Block. This can indicate the level of participation or interest in that price level.
How it's calculated: The volume is the sum of all traded volumes within the candles that form the Order Block.
What it means: Higher volume at an Order Block level may suggest stronger support or resistance. It shows the amount of trading activity and can be an indicator of the potential strength or validity of the Order Block.
Why it's shown: To give traders an idea of the market participation and to help assess the strength of the Order Block.
💬 Show Percentage
%: Toggle to display the percentage of OB.
What it is: A boolean input to show or hide the percentage information for Order Blocks.
What it does: Displays the percentage information for Order Blocks on the chart.
How to use it: Check or uncheck the box to enable or disable.
Additional Info:
What it represents: The percentage displayed usually represents the proportion of price movement relative to the Order Block.
How it's calculated: This can be the percentage move from the start to the end of the Order Block or the retracement level that price has reached relative to the Order Block's range.
What it means: It helps traders understand the extent of price movement within the Order Block and can indicate the significance of the price level.
Why it's shown: To provide a clearer understanding of the price dynamics and the importance of the Order Block within the overall price movement.
Additional Information
Volume Example: If an Order Block forms over three candles with volumes of 100, 150, and 200, the total volume displayed for that Order Block would be 450.
Percentage Example: If the price moves from 100 to 110 within an Order Block, and the total range of the Order Block is from 100 to 120, the percentage shown might be 50% (since the price has moved halfway through the Order Block's range).
Liquidity Levels visuals:
📊 Liquidity Levels Input Settings
📊 Current Timeframe
TF #1🕑: Enable or disable the current timeframe.
What it is: A boolean input to toggle the use of the current timeframe.
What it does: Enables or disables the display of liquidity levels for the current timeframe.
How to use it: Check or uncheck the box to enable or disable.
📊 Higher Timeframe
Higher Timeframe: Select the higher timeframe for liquidity levels.
What it is: A dropdown to select the desired higher timeframe.
What it does: Sets the higher timeframe for liquidity levels.
How to use it: Choose a timeframe from the dropdown list.
📏 Liquidity Length Option
📏Liquidity Length: Select the length for liquidity levels.
What it is: A dropdown to choose between SHORT, MID, LONG, or CUSTOM.
What it does: Sets the length of swings for liquidity levels.
How to use it: Choose an option from the dropdown.
Additional Info: Default lengths are SHORT=10, MID=28, LONG=50.
🔧 Custom Liquidity Length
🔧custom: Specify a custom length for liquidity levels.
What it is: An integer input for setting a custom swing length.
What it does: Overrides the default liquidity lengths if set to CUSTOM.
How to use it: Enter a custom integer value (only shown when CUSTOM is selected).
📛 Mitigation Method
📛Mitigation (Method): Select the method for determining the mitigation of liquidity levels.
What it is: A dropdown to choose between Close and Wick.
What it does: Sets the criteria for when a liquidity level is considered mitigated.
How to use it: Choose an option from the dropdown.
Additional Info:
Wick: Level is mitigated when the price wicks through the level.
Close: Level is mitigated when the closing price is within the level.
📛 Display Mitigated Levels
-: Select to display or hide mitigated levels.
What it is: A dropdown to choose between Remove and Show.
What it does: Displays or hides mitigated liquidity levels.
How to use it: Choose an option from the dropdown.
Additional Info:
Remove: Hide mitigated levels.
Show: Display mitigated levels.
🔍 Max Buy Side Liquidity
🔍Max Buy Side Liquidity: Set the maximum number of Buy Side Liquidity Levels to display.
What it is: An integer input to set the maximum number of Buy Side Liquidity Levels.
What it does: Limits the number of Buy Side Liquidity Levels shown on the chart.
How to use it: Enter a value between 0 and 50.
🟦 Buy Side Liquidity Color
Buy Side Liquidity Color: Set the color for Buy Side Liquidity Levels.
What it is: A color picker to set the color of Buy Side Liquidity Levels.
What it does: Changes the color of Buy Side Liquidity Levels on the chart.
How to use it: Select a color from the color picker.
Additional Info:
Tooltip: Set the maximum number of Buy Side Liquidity Levels to display. Default: 5, Min: 1, Max: 50.
If liquidity levels are not displayed as expected, try increasing the max count.
🔍 Max Sell Side Liquidity
🔍Max Sell Side Liquidity: Set the maximum number of Sell Side Liquidity Levels to display.
What it is: An integer input to set the maximum number of Sell Side Liquidity Levels.
What it does: Limits the number of Sell Side Liquidity Levels shown on the chart.
How to use it: Enter a value between 0 and 50.
🟥 Sell Side Liquidity Color
Sell Side Liquidity Color: Set the color for Sell Side Liquidity Levels.
What it is: A color picker to set the color of Sell Side Liquidity Levels.
What it does: Changes the color of Sell Side Liquidity Levels on the chart.
How to use it: Select a color from the color picker.
Additional Info:
Tooltip: Set the maximum number of Sell Side Liquidity Levels to display. Default: 5, Min: 1, Max: 50.
If liquidity levels are not displayed as expected, try increasing the max count.
✂ Box Style (Height)
✂ Box Style (↕): Set the box height style for liquidity levels.
What it is: A float input to set the height of the boxes.
What it does: Adjusts the height of the boxes displaying liquidity levels.
How to use it: Enter a value between -50 and 50.
Additional Info: Default value is -5.
📏 Box Length
b: Set the box length of liquidity levels.
What it is: An integer input to set the length of the boxes.
What it does: Adjusts the length of the boxes displaying liquidity levels.
How to use it: Enter a value between 0 and 500.
Additional Info: Default value is 20.
⏭ Extend Liquidity Levels
Extend ⏭: Toggle to extend liquidity levels beyond the current range.
What it is: A boolean input to enable or disable the extension of liquidity levels.
What it does: Extends liquidity levels beyond their default range.
How to use it: Check or uncheck the box to enable or disable.
Additional Info: Extend liquidity levels beyond the current range.
💬 Text Options
💬 Text Options: Set text size and color for liquidity levels.
What it is: A dropdown to select text size and a color picker to choose text color.
What it does: Changes the size and color of the text displayed for liquidity levels.
How to use it: Select a size from the dropdown and a color from the color picker.
💬 Show Text
Text: Toggle to display text for liquidity levels.
What it is: A boolean input to show or hide the text for liquidity levels.
What it does: Displays the text information for liquidity levels on the chart.
How to use it: Check or uncheck the box to enable or disable.
💬 Show Volume
Volume: Toggle to display the volume of liquidity levels.
What it is: A boolean input to show or hide the volume information for liquidity levels.
What it does: Displays the volume information for liquidity levels on the chart.
How to use it: Check or uncheck the box to enable or disable.
Additional Info:
What it represents: The volume displayed represents the total trading volume that occurred during the formation of the liquidity level. This can indicate the level of participation or interest in that price level.
How it's calculated: The volume is the sum of all traded volumes within the candles that form the liquidity level.
What it means: Higher volume at a liquidity level may suggest stronger support or resistance. It shows the amount of trading activity and can be an indicator of the potential strength or validity of the liquidity level.
Why it's shown: To give traders an idea of the market participation and to help assess the strength of the liquidity level.
💬 Show Percentage
%: Toggle to display the percentage of liquidity levels.
What it is: A boolean input to show or hide the percentage information for liquidity levels.
What it does: Displays the percentage information for liquidity levels on the chart.
How to use it: Check or uncheck the box to enable or disable.
Additional Info:
What it represents: The percentage displayed usually represents the proportion of price movement relative to the liquidity level.
How it's calculated: This can be the percentage move from the start to the end of the liquidity level or the retracement level that price has reached relative to the liquidity level's range.
What it means: It helps traders understand the extent of price movement within the liquidity level and can indicate the significance of the price level.
Why it's shown: To provide a clearer understanding of the price dynamics and the importance of the liquidity level within the overall price movement.
Fair Value Gaps visuals:
📊 Fair Value Gaps Input Settings
📊 Show FVG
TF #1🕑: Enable or disable Fair Value Gaps for Timeframe 1.
What it is: A boolean input to toggle the display of Fair Value Gaps.
What it does: Shows or hides Fair Value Gaps on the chart.
How to use it: Check or uncheck the box to enable or disable.
📊 Select Timeframe
Timeframe: Select the timeframe for Fair Value Gaps.
What it is: A dropdown to select the desired timeframe.
What it does: Sets the timeframe for Fair Value Gaps.
How to use it: Choose a timeframe from the dropdown list.
Additional Info: Higher TF Chart & Lower TF Setting or Lower TF Chart & Higher TF Setting.
📛 FVG Break Method
📛FVG Break (Method): Select the method for determining when an FVG is mitigated.
What it is: A dropdown to choose between Touch, Wicks, Close, or Average.
What it does: Sets the criteria for when a Fair Value Gap is considered mitigated.
How to use it: Choose an option from the dropdown.
Additional Info:
Touch: FVG is mitigated when the price touches the gap.
Wicks: FVG is mitigated when the price wicks through the gap.
Close: FVG is mitigated when the closing price is within the gap.
Average: FVG is mitigated when the average price (average of high and low) is within the gap.
📛 Show Mitigated FVG
show: Toggle to display mitigated FVGs.
What it is: A boolean input to show or hide mitigated Fair Value Gaps.
What it does: Displays or hides mitigated Fair Value Gaps.
How to use it: Check or uncheck the box to enable or disable.
📛 Fill FVG
Fill: Toggle to fill Fair Value Gaps.
What it is: A boolean input to fill the Fair Value Gaps with color.
What it does: Adds a color fill to the Fair Value Gaps.
How to use it: Check or uncheck the box to enable or disable.
📛 Shade FVG
Shade: Toggle to shade Fair Value Gaps.
What it is: A boolean input to shade the Fair Value Gaps.
What it does: Adds a shade effect to the Fair Value Gaps.
How to use it: Check or uncheck the box to enable or disable.
Additional Info: Select the method to break FVGs and toggle the visibility of FVG Breaks (fill FVG and/or shade FVG).
🔍 Max Bullish FVG
🔍Max Bullish FVG: Set the maximum number of Bullish Fair Value Gaps to display.
What it is: An integer input to set the maximum number of Bullish Fair Value Gaps.
What it does: Limits the number of Bullish Fair Value Gaps shown on the chart.
How to use it: Enter a value between 0 and 50.
🔍 Max Bearish FVG
🔍Max Bearish FVG: Set the maximum number of Bearish Fair Value Gaps to display.
What it is: An integer input to set the maximum number of Bearish Fair Value Gaps.
What it does: Limits the number of Bearish Fair Value Gaps shown on the chart.
How to use it: Enter a value between 0 and 50.
🟥 Bearish FVG Color
Bearish FVG Color: Set the color for Bearish Fair Value Gaps.
What it is: A color picker to set the color of Bearish Fair Value Gaps.
What it does: Changes the color of Bearish Fair Value Gaps on the chart.
How to use it: Select a color from the color picker.
Additional Info:
Tooltip: Set the maximum number of Bearish Fair Value Gaps to display. Default: 5, Min: 1, Max: 50.
If Fair Value Gaps are not displayed as expected, try increasing the max count.
🟦 Bullish FVG Color
Bullish FVG Color: Set the color for Bullish Fair Value Gaps.
What it is: A color picker to set the color of Bullish Fair Value Gaps.
What it does: Changes the color of Bullish Fair Value Gaps on the chart.
How to use it: Select a color from the color picker.
Additional Info:
Tooltip: Set the maximum number of Bullish Fair Value Gaps to display. Default: 5, Min: 1, Max: 50.
If Fair Value Gaps are not displayed as expected, try increasing the max count.
📏 FVG Range
↔ FVG Range: Set the range for Fair Value Gaps.
What it is: An integer input to set the range of the Fair Value Gaps.
What it does: Adjusts the range of the Fair Value Gaps displayed.
How to use it: Enter a value between 0 and 100.
Additional Info: Adjustable length only works when both RANGE & EXTEND display OFF. Range=current price, Extend=Full Range.
⏭ Extend FVG
Extend⏭: Toggle to extend Fair Value Gaps beyond the current range.
What it is: A boolean input to enable or disable the extension of Fair Value Gaps.
What it does: Extends Fair Value Gaps beyond their default range.
How to use it: Check or uncheck the box to enable or disable.
⏯ FVG Range
Range⏯: Toggle the range of Fair Value Gaps.
What it is: A boolean input to enable or disable the range display for Fair Value Gaps.
What it does: Sets the range of Fair Value Gaps displayed.
How to use it: Check or uncheck the box to enable or disable.
↕ Max Width
↕ Max Width: Set the maximum width of Fair Value Gaps.
What it is: A float input to set the maximum width of Fair Value Gaps.
What it does: Limits the width of Fair Value Gaps as a percentage of the price range.
How to use it: Enter a value between 0 and 5.0.
Additional Info: FVGs wider than this value will be ignored.
♻ Filter FVG
Filter FVG ♻: Toggle to filter out small Fair Value Gaps.
What it is: A boolean input to filter out small Fair Value Gaps.
What it does: Ignores Fair Value Gaps smaller than the specified max width.
How to use it: Check or uncheck the box to enable or disable.
➖ Mid Line Style
➖Mid Line Style: Select the style of the mid line for Fair Value Gaps.
What it is: A dropdown to choose between Solid, Dashed, or Dotted.
What it does: Sets the style of the mid line within Fair Value Gaps.
How to use it: Choose an option from the dropdown.
🎨 Mid Line Color
Mid Line Color: Set the color for the mid line within Fair Value Gaps.
What it is: A color picker to set the color of the mid line.
What it does: Changes the color of the mid line within Fair Value Gaps.
How to use it: Select a color from the color picker.
Additional Information
Mitigation Methods: Each method (Touch, Wicks, Close, Average) provides different criteria for when a Fair Value Gap is considered mitigated, helping traders to understand the dynamics of price movements within gaps.
Volume and Percentage: Displaying volume and percentage information for Fair Value Gaps helps traders gauge the strength and significance of these gaps in relation to trading activity and price movements.
Trendlines visuals:
📊 Trendlines Input Settings
📊 Show Trendlines
Trendlines & Trendlines Difference(%) ↕: Enable or disable trendlines and set the percentage difference from the first trendline.
What it is: A boolean input to toggle the display of trendlines.
What it does: Shows or hides trendlines on the chart and allows setting a percentage difference from the first trendline.
How to use it: Check or uncheck the box to enable or disable.
Additional Info: The percentage difference determines the distance of the second trendline from the first one.
📏 Trendline Length Option
📏Trendline Length: Select the length for trendlines.
What it is: A dropdown to choose between SHORT, MID, LONG, or CUSTOM.
What it does: Sets the length of trendlines.
How to use it: Choose an option from the dropdown.
Additional Info: Default lengths are SHORT=50, MID=100, LONG=200.
🔧 Custom Trendline Length
🔧custom: Specify a custom length for trendlines.
What it is: An integer input for setting a custom trendline length.
What it does: Overrides the default trendline lengths if set to CUSTOM.
How to use it: Enter a custom integer value (only shown when CUSTOM is selected).
🔍 Max Bearish Trendlines
🔍Max Trendlines Bearish: Set the maximum number of bearish trendlines to display.
What it is: A dropdown to select the maximum number of bearish trendlines.
What it does: Limits the number of bearish trendlines shown on the chart.
How to use it: Choose a value from the dropdown (2-20).
🟩 Bearish Trendline Color
Bearish Trendline Color: Set the color for bearish trendlines.
What it is: A color picker to set the color of bearish trendlines.
What it does: Changes the color of bearish trendlines on the chart.
How to use it: Select a color from the color picker.
Additional Info: Adjust to control how many bearish trendlines are displayed.
🔍 Max Bullish Trendlines
🔍Max Trendlines Bullish: Set the maximum number of bullish trendlines to display.
What it is: A dropdown to select the maximum number of bullish trendlines.
What it does: Limits the number of bullish trendlines shown on the chart.
How to use it: Choose a value from the dropdown (2-20).
🟥 Bullish Trendline Color
Bullish Trendline Color: Set the color for bullish trendlines.
What it is: A color picker to set the color of bullish trendlines.
What it does: Changes the color of bullish trendlines on the chart.
How to use it: Select a color from the color picker.
Additional Info: Adjust to control how many bullish trendlines are displayed.
📐 Degrees Text
📐Degrees ° (💬 Size): Enable or disable degrees text and set its size and color.
What it is: A boolean input to show or hide the degrees text for trendlines.
What it does: Displays the degrees text for trendlines.
How to use it: Check or uncheck the box to enable or disable.
📏 Text Size for Degrees
Text Size: Set the text size for degrees on trendlines.
What it is: A dropdown to select the size of the degrees text.
What it does: Changes the size of the degrees text displayed for trendlines.
How to use it: Choose a size from the dropdown (XS, S, M, L, XL).
🎨 Degrees Text Color
Degrees Text Color: Set the color for the degrees text on trendlines.
What it is: A color picker to set the color of the degrees text.
What it does: Changes the color of the degrees text on the chart.
How to use it: Select a color from the color picker.
♻ Filter Degrees
♻ Filter Degrees °: Enable or disable angle filtering and set the angle range.
What it is: A boolean input to filter trendlines by their angle.
What it does: Shows only trendlines within a specified angle range.
How to use it: Check or uncheck the box to enable or disable.
Additional Info: Angles outside this range will be filtered out.
🔢 Angle Range
Angle Range: Set the angle range for filtering trendlines.
What it is: Two float inputs to set the minimum and maximum angle for trendlines.
What it does: Defines the range of angles for which trendlines will be shown.
How to use it: Enter values for the minimum and maximum angles.
➖ Line Style
➖Style #1 & #2: Select the style of the primary and secondary trendlines.
What it is: Two dropdowns to choose between Solid, Dashed, or Dotted for the trendlines.
What it does: Sets the style of the primary and secondary trendlines.
How to use it: Choose a style from each dropdown.
📏 Line Thickness
: Set the thickness for the trendlines.
What it is: An integer input to set the thickness of the trendlines.
What it does: Adjusts the thickness of the trendlines displayed on the chart.
How to use it: Enter a value between 1 and 5.
Additional Information
Trendline Percentage Difference: Setting a percentage difference helps in analyzing the relative position and angle of trendlines.
Filtering by Angle: This feature allows focusing on trendlines within a specific angle range, enhancing the clarity of trend analysis.
BOS & CHOCH Market Structure visuals:
📊 BOS & CHOCH Market Structure Input Settings
📏 Market Structure Length Option
📏Market Structure: Select the market structure length option.
What it is: A dropdown to choose between INTERNAL, EXTERNAL, ALL, CUSTOM, or NONE.
What it does: Sets the type of market structure to be displayed.
How to use it: Choose an option from the dropdown.
Additional Info:
INTERNAL: Only internal structure.
EXTERNAL: Only external structure.
ALL: Both internal and external structures.
CUSTOM: Custom lengths.
NONE: No structure.
🔧 Custom Internal Length
🔧Custom Internal: Specify a custom length for internal market structure.
What it is: An integer input for setting a custom internal length.
What it does: Defines the length of internal market structures if CUSTOM is selected.
How to use it: Enter a custom integer value (only shown when CUSTOM is selected).
💬 Internal Label Size
💬Internal Label Size: Set the label size for internal market structures.
What it is: A dropdown to select the size of the labels.
What it does: Changes the size of the labels for internal market structures.
How to use it: Choose a size from the dropdown (XS, S, M, L, XL).
🟩 Internal Bullish Color
Internal Bullish Color: Set the color for bullish internal market structures.
What it is: A color picker to set the color of bullish internal market structures.
What it does: Changes the color of bullish internal market structures on the chart.
How to use it: Select a color from the color picker.
🟥 Internal Bearish Color
Internal Bearish Color: Set the color for bearish internal market structures.
What it is: A color picker to set the color of bearish internal market structures.
What it does: Changes the color of bearish internal market structures on the chart.
How to use it: Select a color from the color picker.
🔧 Custom External Length
🔧Custom External: Specify a custom length for external market structure.
What it is: An integer input for setting a custom external length.
What it does: Defines the length of external market structures if CUSTOM is selected.
How to use it: Enter a custom integer value (only shown when CUSTOM is selected).
💬 External Label Size
💬External Label Size: Set the label size for external market structures.
What it is: A dropdown to select the size of the labels.
What it does: Changes the size of the labels for external market structures.
How to use it: Choose a size from the dropdown (XS, S, M, L, XL).
🟩 External Bullish Color
External Bullish Color: Set the color for bullish external market structures.
What it is: A color picker to set the color of bullish external market structures.
What it does: Changes the color of bullish external market structures on the chart.
How to use it: Select a color from the color picker.
🟥 External Bearish Color
External Bearish Color: Set the color for bearish external market structures.
What it is: A color picker to set the color of bearish external market structures.
What it does: Changes the color of bearish external market structures on the chart.
How to use it: Select a color from the color picker.
📐 Show Equal Highs and Lows
EQL & EQH📐: Toggle visibility for equal highs and lows.
What it is: A boolean input to show or hide equal highs and lows.
What it does: Displays or hides equal highs and lows on the chart.
How to use it: Check or uncheck the box to enable or disable.
📏 Equal Highs and Lows Threshold
Equal Highs and Lows Threshold: Set the threshold for equal highs and lows.
What it is: A float input to set the threshold for equal highs and lows.
What it does: Defines the range within which highs and lows are considered equal.
How to use it: Enter a value between 0 and 10.
💬 Label Size for Equal Highs and Lows
💬Label Size for Equal Highs and Lows: Set the label size for equal highs and lows.
What it is: A dropdown to select the size of the labels.
What it does: Changes the size of the labels for equal highs and lows.
How to use it: Choose a size from the dropdown (XS, S, M, L, XL).
🟩 Bullish Color for Equal Highs and Lows
Bullish Color for Equal Highs and Lows: Set the color for bullish equal highs and lows.
What it is: A color picker to set the color of bullish equal highs and lows.
What it does: Changes the color of bullish equal highs and lows on the chart.
How to use it: Select a color from the color picker.
🟥 Bearish Color for Equal Highs and Lows
Bearish Color for Equal Highs and Lows: Set the color for bearish equal highs and lows.
What it is: A color picker to set the color of bearish equal highs and lows.
What it does: Changes the color of bearish equal highs and lows on the chart.
How to use it: Select a color from the color picker.
📏 Show Swing Points
Swing Points📏: Toggle visibility for swing points.
What it is: A boolean input to show or hide swing points.
What it does: Displays or hides swing points on the chart.
How to use it: Check or uncheck the box to enable or disable.
📏 Swing Points Length Option
Swing Points Length Option: Select the length for swing points.
What it is: A dropdown to choose between SHORT, MID, LONG, or CUSTOM.
What it does: Sets the length of swing points.
How to use it: Choose an option from the dropdown.
Additional Info: Default lengths are SHORT=10, MID=28, LONG=50.
💬 Swing Points Label Size
💬Swing Points Label Size: Set the label size for swing points.
What it is: A dropdown to select the size of the labels.
What it does: Changes the size of the labels for swing points.
How to use it: Choose a size from the dropdown (XS, S, M, L, XL).
🎨 Swing Points Color
Swing Points Color: Set the color for swing points.
What it is: A color picker to set the color of swing points.
What it does: Changes the color of swing points on the chart.
How to use it: Select a color from the color picker.
🔧 Custom Swing Points Length
🔧Custom Swings: Specify a custom length for swing points.
What it is: An integer input for setting a custom length for swing points.
What it does: Defines the length of swing points if CUSTOM is selected.
How to use it: Enter a custom integer value (only shown when CUSTOM is selected).
Additional Information
Market Structure Types: Understanding internal and external structures helps in analyzing different market behaviors.
Equal Highs and Lows: This feature identifies areas where price action is balanced, which can be significant for trading strategies.
Swing Points: Highlighting swing points aids in recognizing significant market reversals or continuations.
Benefits
Enhance your trading strategy by visualizing smart money's influence on price movements.
Make informed decisions with real-time data on significant market structures.
Reduce manual analysis with automated detection of key trading signals.
Ideal For
Traders looking for an edge in forex, equities, and cryptocurrency markets by understanding the underlying forces driving market dynamics.
Acknowledgements
Special thanks to these amazing creators for inspiration and their creations:
I want to thank these amazing creators for creating there amazing indicators , that inspired me and also gave me a head start by making this indicator! Without their amazing indicators it wouldn't be possible!
Flux Charts: Volumized Order Blocks
LuxAlgo: Trend Lines
UAlgo: Fair Value Gaps (FVG)
By Leviathan: Market Structure
Sonarlab: Liquidity Levels
Note
Remember to always backtest the indicator first before integrating it into your strategy! For any questions about the indicator, please feel free to ask for assistance.

Greer Gap# Greer Gap Indicator (No mitigation: i.e. removing false signals)
## Summary
The **Greer Gap Indicator** identifies **Fair Value Gaps (FVGs)** and introduces specialized **Greer Bull Gaps (Blue)** and **Greer Bear Gaps (Orange)** to highlight high-probability trading opportunities. Unlike traditional FVG indicators, it avoids hindsight bias by not removing historical gaps based on future price action, ensuring transparency in signal accuracy. Built upon LuxAlgo’s FVG logic, it adds unique filtering: only the first Greer Gap after an opposite gap is plotted if its level (min for Bull, max for Bear) is not higher/lower than the previous Greer Gap of the same type, while all valid gaps are recorded for comparison. Traders can use these gaps as support/resistance or entry signals, customizable via timeframe, look back, and display options.
## Description
This indicator detects and displays **Fair Value Gaps (FVGs)** on the chart, with a focus on specialized **Greer Gaps**:
- **Bullish Gaps (Green)**: Areas where the low of the current candle is above the high of a previous candle (look back period), indicating potential upward momentum.
- **Bearish Gaps (Red)**: Areas where the high of the current candle is below the low of a previous candle, indicating potential downward momentum.
- **Greer Bull Gaps (Blue)**: A bullish gap that is above the latest bearish gap's max. Only the first such gap after a bearish gap is plotted if it meets criteria (not higher than the previous Greer Bull Gap's min), but all valid ones are recorded for comparison.
- **Greer Bear Gaps (Orange)**: A bearish gap that is below the latest bullish gap's min. Only the first such gap after a bullish gap is plotted if it meets criteria (not lower than the previous Greer Bear Gap's max), but all valid ones are recorded.
## How It Works
The script uses a dynamic look back period to detect FVGs. It maintains a record of all detected gaps and applies additional logic for Greer Gaps:
- **Greer Bull Gaps**: Checks if the new bullish gap's min is above the latest bearish gap's max. Plots only if it's the first since the last bearish gap and its min is <= previous Greer Bull min (or first one).
- **Greer Bear Gaps**: Checks if the new bearish gap's max is below the latest bullish gap's min. Plots only if it's the first since the last bullish gap and its max is >= previous Greer Bear max (or first one).
- **Resets**: A new bearish gap resets the Greer Bull Gap flag, and a new bullish gap resets the Greer Bear Gap flag.
## How to Use
- **Timeframe**: Set a higher timeframe (e.g., 'D' for daily) to detect gaps from that timeframe on the current chart.
- **Look back Period**: Adjust to change gap detection sensitivity (default: 34). Use 2 if you want to compare to LuxAlgo
- **Extend**: Controls how far right the gap boxes extend.
- **Show Options**: Toggle visibility of all bullish/bearish gaps or Greer Gaps.
- **Colors**: Customize colors for each gap type.
- **Application**: Use Greer Gaps as potential support/resistance levels or entry signals, but combine with other analysis for confirmation.
## Originality and Credits
This script is inspired by and builds upon the **"Fair Value Gap "** indicator by LuxAlgo (available on TradingView: ()).
**Credits**: Thanks to LuxAlgo for the core FVG detection logic.
**Significant Changes**:
- Added **Greer Bull and Bear Gap** logic for filtered, directional gaps with reset mechanisms.
- Introduced recording of all valid Greer Gaps without plotting all, to compare levels without hindsight bias.
- **No mitigation/removal of gaps**: Unlike LuxAlgo's approach, which mitigates (removes or alters) gaps based on future price action (e.g., when filled), this can create a hindsight bias where incorrect signals disappear over time. If a signal is used for a trade and later removed due to new data, it doesn't reflect real-time performance accurately. The Greer Gap avoids this by using gap comparisons to validate signals without altering historical boxes, ensuring transparency in when signals were right or wrong.

Time-Based Fair Value Gaps (FVG) with Inversions (iFVG)Overview
The Time-Based Fair Value Gaps (FVG) with Inversions (iFVG) (ICT/SMT) indicator is a specialized tool designed for traders using Inner Circle Trader (ICT) methodologies. Inspired by LuxAlgo's Fair Value Gap indicator, this script introduces significant enhancements by integrating ICT principles, focusing on precise time-based FVG detection, inversion tracking, and retest signals tailored for institutional trading strategies. Unlike LuxAlgo’s general FVG approach, this indicator filters FVGs within customizable 10-minute windows aligned with ICT’s macro timeframes and incorporates ICT-specific concepts like mitigation, liquidity grabs, and session-based gap prioritization.
This tool is optimized for 1–5 minute charts, though probably best for 1 minute charts, identifying bullish and bearish FVGs, tracking their mitigation into inverted FVGs (iFVGs) as key support/resistance zones, and generating retest signals with customizable “Close” or “Wick” confirmation. Features like ATR-based filtering, optional FVG labels, mitigation removal, and session-specific FVG detection (e.g., first FVG in AM/PM sessions) make it a powerful tool for ICT traders.
Originality and Improvements
While inspired by LuxAlgo’s FVG indicator (credit to LuxAlgo for their foundational work), this script significantly extends the original concept by:
1. Time-Based FVG Detection: Unlike LuxAlgo’s continuous FVG identification, this script filters FVGs within user-defined 10-minute windows each hour (:00–:10, :10–:20, etc.), aligning with ICT’s emphasis on specific periods of institutional activity, such as hourly opens/closes or kill zones (e.g., New York 7:00–11:00 AM EST). This ensures FVGs are relevant to high-probability ICT setups.
2. Session-Specific First FVG Option: A unique feature allows traders to display only the first FVG in ICT-defined AM (9:30–10:00 AM EST) or PM (1:30–2:00 PM EST) sessions, reflecting ICT’s focus on initial market imbalances during key liquidity events.
3. ICT-Driven Mitigation and Inversion Logic: The script tracks FVG mitigation (when price closes through a gap) and converts mitigated FVGs into iFVGs, which serve as ICT-style support/resistance zones. This aligns with ICT’s view that mitigated gaps become critical reversal points, unlike LuxAlgo’s simpler gap display.
4. Customizable Retest Signals: Retest signals for iFVGs are configurable for “Close” (conservative, requiring candle body confirmation) or “Wick” (faster, using highs/lows), catering to ICT traders’ need for precise entry timing during liquidity grabs or Judas swings.
5. ATR Filtering and Mitigation Removal: An optional ATR filter ensures only significant FVGs are displayed, reducing noise, while mitigation removal declutters the chart by removing filled gaps, aligning with ICT’s principle that mitigated gaps lose relevance unless inverted.
6. Timezone and Timeframe Safeguards: A timezone offset setting aligns FVG detection with EST for ICT’s New York-centric strategies, and a timeframe warning alerts users to avoid ≥1-hour charts, ensuring accuracy in time-based filtering.
These enhancements make the script a distinct tool that builds on LuxAlgo’s foundation while offering ICT traders a tailored, high-precision solution.
How It Works
FVG Detection
FVGs are identified when a candle’s low is higher than the high of two candles prior (bullish FVG) or a candle’s high is lower than the low of two candles prior (bearish FVG). Detection is restricted to:
• User-selected 10-minute windows (e.g., :00–:10, :50–:60) to capture ICT-relevant periods like hourly transitions.
• AM/PM session first FVGs (if enabled), focusing on 9:30–10:00 AM or 1:30–2:00 PM EST for key market opens.
An optional ATR filter (default: 0.25× ATR) ensures only gaps larger than the threshold are displayed, prioritizing significant imbalances.
Mitigation and Inversion
When price closes through an FVG (e.g., below a bullish FVG’s bottom), the FVG is mitigated and becomes an iFVG, plotted as a support/resistance zone. iFVGs are critical in ICT for identifying reversal points where institutional orders accumulate.
Retest Signals
The script generates signals when price retests an iFVG:
• Close: Triggers when the candle body confirms the retest (conservative, lower noise).
• Wick: Triggers when the candle’s high/low touches the iFVG (faster, higher sensitivity). Signals are visualized with triangular markers (▲ for bullish, ▼ for bearish) and can trigger alerts.
Visualization
• FVGs: Displayed as colored boxes (green for bullish, red for bearish) with optional “Bull FVG”/“Bear FVG” labels.
• iFVGs: Shown as extended boxes with dashed midlines, limited to the user-defined number of recent zones (default: 5).
• Mitigation Removal: Mitigated FVGs/iFVGs are removed (if enabled) to keep the chart clean.
How to Use
Recommended Settings
• Timeframe: Use 1–5 minute charts for precision, avoiding ≥1-hour timeframes (a warning label appears if misconfigured).
• Time Windows: Enable :00–:10 and :50–:60 for hourly open/close FVGs, or use the “Show only 1st presented FVG” option for AM/PM session focus.
• ATR Filter: Keep enabled (multiplier 0.25–0.5) for significant gaps; disable on 1-minute charts for more FVGs during volatility.
• Signal Preference: Use “Close” for conservative entries, “Wick” for aggressive setups.
• Timezone Offset: Set to -5 for EST (or -4 for EDT) to align with ICT’s New York session.
Trading Strategy
1. Macro Timeframes: Focus on New York (7:00–11:00 AM EST) or London (2:00–5:00 AM EST) kill zones for high institutional activity.
2. FVG Entries: Trade bullish FVGs as support in uptrends or bearish FVGs as resistance in downtrends, especially in :00–:10 or :50–:60 windows.
3. iFVG Retests: Enter on retest signals (▲/▼) during liquidity grabs or Judas swings, using “Close” for confirmation or “Wick” for speed.
4. Session FVGs: Use the “Show only 1st presented FVG” option to target the first gap in AM/PM sessions, often tied to ICT’s market maker algorithms.
5. Risk Management: Combine with ICT concepts like order blocks or breaker blocks for confluence, and set stops beyond FVG/iFVG boundaries.
Alerts
Set alerts for:
• “Bullish FVG Detected”/“Bearish FVG Detected”: New FVGs in selected windows.
• “Bullish Signal”/“Bearish Signal”: iFVG retest confirmations.
Settings Description
• Show Last (1–100, default: 5): Number of recent iFVGs to display. Lower values reduce clutter.
• Show only 1st presented FVG : Limits FVGs to the first in 9:30–10:00 AM or 1:30–2:00 PM EST sessions (overrides time window checkboxes).
• Time Window Checkboxes: Enable/disable FVG detection in 10-minute windows (:00–:10, :10–:20, etc.). All enabled by default.
• Signal Preference: “Close” (default) or “Wick” for iFVG retest signals.
• Use ATR Filter: Enables ATR-based size filtering (default: true).
• ATR Multiplier (0–∞, default: 0.25): Sets FVG size threshold (higher values = larger gaps).
• Remove Mitigated FVGs: Removes filled FVGs/iFVGs (default: true).
• Show FVG Labels: Displays “Bull FVG”/“Bear FVG” labels (default: true).
• Timezone Offset (-12 to 12, default: -5): Aligns time windows with EST.
• Colors: Customize bullish (green), bearish (red), and midline (gray) colors.
Why Use This Indicator?
This indicator empowers ICT traders with a tool that goes beyond generic FVG detection, offering precise, time-filtered gaps and inversion tracking aligned with institutional trading principles. By focusing on ICT’s macro timeframes, session-specific imbalances, and customizable signal logic, it provides a clear edge for scalping, swing trading, or reversal setups in high-liquidity markets.

[FS] Pivot Measurements# Pivot Measurements
An advanced TradingView indicator that combines LuxAlgo's pivot point detection algorithm with automatic measurement calculations between consecutive pivots.
## Features
### Pivot Detection
- **Regular Pivots**: Detects standard pivot highs and lows using configurable pivot length
- **Missed Pivots**: Identifies missed reversal levels that occurred between regular pivots
- **Visual Indicators**:
- Regular pivot highs: Red downward triangle (▼)
- Regular pivot lows: Teal upward triangle (▲)
- Missed pivots: Ghost emoji (👻)
- **Zigzag Lines**: Connects pivots with colored lines (solid for regular, dashed for missed)
- **Ghost Levels**: Horizontal lines indicating missed pivot levels
### Measurement System
- **Automatic Measurements**: Calculates price movements between consecutive pivots
- **Visual Display**:
- Transparent colored boxes (blue for upward, red for downward movements)
- Measurement labels showing:
- Price change (absolute and percentage)
- Duration (bars, days, hours, minutes)
- Volume approximation
- **Smart Positioning**: Labels positioned outside boxes (above for upward, below for downward)
- **Color Coding**: Blue for positive movements, red for negative movements
## Parameters
### Pivot Detection
- **Pivot Length** (default: 50): Number of bars on each side to identify a pivot point
- **Regular Pivots**: Toggle and colors for regular pivot highs and lows
- **Missed Pivots**: Toggle and colors for missed pivot detection
### Measurements
- **Number of Measurements** (1-10, default: 10): Maximum number of measurements to display
- **Show Measurement Boxes**: Toggle to show/hide measurement boxes and labels
- **Box Transparency** (0-100, default: 90): Transparency level for measurement boxes
- **Border Transparency** (0-100, default: 50): Transparency level for box borders
- **Label Background Transparency** (0-100, default: 30): Transparency level for label backgrounds
- **Label Size**: Size of measurement labels (tiny, small, normal, large)
## Usage
1. Add the indicator to your chart
2. Configure the **Pivot Length** based on your timeframe:
- Lower values for shorter timeframes (e.g., 10-20 for 1-5 min)
- Higher values for longer timeframes (e.g., 50-100 for daily)
3. Adjust pivot colors and visibility as needed
4. Customize measurement display settings:
- Set the number of measurements to display
- Adjust transparency levels for boxes, borders, and labels
- Choose label size
## Technical Details
- **Pine Script Version**: v6
- **Pivot Detection**: Based on () algorithm for detecting regular and missed pivots
- **Measurement Calculation**:
- Measures between consecutive pivots (from most recent to older)
- Calculates price change, percentage change, duration, and approximate volume
- Automatically sorts pivots chronologically
- **Performance**: Optimized with helper functions to reduce code duplication
## Notes
- The indicator automatically limits the number of stored pivots to optimize performance
- Measurements are only created when there are at least 2 pivots detected
- All measurements are recalculated on each bar update
- The indicator uses `max_bars_back=5000` to ensure sufficient historical data
## License
This indicator uses LuxAlgo's pivot detection algorithm from (). Please refer to the original LuxAlgo license for pivot detection components.

Trendline Breaks with Multi Fibonacci Supertrend StrategyTMFS Strategy: Advanced Trendline Breakouts with Multi-Fibonacci Supertrend
Elevate your algorithmic trading with institutional-grade signal confluence
Strategy Genesis & Evolution
This advanced trading system represents the culmination of a personal research journey, evolving from my custom " Multi Fibonacci Supertrend with Signals " indicator into a comprehensive trading strategy. Built upon the exceptional trendline detection methodology pioneered by LuxAlgo in their " Trendlines with Breaks " indicator, I've engineered a systematic framework that integrates multiple technical factors into a cohesive trading system.
Core Fibonacci Principles
At the heart of this strategy lies the Fibonacci sequence application to volatility measurement:
// Fibonacci-based factors for multiple Supertrend calculations
factor1 = input.float(0.618, 'Factor 1 (Weak/Fibonacci)', minval = 0.01, step = 0.01)
factor2 = input.float(1.618, 'Factor 2 (Medium/Golden Ratio)', minval = 0.01, step = 0.01)
factor3 = input.float(2.618, 'Factor 3 (Strong/Extended Fib)', minval = 0.01, step = 0.01)
These precise Fibonacci ratios create a dynamic volatility envelope that adapts to changing market conditions while maintaining mathematical harmony with natural price movements.
Dynamic Trendline Detection
The strategy incorporates LuxAlgo's pioneering approach to trendline detection:
// Pivotal swing detection (inspired by LuxAlgo)
pivot_high = ta.pivothigh(swing_length, swing_length)
pivot_low = ta.pivotlow(swing_length, swing_length)
// Dynamic slope calculation using ATR
slope = atr_value / swing_length * atr_multiplier
// Update trendlines based on pivot detection
if bool(pivot_high)
upper_slope := slope
upper_trendline := pivot_high
else
upper_trendline := nz(upper_trendline) - nz(upper_slope)
This adaptive trendline approach automatically identifies key structural market boundaries, adjusting in real-time to evolving chart patterns.
Breakout State Management
The strategy implements sophisticated state tracking for breakout detection:
// Track breakouts with state variables
var int upper_breakout_state = 0
var int lower_breakout_state = 0
// Update breakout state when price crosses trendlines
upper_breakout_state := bool(pivot_high) ? 0 : close > upper_trendline ? 1 : upper_breakout_state
lower_breakout_state := bool(pivot_low) ? 0 : close < lower_trendline ? 1 : lower_breakout_state
// Detect new breakouts (state transitions)
bool new_upper_breakout = upper_breakout_state > upper_breakout_state
bool new_lower_breakout = lower_breakout_state > lower_breakout_state
This state-based approach enables precise identification of the exact moment when price breaks through a significant trendline.
Multi-Factor Signal Confluence
Entry signals require confirmation from multiple technical factors:
// Define entry conditions with multi-factor confluence
long_entry_condition = enable_long_positions and
upper_breakout_state > upper_breakout_state and // New trendline breakout
di_plus > di_minus and // Bullish DMI confirmation
close > smoothed_trend // Price above Supertrend envelope
// Execute trades only with full confirmation
if long_entry_condition
strategy.entry('L', strategy.long, comment = "LONG")
This strict requirement for confluence significantly reduces false signals and improves the quality of trade entries.
Advanced Risk Management
The strategy includes sophisticated risk controls with multiple methodologies:
// Calculate stop loss based on selected method
get_long_stop_loss_price(base_price) =>
switch stop_loss_method
'PERC' => base_price * (1 - long_stop_loss_percent)
'ATR' => base_price - long_stop_loss_atr_multiplier * entry_atr
'RR' => base_price - (get_long_take_profit_price() - base_price) / long_risk_reward_ratio
=> na
// Implement trailing functionality
strategy.exit(
id = 'Long Take Profit / Stop Loss',
from_entry = 'L',
qty_percent = take_profit_quantity_percent,
limit = trailing_take_profit_enabled ? na : long_take_profit_price,
stop = long_stop_loss_price,
trail_price = trailing_take_profit_enabled ? long_take_profit_price : na,
trail_offset = trailing_take_profit_enabled ? long_trailing_tp_step_ticks : na,
comment = "TP/SL Triggered"
)
This flexible approach adapts to varying market conditions while providing comprehensive downside protection.
Performance Characteristics
Rigorous backtesting demonstrates exceptional capital appreciation potential with impressive risk-adjusted metrics:
Remarkable total return profile (1,517%+)
Strong Sortino ratio (3.691) indicating superior downside risk control
Profit factor of 1.924 across all trades (2.153 for long positions)
Win rate exceeding 35% with balanced distribution across varied market conditions
Institutional Considerations
The strategy architecture addresses execution complexities faced by institutional participants with temporal filtering and date-range capabilities:
// Time Filter settings with flexible timezone support
import jason5480/time_filters/5 as time_filter
src_timezone = input.string(defval = 'Exchange', title = 'Source Timezone')
dst_timezone = input.string(defval = 'Exchange', title = 'Destination Timezone')
// Date range filtering for precise execution windows
use_from_date = input.bool(defval = true, title = 'Enable Start Date')
from_date = input.time(defval = timestamp('01 Jan 2022 00:00'), title = 'Start Date')
// Validate trading permission based on temporal constraints
date_filter_approved = time_filter.is_in_date_range(
use_from_date, from_date, use_to_date, to_date, src_timezone, dst_timezone
)
These capabilities enable precise execution timing and market session optimization critical for larger market participants.
Acknowledgments
Special thanks to LuxAlgo for the pioneering work on trendline detection and breakout identification that inspired elements of this strategy. Their innovative approach to technical analysis provided a valuable foundation upon which I could build my Fibonacci-based methodology.
This strategy is shared under the same Attribution-NonCommercial-ShareAlike 4.0 International (CC BY-NC-SA 4.0) license as LuxAlgo's original work.
Past performance is not indicative of future results. Conduct thorough analysis before implementing any algorithmic strategy.

FT SessionsFT Sessions
Overview
The FT Sessions is a highly customizable and powerful indicator designed for intraday traders who focus on session-based analysis. This script visually highlights global market sessions—Asia, Frankfurt, London, and New York (AM & PM)—on the chart, making it easier to track session ranges and analyze intraday price movements.
Key Features
Customizable Session Times and Colors:
Define your own session times and assign unique colors for better visibility.
Session Range Visualization:
Displays high and low ranges for each session.
Optional transparent range areas with outlines for clarity.
Configurable session range labels for enhanced readability.
Flexible Timezone Settings:
Choose a UTC offset or sync with the exchange's timezone.
User-Friendly Customization:
Compact settings for easier adjustments.
Enable or disable specific sessions to focus on relevant market activity.
How This Script Differs from LuxAlgo
This script draws inspiration from LuxAlgo's session tracking concept but has been developed with significant modifications and unique features:
Built from Scratch in Pine Script v5:
Fully optimized for Pine Script’s latest version, improving performance and functionality.
Expanded Session Range Features:
Five unique sessions (Asia, Frankfurt, London, New York AM, New York PM) with customizable ranges, colors, and labels.
Real-time updating of session ranges for improved intraday analysis.
4H Timeframe Optimization:
Automatically notifies users if applied to an unsupported timeframe, ensuring session accuracy.
Highly Configurable Input Options:
Advanced timezone handling and compact session management settings.
Unique Coding Structure:
Designed to maximize efficiency and minimize resource usage on TradingView.
While LuxAlgo focuses on session concepts, this script brings a fresh, customizable approach specifically tailored for intraday traders seeking precision in tracking session activity.
How It Works
The indicator tracks price movements within each session.
Highlights the high and low range of each session directly on the chart.
Updates session ranges in real-time to reflect evolving market conditions.
Practical Applications
Intraday Trading: Plan trades based on major market session ranges.
Breakout Strategies: Use session high and low levels to identify potential breakouts.
Session-Specific Patterns: Spot consolidations and reversals within session activity.
Important Notes
Optimized for the 4H timeframe. If applied to another timeframe, a notification will appear.
Best used in combination with other tools (e.g., volume or trend indicators) for a complete trading strategy.
Credits
This script draws inspiration from LuxAlgo's open-source session-tracking methodology. However, it introduces substantial improvements and unique features that set it apart. Full credit is given to LuxAlgo for their original open-source concept.
Disclaimer
This script is for informational and educational purposes only. Always test on a demo account before applying to live markets.

Supertrend Channel Histogram OscillatorThis histogram is based on the script "Supertrend Channels "
The idea of the indicator is to visually represent the interaction of price with several different supertrend channels of various lengths in an oscillator in order to make it much more clear to the trader how the longer trends are interacting with shorter trends of the price movement of an asset. I got this idea from the "Kurutoga Cloud" and "Kurutoga Histogram" by D7R which is based on the centerlines of 3 Donchian Channels, however after I started using the Supertrend Channel by LuxAlgo I found that it was a more reliable price range channel than a standard Donchian Channel and I made this indicator to accompany it.
This indicator plots a positive value above 0 when the price is above the centerline of the supertrend channel and a negative value below 0 when the price is below the centerline.
The first supertrend's length and multiple can be adjusted in the settings.
The given supertrend input is then doubled and quadrupled in both length and multiplication so that a supertrend histogram with the values of 3, 3 will be accompanied by 2 additional supertrend histograms with the values of 6, 6 and 12, 12.
The larger price trend histograms are clearly visible behind the short term supertrend channel's histogram, giving traders a balanced view of short and long term trends interacting. The less visible columns of the larger trend remain above or below the 0 line behind the more visible short term channel trend, helping to spot pullbacks within a larger trend.
Additionally, when the 3 separate histograms are all positive or all negative but the histogram columns are separating from each other this can indicate a potential trend exhaustion leading to reversal or pullback about to happen.
The overbought and oversold lines at 50 and -50 are representative primarily of the short term trend with above 50 or below -50 indicating that the price is pushing the boundary and potentially beginning a new short term supertrend in the opposite direction. If values do not noticably exceed these levels, then the current short term trend movement can be viewed as a pullback within a larger trend, with continuation potentially to follow.
I have had troubles converting the original code to v6 so this will be published here in v5 of pinescript to be used in conjunction with the original. I was intending to create a companion indicator for this oscillator that represents 3 supertrends with corresponding 2x and 4x calculations based on LuxAlgo's script, but I can't seem to get it to work correctly in v5.
For best visualization of the trends 3 LuxAlgo Supertrend channels with 2x and 4x values should be used in conjunction with each other to fully visualize the histogram.
Used in conjunction with other indicators this can be a very effective strategy to capture larger trend moves and pullbacks within trends, as well as warn of potential price trend exhaustion.
Smart Trend EnvelopeThe "Smart Trend Envelope" indicator is a powerful tool that combines the "Nadaraya-Watson Envelope " indicator by LuxAlgo and the "Strongest Trendline" indicator by Julien_Eche.
This indicator provides valuable insights into price trends and projection confidence levels in financial markets. However, it's important to note that the indicator may repaint, meaning that the displayed results can change after the fact.
The "Strongest Trendline" indicator by Julien_Eche focuses on identifying the strongest trendlines using logarithmic transformations of price data. It calculates the slope, average, and intercept of each trendline over user-defined lengths. The indicator also provides standard deviation, Pearson's R correlation coefficient, and upper/lower deviation values to assess the strength and reliability of the trendlines.
In addition, the "Nadaraya-Watson Envelope " indicator developed by LuxAlgo utilizes the Nadaraya-Watson kernel regression technique. It applies a kernel function to smooth the price data and estimate future price movements. The indicator allows adjustment of the bandwidth parameter and multiplier to control the width of the envelope lines around the smoothed line.
Combining these two indicators, the "Smart Trend Envelope" indicator offers traders and investors a comprehensive analysis of price trends and projection confidence levels. It automatically selects the strongest trendline length based on the highest Pearson's R correlation coefficient. Traders can observe the trendlines on the price chart, along with upper and lower envelope lines generated by the Nadaraya-Watson smoothing technique.
The "Smart Trend Envelope" indicator has several qualities that make it a valuable tool for technical analysis:
1. Automatic Length Selection: The indicator dynamically selects the optimal trendline length based on the highest Pearson's R correlation coefficient, ensuring accurate trend analysis.
2. Projection Confidence Level: The indicator provides a projection confidence level ranging from "Ultra Weak" to "Ultra Strong." This allows traders to assess the reliability of the projected trend and make informed trading decisions.
3. Color-Coded Visualization: The indicator uses color schemes, such as teal and red, to highlight the direction of the trend and the corresponding envelope lines. This visual representation makes it easier to interpret the market trends at a glance.
4. Customizable Settings: Traders can adjust parameters such as bandwidth, multiplier, line color, and line width to tailor the indicator to their specific trading strategies and preferences.
The "Smart Trend Envelope" indicator has been specifically designed and coded to be used in logarithmic scale. It takes advantage of the logarithmic scale's ability to represent exponential price movements accurately. Therefore, it is highly recommended to use this indicator with the chart set to logarithmic scale for optimal performance and reliable trend analysis, especially on higher timeframes.
It's important to remember that the "Smart Trend Envelope" indicator may repaint, meaning that the displayed results can change after the fact. Traders should use this indicator as a tool for generating trade ideas and confirmation, rather than relying solely on its historical values. Combining the indicator with other technical analysis tools and considering fundamental factors can lead to more robust trading strategies.
