Buyside & Sellside Liquidity [LuxAlgo]The Buyside & Sellside Liquidity indicator aims to detect & highlight the first and arguably most important concept within the ICT trading methodology, Liquidity levels.
🔶 SETTINGS
🔹 Liquidity Levels
Detection Length: Lookback period
Margin: Sets margin/sensitivity for a liquidity level detection
🔹 Liquidity Zones
Buyside Liquidity Zones: Enables display of the buyside liquidity zones.
Margin: Sets margin/sensitivity for the liquidity zone boundaries.
Color: Color option for buyside liquidity levels & zones.
Sellside Liquidity Zones: Enables display of the sellside liquidity zones.
Margin: Sets margin/sensitivity for the liquidity zone boundaries.
Color: Color option for sellside liquidity levels & zones.
🔹 Liquidity Voids
Liquidity Voids: Enables display of both bullish and bearish liquidity voids.
Label: Enables display of a label indicating liquidity voids.
🔹 Display Options
Mode: Controls the lookback length of detection and visualization, where Present assumes last 500 bars and Historical assumes all data available to the user
# Visible Levels: Controls the amount of the liquidity levels/zones to be visualized.
🔶 USAGE
Definitions of Liquidity refer to the availability of orders at specific price levels in the market, allowing transactions to occur smoothly.
In the context of Inner Circle Trader's teachings, liquidity mainly relates to stop losses or pending orders and liquidity level/pool, highlighting a concentration of buy or sell orders at specific price levels. Smart money traders, such as banks and other large institutions, often target these liquidity levels/pools to accumulate or distribute their positions.
There are two types of liquidity; Buyside liquidity and Sellside liquidity .
Buyside liquidity represents a level on the chart where short sellers will have their stops positioned, and Sellside liquidity represents a level on the chart where long-biased traders will place their stops.
These areas often act as support or resistance levels and can provide trading opportunities.
When the liquidity levels are breached at which many stop/limit orders are placed have been traded through, the script will create a zone aiming to provide additional insight to figure out the odds of the next price action.
Reversal: It’s common that the price may reverse course and head in the opposite direction, seeking liquidity at the opposite extreme.
Continuation: When the zone is also broken it is a sign for continuation price action.
It's worth noting that ICT concepts are specific to the methodology developed by Michael J. Huddleston and may not align with other trading approaches or strategies.
🔶 DETAILS
Liquidity voids are sudden changes in price when the price jumps from one level to another. Liquidity voids will appear as a single or a group of candles that are all positioned in the same direction. These candles typically have large real bodies and very short wicks, suggesting very little disagreement between buyers and sellers. The peculiar thing about liquidity voids is that they almost always fill up.
🔶 ALERTS
When an alert is configured, the user will have the ability to be notified in case;
Liquidity level is detected/updated.
Liquidity level is breached.
🔶 RELATED SCRIPTS
ICT-Concepts
ICT-Macros
Imbalance-Detector
Cari dalam skrip untuk "luxalgo"

ICT Macros [LuxAlgo]The ICT Macros indicator aims to highlight & classify ICT Macros, which are time intervals where algorithmic trading takes place to interact with existing liquidity or to create new liquidity.
🔶 SETTINGS
🔹 Macros
Macro Time options (such as '09:50 AM 10:10'): Enable specific macro display.
Top Line , Mid Line , Bottom Line and Extending Lines options: Controls the lines for the specific macro.
🔹 Macro Classification
Length : A length to detect Market Structure Brakes and classify macro type based on detection.
Swing Area : Swing or Liquidity Area selection, highest/lowest of the wick or the candle bodies.
Accumulation , Manipulation and Expansion color options for the classified macros.
🔹 Others
Macro Texts : Controls both the size and the visibility of the macro text.
Alert Macro Times in Advance (Minutes) : This option will plot a vertical line presenting the start of the next macro time. The line will not appear all the time, but it will be there based on remaining minutes specified in the option.
Daylight Saving Time (DST) : Adjust time appropriate to Daylight Saving Time of the specific region.
🔶 USAGE
A macro is a way to automate a task or procedure which you perform on a regular basis.
In the context of ICT's teachings, a macro is a small program or set of instructions that unfolds within an algorithm, which influences price movements in the market. These macros operate at specific times and can be related to price runs from one level to another or certain market behaviors during specific time intervals. They help traders anticipate market movements and potential setups during specific time intervals.
To trade these effectively, it is important to understand the time of day when certain macros come into play, and it is strongly advised to introduce the concept of liquidity in your analysis.
Macros can be classified into three categories where the Macro classification is calculated based on the Market Structure prior to macro and the Market Structure during the macro duration:
Manipulation Macro
Manipulation macros are characterized by liquidity being swept both on the buyside and sellside.
Expansion Macro
Expansion macros are characterized by liquidity being swept only on the buyside or sellside. Prices within these macros are highly correlated with the overall trend.
Accumulation Macro
Accumulation macros are characterized by an accumulation of liquidity. Prices within these macros tend to range.
The script returns the maximum/minimum price values reached during the macro interval alongside the average between the maximum/minimum and extends them until a new macro starts. These levels can act as supports and resistances.
🔶 DETAILS
All required data for the macro detection and classification is retrieved using 1 minute data sets, this includes candles as well as pivot/swing highs and lows. This approach guarantees the visually presented objects are same (same highs/lows) on higher timeframes as well as the macro classification remain same as it is in 1 min charts.
8 Macros can be displayed by the script (4 are enabled by default):
02:33 AM 03:00 London Macro
04:03 AM 04:30 London Macro
08:50 AM 09:10 New York Macro
09:50 AM 10:10 New York Macro
10:50 AM 11:10 New York Macro
11:50 AM 12:10 New York Launch Macro
13:10 PM 13:40 New York Macro
15:15 PM 15:45 New York Macro
🔶 ALERTS
When an alert is configured, the user will have the ability to be notified in advance of the next Macro time, where the value specified in 'Alert Macro Times in Advance (Minutes)' option indicates how early to be notified.
🔶 LIMITATIONS
The script is supported on 1 min, 3 mins and 5 mins charts.
🔶 RELATED SCRIPTS

Breaker Blocks with Signals [LuxAlgo]The Breaker Blocks with Signals indicator aims to highlight a complete methodology based on breaker blocks. Breakout signals between the price and breaker blocks are highlighted and premium/discount swing levels are included to provide potential take profit/stop loss levels.
This script also includes alerts for each signal highlighted.
🔶 SETTINGS
🔹 Breaker Blocks
Length: Sensitivity of the detected swings used to construct breaker blocks. Higher values will return longer term breaker blocks.
Use only candle body: Only use the candle body when determining the maximum/minimum extremities of the order blocks.
Use 2 candles instead of 1: Use two candles to confirm the occurrence of a breaker block.
Stop at first break of center line: Do not highlight breakout signals after invalidation until reset.
🔹 PD Array
Only when E is in premium/discount zone: Only set breaker block if point E of wave ABCDE is within the corresponding zone.
Show premium discount zone: Show premium/discount zone.
Highlight Swing Break: Highlight occurrences of price breaking a previous swing level.
Show Swings/PD Arrays: Show swing levels/labels and pd areas.
🔶 USAGE
The Breaker Blocks with Signals indicator aims to provide users with a minimalistic display alongside optimal signals to be aware of for finding trade setups as shown below.
Here we can see a MSS occurred allowing the indicator to detect a Breaker Block (-BB) & display a red arrow to confirm this signal.
The signal(s) that can be used for potential entries are only during retests of the breaker blocks.
A potential strategy traders could use with this indicator is to target the corresponding Discount PD Arrays detected (for a short position) and Premium PD Arrays (for a long position).
In the image above we can see price generated the potential entry signals in orange & fell to the Discount PD Arrays as a logical setup to look for with this indicator.
As we can see in the image above, signals can be considered invalid when price closes above the 50% level in which it would be suggested to wait for another setup.
Users still looking for more potential setups based on the same breaker block can disable the "Stop at first break of center line" setting within the settings menu.
In the image above we can see a bullish example whereas price confirmed a bullish breaker block (+BB), had a quick pullback into it that was confirmed by the green arrow, and then reached the Premium PD Arrays.
While retests of breaker blocks can still function well if they occur later in the price action, it's most preferable for users to look for entry signals that are near confirmed breaker blocks (5-10 bars) opposed to waiting 20+ bars.
Additional take profits based on the occurence of the breaker blocks are given in order to provide targets after the occurence of a breaker block breakout.
🔶 DETAILS
Breaker blocks are formed after a mitigated order block, these can provide change of polarity opportunities, thus playing a role as a potential support/resistance. It is the re-test/retrace of price to a breaker block that will set the conditions to provide signals.
The above chart describes the creation of a breaker block.
The signal generation logic makes use of various rules described below:
Bullish Breaker Blocks:
opening price is within the breaker block, while the closing price is above the upper extremity of the breaker block.
Price did not cross the breaker block average in the interval since the previous breakout.
Bearish Breaker Blocks:
opening price is within the breaker block, while the closing price is below the lower extremity of the breaker block.
Price did not cross the breaker block average in the interval since the previous breakout.
When a new pattern is formed, all previous drawings are removed.
🔶 RELATED SCRIPTS

Machine Learning Moving Average [LuxAlgo]The Machine Learning Moving Average (MLMA) is a responsive moving average making use of the weighting function obtained Gaussian Process Regression method. Characteristic such as responsiveness and smoothness can be adjusted by the user from the settings.
The moving average also includes bands, used to highlight possible reversals.
🔶 USAGE
The Machine Learning Moving Average smooths out noisy variations from the price, directly estimating the underlying trend in the price.
A higher "Window" setting will return a longer-term moving average while increasing the "Forecast" setting will affect the responsiveness and smoothness of the moving average, with higher positive values returning a more responsive moving average and negative values returning a smoother but less responsive moving average.
Do note that an excessively high "Forecast" setting will result in overshoots, with the moving average having a poor fit with the price.
The moving average color is determined according to the estimated trend direction based on the bands described below, shifting to blue (default) in an uptrend and fushia (default) in downtrends.
The upper and lower extremities represent the range within which price movements likely fluctuate.
Signals are generated when the price crosses above or below the band extremities, with turning points being highlighted by colored circles on the chart.
🔶 SETTINGS
Window: Calculation period of the moving average. Higher values yield a smoother average, emphasizing long-term trends and filtering out short-term fluctuations.
Forecast: Sets the projection horizon for Gaussian Process Regression. Higher values create a more responsive moving average but will result in more overshoots, potentially worsening the fit with the price. Negative values will result in a smoother moving average.
Sigma: Controls the standard deviation of the Gaussian kernel, influencing weight distribution. Higher Sigma values return a longer-term moving average.
Multiplicative Factor: Adjusts the upper and lower extremity bounds, with higher values widening the bands and lowering the amount of returned turning points.
🔶 RELATED SCRIPTS
Machine-Learning-Gaussian-Process-Regression
SuperTrend-AI-Clustering

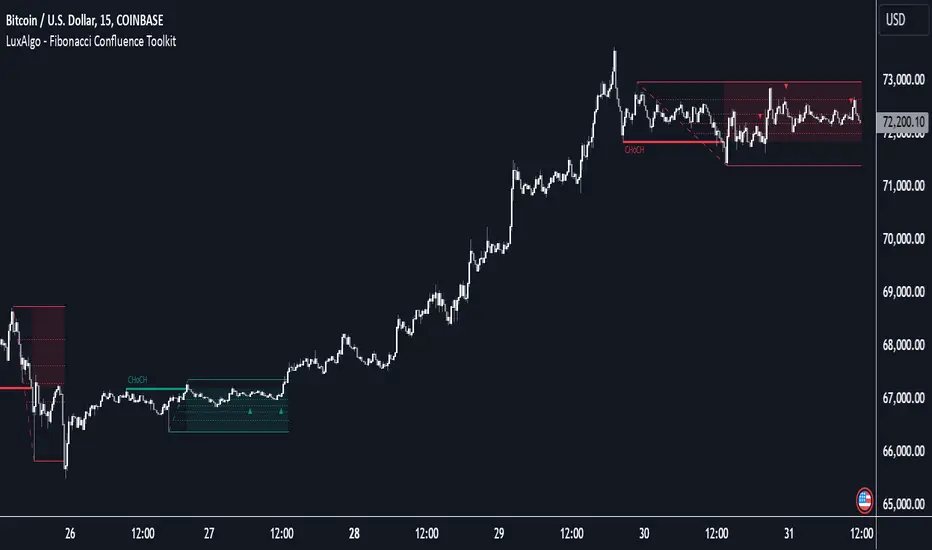
Fibonacci Confluence Toolkit [LuxAlgo]The Fibonacci Confluence Toolkit is a technical analysis tool designed to help traders identify potential price reversal zones by combining key market signals and patterns. It highlights areas of interest where significant price action or reactions are anticipated, automatically applies Fibonacci retracement levels to outline potential pullback zones, and detects engulfing candle patterns.
Its unique strength lies in its reliance solely on price patterns, eliminating the need for user-defined inputs, ensuring a robust and objective analysis of market dynamics.
🔶 USAGE
The script begins by detecting CHoCH (Change of Character) points—key indicators of shifts in market direction. This script integrates the principles of pure price action as applied in Pure-Price-Action-Structures , where further details on the detection process can be found.
The detected CHoCH points serve as the foundation for defining an Area of Interest (AOI), a zone where significant price action or reactions are anticipated.
As new swing highs or lows emerge within the AOI, the tool automatically applies Fibonacci retracement levels to outline potential retracement zones. This setup enables traders to identify areas where price pullbacks may occur, offering actionable insights into potential entries or reversals.
Additionally, the toolkit highlights engulfing candle patterns within these zones, further refining entry points and enhancing confluence for better-informed trading decisions based on real-time trend dynamics and price behavior.
🔶 SETTINGS
🔹 Market Patterns
Bullish Structures: Enable or disable all bullish components of the indicator.
Bearish Structures: Enable or disable all bearish components of the indicator.
Highlight Area of Interest: Toggle the option to highlight the Areas of Interest (enabled or disabled).
CHoCH Line: Choose the line style for the CHoCH (Solid, Dashed, or Dotted).
Width: Adjust the width of the CHoCH line.
🔹 Retracement Levels
Choose which Fibonacci retracement levels to display (e.g., 0, 0.236, 0.382, etc.).
🔹 Swing Levels & Engulfing Patterns
Swing Levels: Select how swing levels are marked (symbols like ◉, △▽, or H/L).
Engulfing Candle Patterns: Choose which engulfing candle patterns to detect (All, Structure-Based, or Disabled).
🔶 RELATED SCRIPTS
Pure-Price-Action-Structures.
Crypto Wallets Profitability & Performance [LuxAlgo]The Crypto Wallets Profitability & Performance indicator provides a comprehensive view of the financial status of cryptocurrency wallets by leveraging on-chain data from IntoTheBlock. It measures the percentage of wallets profiting, losing, or breaking even based on current market prices.
Additionally, it offers performance metrics across different timeframes, enabling traders to better assess market conditions.
This information can be crucial for understanding market sentiment and making informed trading decisions.
🔶 USAGE
🔹 Wallets Profitability
This indicator is designed to help traders and analysts evaluate the profitability of cryptocurrency wallets in real-time. It aggregates data gathered from the blockchain on the number of wallets that are in profit, loss, or breaking even and presents it visually on the chart.
Breaking even line demonstrates how realized gains and losses have changed, while the profit and the loss monitor unrealized gains and losses.
The signal line helps traders by providing a smoothed average and highlighting areas relative to profiting and losing levels. This makes it easier to identify and confirm trading momentum, assess strength, and filter out market noise.
🔹 Profitability Meter
The Profitability Meter is an alternative display that visually represents the percentage of wallets that are profiting, losing, or breaking even.
🔹 Performance
The script provides a view of the financial health of cryptocurrency wallets, showing the percentage of wallets in profit, loss, or breaking even. By combining these metrics with performance data across various timeframes, traders can gain valuable insights into overall wallet performance, assess trend strength, and identify potential market reversals.
🔹 Dashboard
The dashboard presents a consolidated view of key statistics. It allows traders to quickly assess the overall financial health of wallets, monitor trend strength, and gauge market conditions.
🔶 DETAILS
🔹 The Chart Occupation Option
The chart occupation option adjusts the occupation percentage of the chart to balance the visibility of the indicator.
🔹 The Height in Performance Options
Crypto markets often experience significant volatility, leading to rapid and substantial gains or losses. Hence, plotting performance graphs on top of the chart alongside other indicators can result in a cluttered display. The height option allows you to adjust the plotting for balanced visibility, ensuring a clearer and more organized chart.
🔶 SETTINGS
The script offers a range of customizable settings to tailor the analysis to your trading needs.
Chart Occupation %: Adjust the occupation percentage of the chart to balance the visibility of the indicator.
🔹 Profiting Wallets
Profiting Percentage: Toggle to display the percentage of wallets in profit.
Smoothing: Adjust the smoothing period for the profiting percentage line.
Signal Line: Choose a signal line type (SMA, EMA, RMA, or None) to overlay on the profiting percentage.
🔹 Losing Wallets
Losing Percentage: Toggle to display the percentage of wallets in loss.
Smoothing: Adjust the smoothing period for the losing percentage line.
Signal Line: Choose a signal line type (SMA, EMA, RMA, or None) to overlay on the losing percentage.
🔹 Breaking Even Wallets
Breaking-Even Percentage: Toggle to display the percentage of wallets breaking even.
Smoothing: Adjust the smoothing period for the breaking-even percentage line.
🔹 Profitability Meter
Profitability Meter: Enable or disable the meter display, set its width, and adjust the offset.
🔹 Performance
Performance Metrics: Choose the timeframe for performance metrics (Day to Date, Week to Date, etc.).
Height: Adjust the height of the chart visuals to balance the visibility of the indicator.
🔹 Dashboard
Block Profitability Stats: Toggle the display of profitability stats.
Performance Stats: Toggle the display of performance stats.
Dashboard Size and Position: Customize the size and position of the performance dashboard on the chart.
🔶 RELATED SCRIPTS
Market-Sentiment-Technicals
Multi-Chart-Widget

Three Bar Reversal Pattern [LuxAlgo]The Three Bar Reversal Pattern indicator identifies and highlights three bar reversal patterns on the user price chart.
The script also provides an option for incorporating various trend indicators used to filter out detected signals, allowing them to enhance their accuracy and help obtain a more comprehensive analysis.
🔶 USAGE
The script automates the detection of three-bar reversal patterns and provides a clear, visually identifiable signal for potential trend reversals.
When a reversal chart pattern is confirmed and price action aligns with the pattern, the pattern's boundaries are extended, forming levels, with the upper boundary often acting as a resistance and the lower boundary as a support.
The script allows users to filter patterns based on a specific trend direction detected by multiple trend indicators. Users can choose to view patterns that are either aligned with the detected trend or opposite to it.
Included trend indicators are: Moving Average Cloud, Supertrend, and Donchian Channels.
🔶 DETAILS
The three-bar reversal pattern is a technical analysis pattern that signals a potential reversal in the prevailing trend. The pattern consists of three consecutive bar formations:
First Bar and Second Bar: 2 consecutive of the same sentiment, representing the prevailing trend in the market.
Third Bar: Confirms the reversal by closing beyond the high or low of the first bar, signaling a potential change in market sentiment.
Various types of three-bar reversal patterns are documented. The script supports two main types:
Normal Pattern: Detects three-bar reversal patterns without requiring the third bar closing price to surpass the high (bullish pattern) or low (bearish pattern) of the first bar. It identifies basic formations signaling potential trend reversals.
Enhanced Pattern: Specifically identifies three-bar reversal patterns where the third bar closing price surpasses the high (bullish pattern) or low (bearish pattern) of the first bar. This type provides a more selective signal for stronger trend reversals.
🔶 SETTINGS
Pattern Type: Users can choose the type of 3-bar reversal patterns to detect: Normal, Enhanced, or All. "Normal" detects patterns that do not necessarily surpass the high/low of the first bar. "Enhanced" detects patterns where the third bar surpasses the high/low of the first bar. "All" detects both Normal and Enhanced patterns.
Derived Support and Resistance: Toggles the visibility of the support and resistance levels/zones.
🔹 Trend Filtering
Filtering: Allows users to filter patterns based on the trend indicators: Moving Average Cloud, Supertrend, and Donchian Channels. The "Aligned" option only detects patterns that align with the trend and conversely, the "Opposite" option detects patterns that go against the trend.
🔹 Trend Indicator Settings
Moving Average Cloud: Allows traders to choose the type of moving averages (SMA, EMA, HMA, etc.) and set the lengths for fast and slow-moving averages.
Supertrend: Options to set the ATR length and factor for Supertrend.
Donchian Channels: Option to set the length for the channel calculation.
🔶 RELATED SCRIPTS
Reversal-Candlestick-Structure .
Reversal-Signals .

N Bar Reversal Detector [LuxAlgo]The N Bar Reversal Detector is designed to detect and highlight N-bar reversal patterns in user charts, where N represents the length of the candle sequence used to detect the patterns. The script incorporates various trend indicators to filter out detected signals and offers a range of customizable settings to fit different trading strategies.
🔶 USAGE
The N-bar reversal pattern extends the popular 3-bar reversal pattern. While the 3-bar reversal pattern involves identifying a sequence of three bars signaling a potential trend reversal, the N-bar reversal pattern builds on this concept by incorporating additional bars based on user settings. This provides a more comprehensive indication of potential trend reversals. The script automates the identification of these patterns and generates clear, visually distinct signals to highlight potential trend changes.
When a reversal chart pattern is confirmed and aligns with the price action, the pattern's boundaries are extended to create levels. The upper boundary serves as resistance, while the lower boundary acts as support.
The script allows users to filter patterns based on the trend direction identified by various trend indicators. Users can choose to view patterns that align with the detected trend or those that are contrary to it.
🔶 DETAILS
🔹 The N-bar Reversal Pattern
The N-bar reversal pattern is a technical analysis tool designed to signal potential trend reversals in the market. It consists of N consecutive bars, with the first N-1 bars used to identify the prevailing trend and the Nth bar confirming the reversal. Here’s a detailed look at the pattern:
Bullish Reversal : In a bullish reversal setup, the first bar is the highest among the first N-1 bars, indicating a prevailing downtrend. Most of the remaining bars in this sequence should be bearish (closing lower than where they opened), reinforcing the existing downward momentum. The Nth (most recent) bar confirms a bullish reversal if its high price is higher than the high of the first bar in the sequence (standard pattern). For a stronger signal, the closing price of the Nth bar should also be higher than the high of the first bar.
Bearish Reversal : In a bearish reversal setup, the first bar is the lowest among the first N-1 bars, indicating a prevailing uptrend. Most of the remaining bars in this sequence should be bullish (closing higher than where they opened), reinforcing the existing upward momentum. The Nth bar confirms a bearish reversal if its low price is lower than the low of the first bar in the sequence (standard pattern). For a stronger signal, the closing price of the Nth bar should also be lower than the low of the first bar.
🔹 Min Percentage of Required Candles
This parameter specifies the minimum percentage of candles that must be bullish (for a bearish reversal) or bearish (for a bullish reversal) among the first N-1 candles in a pattern. For higher values of N, it becomes more challenging for all of the first N-1 candles to be consistently bullish or bearish. By setting a percentage value, P, users can adjust the requirement so that only a minimum of P percent of the first N-1 candles need to meet the bullish or bearish condition. This allows for greater flexibility in pattern recognition, accommodating variations in market conditions.
🔶 SETTINGS
Pattern Type: Users can choose the type of the N-bar reversal patterns to detect: Normal, Enhanced, or All. "Normal" detects patterns that do not necessarily surpass the high/low of the first bar. "Enhanced" detects patterns where the last bar surpasses the high/low of the first bar. "All" detects both Normal and Enhanced patterns.
Reversal Pattern Sequence Length: Specifies the number of candles (N) in the sequence used to identify a reversal pattern.
Min Percentage of Required Candles: Sets the minimum percentage of the first N-1 candles that must be bullish (for a bearish reversal) or bearish (for a bullish reversal) to qualify as a valid reversal pattern.
Derived Support and Resistance: Toggles the visibility of the support and resistance levels/zones.
🔹 Trend Filtering
Filtering: Allows users to filter patterns based on the trend indicators: Moving Average Cloud, Supertrend, and Donchian Channels. The "Aligned" option only detects patterns that align with the trend and conversely, the "Opposite" option detects patterns that go against the trend.
🔹 Trend Indicator Settings
Moving Average Cloud: Allows traders to choose the type of moving averages (SMA, EMA, HMA, etc.) and set the lengths for fast and slow moving averages.
Supertrend: Options to set the ATR length and factor for Supertrend.
Donchian Channels: Option to set the length for the channel calculation.
🔶 RELATED SCRIPTS
Reversal-Candlestick-Structure.
Reversal-Signals.

Delta Flow Profile [LuxAlgo]The Delta Flow Profile is a charting tool that tracks and visualizes money flow and the difference between buying and selling pressure accumulated within multiple price ranges over a specified period. It reveals the relationship between an asset's price and traders' willingness to buy or sell, helping traders identify significant price levels and analyze market activity.
The Normalized Profile displays the percentage of money flow at each price level relative to the maximum money flow level, enabling traders to easily compare levels and understand the relative importance of each price point in the context of overall trading activity.
🔶 USAGE
The Delta Flow Profile is made of two principal components with different usability, each one of them described in the sub-sections below.
🔹 Money Flow Profile
The Money Flow Profile illustrates the total buying and selling activity at different price ranges. By analyzing this profile, users can identify key price zones with substantial buying or selling pressure. These zones can often act as potential support or resistance.
The rows of the Money Flow Profile represent the trading activity at specific price ranges over a given period.
A normalized profile is included to compare each zone relative to the peak money flow using a percentage, with 100% indicating that a price range is the one with the highest accumulated money flow.
🔹 Delta Profile
The Delta Profile assesses the dominant sentiment (buying or selling) from volume delta at different price levels to gauge market sentiment and potential reversals.
Delta Profile rows with more significant buying or selling volume indicate dominance from one side of the market in that specific price area. Price coming back to that area might indicate willingness from a dominant side to further accumulate orders within it, potentially causing price to follow the direction established by this dominant side afterward.
The volume delta is determined from the user-selected Polarity Method, with "Bar Polarity" using candle sentiment to determine if a bar associated volume is buying or selling volume, and "Bar Buying/Selling Pressure" making use of the high/low price to obtain more precise results.
🔹 Level of Significance
Users can quickly highlight the price levels with the highest recorded money flow activity through the included "Level of Significance". Various display methods are included:
Developing: Show the price level with the highest recorded money flow activity spanning over the indicator calculation interval.
Level: Show the price level with the highest recorded money flow activity.
Row: Show the price zone with the highest recorded money flow activity.
These levels/zones can be used as potential support/resistance points and can serve as a reference of where prices might go next for market participants to accumulate orders.
🔶 SETTINGS
The script offers a range of customizable settings to tailor the analysis to your trading needs.
🔹 Calculation Settings
Money Flow Profile: Toggles the visibility of the Money Flow Profile.
Normalized: Toggles the visibility of the Normalized Profile.
Sentiment Profile: Toggles the visibility of the Sentiment Profile.
Polarity Method: Choose between Bar Polarity or Bar Buying/Selling Pressure to calculate the Sentiment Profile.
Level of Significance: Toggles the visibility of the level of significance line/zone.
Lookback Length / Fixed Range: Sets the lookback length.
Number of Rows: Specify how many rows each profile histogram will have.
🔹 Display Settings
Profile Width %: Alters the width of the rows in the histogram, relative to the profile length.
Profile Horizontal Offset: Enables moving the profile on the horizontal axis.
Profile Text: Toggles the visibility of profile texts, and alters the size of the text. Setting to Auto will keep the text within the box limits.
Currency: Extends the profile text with the traded currency.
Profile Price Levels: Toggles the visibility of the profile price levels.
🔶 RELATED SCRIPTS
Money-Flow-Profile
Volume-Profile-with-Node-Detection

Pure Price Action Structures [LuxAlgo]The Pure Price Action Structures indicator is a pure price action analysis tool designed to automatically identify real-time market structures.
The indicator identifies short-term, intermediate-term, and long-term swing highs and lows, forming the foundation for real-time detection of shifts and breaks in market structure.
Its distinctive/unique feature lies in its reliance solely on price patterns, without being limited by any user-defined input, ensuring a robust and objective analysis of market dynamics.
🔶 USAGE
Market structure is a crucial aspect of understanding price action. The script automatically identifies real-time market structure, enabling traders to comprehend market trends more easily. It assists traders in recognizing both trend changes and continuations.
Market structures are constructed from three sets of swing points, short-term swings, intermediary swings, and long-term swings. Market structures associated with longer-term swing points are indicative of longer-term trends.
A market structure shift (MSS), also known as a change of character (CHoCH), is a significant event in price action analysis that may signal a potential shift in market sentiment or direction. Conversely, a break of structure (BOS) is another significant event in price action analysis that typically indicates a continuation of the prevailing trend.
However, it's important to note that while an MSS can be the first indication of a trend reversal and a BOS signifies a continuation of the prevailing trend, they do not guarantee a complete reversal or continuation of the trend.
In some cases, MSS and BOS levels may also act as liquidity zones or areas of price consolidation, rather than indicating a definitive change in market direction or continuation. Traders should approach them with caution and consider additional factors to confirm the validity of the signal before making trading decisions.
🔶 DETAILS
🔹 Market Structures
Market structures are based on the analysis of price action and aim to identify key levels and patterns in the market, where swing point detection is one of the core concepts within ICT trading methodologies and teachings.
Swing points are automatically detected solely based on market movements, without any reliance on user-defined input.
🔹 Utilizing Swing Points
Swing points are not identified in real time as they occur. While short-term swing points may be displayed with a delay of at most one bar, the identification of intermediate and long-term swing points depends entirely on market movements. Furthermore, detection is not limited by any user-defined input but relies solely on pure price action. Consequently, swing points are not typically utilized in real-time trading scenarios.
Traders often analyze historical swing points to discern market trends and pinpoint potential entry and exit points for their trades. By identifying swing highs and lows, traders can:
Recognize Trends: Swing highs and lows help traders identify the direction of the trend. Higher swing highs and higher swing lows indicate an uptrend, while lower swing highs and lower swing lows indicate a downtrend.
Identify Support and Resistance Levels: Swing highs often serve as resistance levels, known in ICT terminology as Buyside Liquidity Levels, while swing lows function as support levels, also referred to in ICT terminology as Sellside Liquidity Levels. Traders can utilize these levels to strategize entry and exit points for their trades.
Spot Reversal Patterns: Swing points can form various reversal patterns, such as double tops or bottoms, head and shoulders patterns, and triangles. Recognizing these patterns can signal potential trend reversals, allowing traders to adjust their strategies accordingly.
Set Stop Loss and Take Profit Levels: In the context of ICT teachings, swing levels represent specific price levels where a concentration of buy or sell orders is anticipated. Traders can target these liquidity levels/pools to accumulate or distribute their positions, essentially using swing points to establish stop loss and take profit levels for their trades.
Overall, swing points provide valuable information about market dynamics and can assist traders in making more informed trading decisions.
🔶 SETTINGS
🔹 Structures
Swings and Size: Toggles the visibility of the structure's highs and lows, assigns an icon corresponding to the structures, and controls the size of the icons.
Market Structures: Toggles the visibility of the market structures.
Market Structure Labels: Controls the visibility of labels that highlight the type of market structure.
Line Style and Width: Customizes the style and width of the lines representing the market structure.
Swing and Line Colors: Customizes colors for the icons representing highs and lows, and the lines and labels representing the market structure.
🔶 RELATED SCRIPTS
Market-Structures-(Intrabar).
Buyside-Sellside-Liquidity.

Market Structure (Intrabar) [LuxAlgo]The Market Structure (Intrabar) indicator is designed to automatically detect and highlight real-time intrabar market structures, a core component of the Smart Money Concepts methodology.
🔶 USAGE
The proposed indicator gives a detailed picture of the most recent candle lower timeframe trends, highlighting market structures within them.
This can be particularly useful to assess the price dynamic within the most recent candle. For example, we can see how pronounced a trend is by the number of opposite bullish/bearish market structures formed within the candle.
Users can select the intrabar timeframe of interest from the "Intrabar Timeframe" setting, using a timeframe significantly lower than the chart timeframe will return more intrabar candles and potentially more market structures.
🔹 Dashboard
Users have access to a dashboard returning useful statistics such as the number of formed CHoCH's and BOS's from the intrabar prices. These can be indicative of how predominant a trend is within the intrabar data or if there exist multiple trends.
🔶 DETAILS
Market structures allow determining trend continuations as well as trend reversals in the market through two distinct structures:
🔹 Change of Character (CHoCH)
A change of character (CHoCH) refers to a shift in the market behavior of a security that is driven by changes in the underlying supply and demand dynamics. CHoCH's are indicative of confirmed reversals.
🔹 Break of Structure (BoS)
The break of structure (BoS) refers to the point at which a key level of support or resistance is broken. BOS's are indicative of confirmed trend continuations.
🔶 SETTINGS
🔹Inside the Bar Market Structure
Intrabar Timeframe: Lower timeframe setting option, if set to 'Auto' the script will determine the lower timeframe based on the chart timeframe.
Intrabar Market Structure, Length: Toggles the visibility of the break of structures and change of characters. Length defines the detection length of the swing levels.
Intrabar Swing Levels: Toggles the visibility of the swing levels, including a color customization option for highs and lows.
Intrabar Statistics: Toggles the visibility of the dashboard. Some further statistical details are presented in the tooltips of the table cells
🔹 General
Market Structure Colors: Color customization option for the break of structure and change of character lines and labels.
Intrabar Candle Colors: Color customization option for intrabar candles.
Intrabar Candles Horizontal Offset: Adjusting the intrabar candles horizontal position
Dashboard: Dashboard position and size customization option
🔶 LIMITATIONS
Please note that seconds-based intervals are available for premium and professional plan holders, which implies that the seconds-based intervals usage of the indicator may not be available for all users depending on their subscription plan.
🔶 RELATED SCRIPTS
Smart-Money-Concepts
ICT-Concepts

Liquidation Levels [LuxAlgo]The Liquidation Levels indicator aims at detecting and estimating potential price levels where large liquidation events may occur.
By analyzing liquidation Levels, traders can identify potential support & resistance levels, identify stop-loss levels, and gauge market sentiment and potential areas of price volatility.
🔶 USAGE
Liquidation refers to the process of forcibly closing a trader's leveraged positions in the market. It occurs when a trader's margin account can no longer support their open positions due to significant losses or a lack of sufficient margin to meet the maintenance margin requirements.
Liquidation events happen at all times and the script focuses on detecting the most significant ones. Bubbles will appear on the relevant price bar when larger trading activity has been detected. Larger bubbles represent more significant potential liquidation levels. The lines attached to the bubbles represent the liquidation zones at that price.
These liquidation levels are based on clusters of price points where highly leveraged traders open long or short positions. High leverage is identified as 100x, 50x, and 25x leverages used for both long and short positions. The script allows users to either remove or customize leverage levels.
Price generally heads towards zones or clusters of liquidity.
🔶 SETTINGS
🔹Liquidation Levels
Reference Price: defines the base price in calculating liquidation levels.
Volume Threshold: The volume threshold is the primary factor in detecting the significant trading activities that could potentially lead to liquidating leveraged positions.
Volatility Threshold: The volatility threshold option is the secondary factor that aims at detecting significant movement in the underlying asset’s price with relatively lower trading activities that could potentially also lead to liquidating high-leveraged positions.
Leverage Options: The leverage options are where the trader will set the desired leverage value and customize the potential liquidation level colors.
Hide Liquidation Bubbles: Toggles the visibility of the bubbles.
Hide Liquidation Levels: Toggles the visibility of the lines.
🔶 RELATED SCRIPTS
Liquidity-Sentiment-Profile
Buyside-Sellside-Liquidity

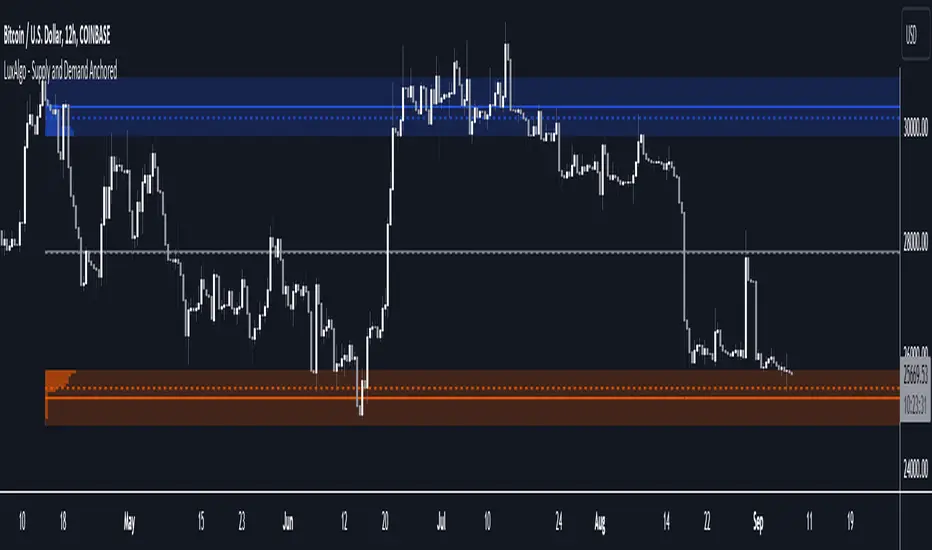
Supply and Demand Anchored [LuxAlgo]The Supply and Demand Anchored indicator is an anchored version of the popular Supply and Demand Visible Range indicator. Once adding the indicator to the chart, users need to manually select the starting and ending points for the indicator's calculation. The estimated supply/demand zones are then extended.
🔶 USAGE
The proposed indicator makes use of the same method highlighted in previous posts (see related scripts section below) to estimate supply and demand zones.
When adding the indicator to the chart, users will be prompted to select a starting and ending point for the calculation of the supply and demand zones, click on your chart to select those points.
Once calculated, each zone/level will be extended to the right of the chart. These can be used as support/resistance zones. Clicking on one of the graphical elements of the indicator or the indicator title will highlight the starting and ending calculation points, these can be dragged to be set at different locations.
🔶 SETTINGS
Threshold %: Percentage of the total visible range volume used as a threshold to set supply/demand areas. Higher values return wider areas.
Resolution: Determines the number of bins used to find each area. Higher values will return more precise results.
Intra-bar TF: Timeframe used to obtain intra-bar data.
🔶 RELATED SCRIPTS
Liquidity Voids (FVG) [LuxAlgo]The Liquidity Voids (FVG) indicator is designed to detect liquidity voids/imbalances derived from the fair value gaps and highlight the distribution of the liquidity voids at specific price levels.
Fair value gaps and liquidity voids are both indicators of sell-side and buy-side imbalance in trading. The only difference is how they are represented in the trading chart. Liquidity voids occur when the price moves sharply in one direction forming long-range candles that have little trading activity, whilst a fair value is a gap in price.
🔶 USAGE
Liquidity can help you to determine where the price is likely to head next. In conjunction with higher timeframe market structure, and supply and demand, liquidity can give you insights into potential price movement. It's essential to practice using liquidity alongside trend analysis and supply and demand to read market conditions effectively.
The peculiar thing about liquidity voids is that they almost always fill up. And by “filling”, we mean the price returns to the origin of the gap. The reason for this is that during the gap, an imbalance is created in the asset that has to be made up for. The erasure of this gap is what we call the filling of the void. And while some voids waste no time in filling, some others take multiple periods before they get filled.
🔶 SETTINGS
The script takes into account user-defined parameters and detects the liquidity voids based on them, where detailed usage for each user-defined input parameter in indicator settings is provided with the related input's tooltip.
🔹 Liquidity Detection
Liquidity Voids Threshold: Act as a filter while detecting the Liquidity Voids. When set to 0 basically means no filtering is applied, increasing the value causes the script to check the width of the void compared to a fixed-length ATR value
Bullish: Color customization option for Bullish Liquidity Voids
Bearish: Color customization option for Bearish Liquidity Voids
Labels: Toggles the visibility of the Liquidity Void label
Filled Liquidity Voids: Toggles the visibility of the Filled Liquidity Voids
🔹 Display Options
Mode: Controls the lookback length of detection and visualization
# Bars: Lookback length customization, in case Mode is set to Present
🔶 RELATED SCRIPTS
Buyside-Sellside-Liquidity
Fair-Value-Gaps

Reversal Signals [LuxAlgo]The Reversal Signals indicator is a technical analysis tool that aims to identify when a trend is fading and potentially starting to reverse.
As a counter-trend tool, the Reversal Signals indicator aims to solve the problem of several technical analysis indicators that perform well during trending markets but struggle in ranging markets. By understanding the key concepts and applications of the tool, traders can enhance their market timing and improve their trading strategies.
Note: It's important to explore the settings of the indicator to customize to your own usage & display as there are various options available as covered below.
🔶 USAGE
The Reversal Signals indicator is comprised of two main phases: Momentum Phase and Trend Exhaustion Phase . These phases help identify potential trend reversals in bullish, bearish, and ranging markets.
🔹The Momentum Phase
The momentum phase consists of a 9-candle count and in rare cases 8-candle count. In a bullish trend, a starting number ‘1’ is plotted if a candle closes higher than the close of a candle four periods ago. In a bearish trend, a starting number ‘1’ is plotted if a candle closes lower than the close of a candle four periods ago.
The following numbers are plotted when each successive candle satisfies the four-period rule. The potential reversal point comes when the Reversal Signals plot a label on top of a candle in a bullish trend or at the bottom of a candle in a bearish trend. The momentum phase is immediately canceled if, at any point, a candle fails to satisfy the four-period rule.
Based on the extremes of the momentum phase, the Reversal Signals generate support & resistance levels as well as risk/stop levels.
🔹 The Trend Exhaustion Phase
The trend exhaustion phase starts after completing the momentum phase and consists of a 13-candle count. In a bullish trend exhaustion phase, each candle’s close is compared to the close of two candles earlier, and the close must be greater than the close two periods earlier. In a bearish trend exhaustion phase, each candle’s close is compared to the close of two candles earlier, and the close must be lower than the close two periods earlier.
The trend exhaustion phase does not require a consecutive sequence of candles; if the order of candles is interrupted, the trend exhaustion phase is not canceled. The trend exhaustion phase generates stronger trading signals than the momentum phase, with the potential for longer-lasting price reversals.
🔹 Trading Signals
The Reversal Signals script presents an overall setup and some phase-specific trade setup options, where probable trades might be considered. All phase-specific trade setups, presented as options, are triggered once the selected phase is completed and followed by a price flip in the direction of the trade setup.
Please note that those setups are presented for educational purposes only and do not constitutes professional and/or financial advice
- Momentum: Enter a trade at momentum phase completion, and search for buy (sell) when the bullish (bearish) momentum phase pattern is complete. Ideally, the momentum phase completion should close near its support/resistance line but shall not be above them, which indicates continuation of the trend
- Exhaustion: Enter a trade on trend exhaustion phase completion, and search for buy (sell) when the bullish (bearish) trend exhaustion phase is complete
- Qualified: Buy (sell) when a bullish (bearish) trend exhaustion phase combined with another bullish (bearish) momentum phase sequence is complete
Long trade setups are presented with "L" label and short trade setups with "S" label, where the content of the label displays details related to the probable trade opportunity
Once a phase-specific trade setup is triggered then the Reversal Signals script keeps checking the status of the price action relative to the phase-specific trade setups and in case something goes wrong presents a caution label. Pay attention to the content of the caution labels as well as where they appear. A trade signal, followed immediately by a warning indication can be assumed as a continuation of the underlying trend and can be traded in the opposite direction of the suggested signal
It is strongly advised to confirm trading setups in conjunction with other forms of technical and fundamental analysis, including technical indicators, chart/candlestick pattern analysis, etc.
🔶 DETAILS
The Reversal Signals script performs the detection of the phases by counting the candlestick meeting the specific conditions, which includes:
- Detection of the 8th and 9th candle perfection during the momentum phase
- In some cases, the 8th count will be assumed as momentum phase completion
- Trend exhaustion phase counting stops in case any type of momentum phase completion is detected during the counting process
- Postponing the last count of the trend exhaustion phase, the 13th candle must be below/above the 8th candle and if not the candles will be indicated with '+' sign under them and the script continues to search for a 13th candle at the next ones until the conditions are met
🔶 ALERTS
When an alert is configured, the user will have the ability to be notified in case;
Momentum / Trend Exhaustion phase completion
Support & Resistance level cross detection
Stop / Risk level cross detection
Long / Short Trade Setups are triggered
Please note, alerts are available with 'any alert() function call' and the alerts will be received only for the features that are enabled during alert configuration
🔶 SETTINGS
🔹 Momentum Phase
Display Phases: displays the momentum phases, where the Completed option allows the display of only completed momentum phases. The detailed option allows the display of the entire process of the momentum phase processes
Support & Resistance Levels: Toggles the visibility of the Support & Resistance Levels and Line Styling options
Momentum Phase Risk Levels: Toggles the visibility of the momentum phase Stop/Risk Levels and Line Styling options
For color options please refer to the options available under the style tab
🔹 Trend Exhaustion Phase
Display Phases: displays the trend exhaustion phases, where the Completed option allows the display of only completed trend exhaustion phases. The detailed option allows the display of the entire process of the trend exhaustion phase processes
Trend Exhaustion Phase Risk Levels: Toggles the visibility of the trend exhaustion phase Stop/Risk Levels
Trend Exhaustion Phase Target Levels: Toggles the visibility of the trend exhaustion phase Target Levels
For color options please refer to the options available under the style tab
🔹 Trade Setups
Overall Trend Direction & Trade Setup: displays the overall trend and probable trade setup levels, the users should search for a price flip and confirm with other means of technical and fundamental analysis for the trade setups once the label is plotted
Phase-Specific Trade Setup Options
Momentum: Searches for a trade setup after momentum phase completion
Exhaustion: Searches for a trade setup after trend exhaustion phase completion, stronger trend reversal possibility compared to momentum phase setup
Qualified: Searches for a trade setup after the trend exhaustion phase followed by a momentum phase completion
None: No trade setups are presented
Price Flips against the Phase Specific Trade Setups: enables checking the price action relative to the phase-specific trade setups
🔶 RELATED SCRIPTS
Here are the scripts that may add additional insight during potential trading decisions.
Buyside-Sellside-Liquidity
Support-Resistance-Classification

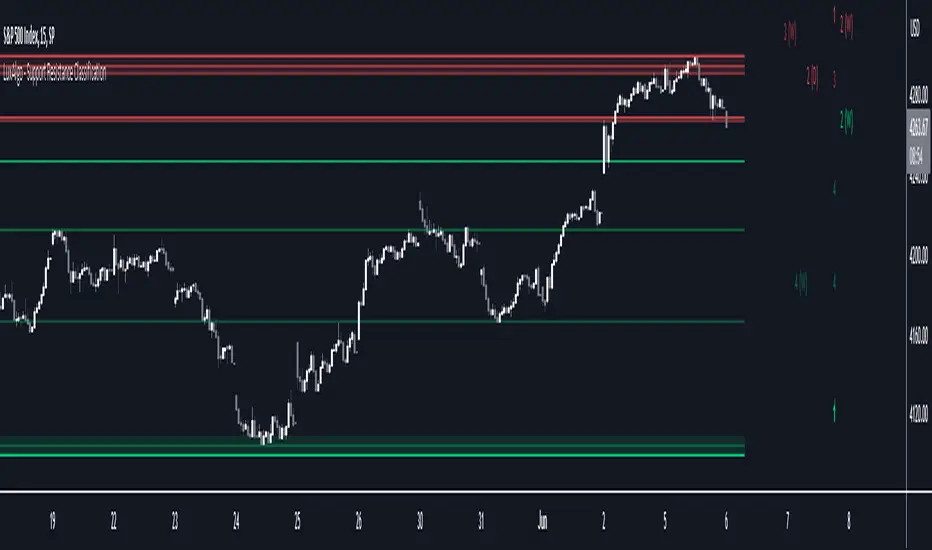
Support Resistance Classification [LuxAlgo]The Support Resistance Classification indicator shows SR levels from a user-defined range using higher time-frame data (HTF). Levels are classified 1 through 10 based on their strength, with lower values indicating stronger support/resistance levels.
This indicator doesn't use visible range functionality, in contrast to our Support Resistance Classification (VR) indicator, it uses a set lookback period to find support/resistance levels.
Since both techniques cannot be used together in 1 script, we developed a separate, NON-VR version.
🔶 USAGE
Certain indicators on higher timeframes can provide longer-term support/resistance levels on lower timeframes. Users can use the provided levels and use them as references for future support/resistance levels.
The classification algorithm measures the strength of a support/resistance level using the set range and is in a range of 1 to 10, with higher values indicating a weaker support/resistance.
Supports/resistances highlighted by the indicator can be used for future applications by marking them on the chart (quickly done with alt + h).
🔶 DETAILS
All calculations are based on what is seen in the last amount of bars, which is the period between the blue vertical line and the last candle:
Since only Swings which are not broken are included, every break would exclude that swing. Therefore, even when 'value' is chosen at Settings ('Value'), breaks are always calculated on the entire line.
🔶 SETTINGS
Lookback: Amount of bars from current bar to x bars back , this is the period where support/resistance levels are calculated.
Fade: After x breaks the line becomes invisible
Value:
value:
• SMA, upper/lower: the breaks are triggered on the moving average itself
• Fibonacci Pivot Point levels, Previous High, Previous Low: only last HTF values can be used for breaks
• Swings (see SWING SETTINGS)
line:
• SMA, upper/lower: the breaks are triggered on the entire line, based on its latest value
• Fibonacci Pivot Point Levels, Previous High, Previous Low: breaks are triggered on the entire line, based on its latest value
• Swings (see SWING SETTINGS)
🔹 Swing Settings
Swings are always calculated at the current timeframe, setting an HTF is not applicable to Swings.
Left/Right: for Swing calculation ( pivothigh , pivotlow )
Show: enables you to see the pivot points
🔹 Set
N°: The concerning number
TYPE:
• SMA (Simple Moving Average)
• Previous High/Low
• Upper/Lower ( Bollinger Bands )
• Pivot Point levels : "Fibonacci"
LENGTH: sets the 'Number of bars', needed for calculations (applicable for SMA, upper/lower)
MULT: sets the 'Standard deviation factor' (only applicable for upper/lower - BB)
HTF: sets 'Higher Time Frame' (applicable for SMA, upper/lower, Previous High/Low, Fibonacci)
🔹 Show Values
You can make up to 5 values visible (if you want to check/verify), except for Swings (see SWING SETTINGS)
To do so, enable (A -> E), and choose the N° you want to see.
This also is a useful tool if you're not sure which value you want to set.
Dynamic Extreme Channels & Reversals [LuxAlgo]The Dynamic Extreme Channels & Reversals indicator provides an adaptive framework for identifying price extremes and trend shifts through self-adjusting boundaries. Unlike static channels, this tool dynamically resets its levels based on price activity, offering a responsive environment for trend following and mean-reversion analysis.
🔶 USAGE
The indicator functions by tracking the highest highs and lowest lows over a specific window. When the price fails to make a new extreme within the defined period, the boundaries contract toward the current price action. This behavior creates a "breathing" channel that adapts to market volatility and consolidation phases.
Users can toggle between two primary viewing modes:
Channel Mode: Displays the upper, lower, and midline boundaries. This is ideal for identifying overextended price levels and potential mean-reversion targets.
Trailing Stop Mode: Simplifies the visual output into a single step-line that tracks the lower boundary during uptrends and the upper boundary during downtrends, serving as a dynamic exit or trend-following level.
🔹 Reversal Signals
The script includes built-in reversal signals designed to catch "blow-off" tops or "panic" bottoms where price briefly exceeds a boundary but immediately loses momentum.
Bullish Signal (▲): Occurs when the price hits a new lower extreme (LL) but the current candle manages to peak back above the channel midline.
Bearish Signal (▼): Occurs when the price hits a new higher extreme (HH) but the current candle manages to drop below the channel midline.
The sensitivity and frequency of these signals are directly influenced by the Lookback Period and Reset Alpha % :
Lookback Period: A shorter lookback causes the channel boundaries to "reset" more frequently. This results in tighter channels and more frequent reversal signals, as the midline becomes easier to cross. A longer lookback creates wider, more stable channels, resulting in fewer, high-conviction signals.
Reset Alpha %: This determines how aggressively the levels move toward the price after the lookback period expires. A high Alpha (e.g., 100%) creates sharp adjustments, which can lead to rapid signal generation during choppy markets. A lower Alpha creates smoother transitions, filtering out noise in the reversal logic.
🔶 DETAILS
The core logic avoids standard rolling maximum/minimum functions to provide a more "sticky" boundary. Instead of the channel edge constantly moving with every bar, it remains fixed until a new extreme is reached or the "timer" (Lookback Period) runs out.
When the timer runs out, the level interpolates toward the price based on the Reset Alpha. This simulates a decaying memory of past price extremes, ensuring the indicator remains relevant even after long periods of sideways movement.
🔶 SETTINGS
🔹 Core Settings
Lookback Period: The number of bars the indicator waits before adjusting an extreme level if no new high/low is found.
Reset Alpha %: Controls the intensity of the level adjustment. 100% resets the level entirely to the current price, while 0% keeps it static.
Trailing Stop Mode: Switches the display from a three-line channel to a single trend-following stop line.
🔹 Visuals
Show Reversal Signals: Toggles the visibility of the triangle reversal labels.
Upper Color: Customizes the color and transparency of the upper boundary.
Midline Color: Customizes the color and transparency of the center line.
Lower Color: Customizes the color and transparency of the lower boundary.
🔹 Dashboard
Dashboard: Toggles the on-screen information panel.
Position: Controls the location of the dashboard on the chart.
Size: Controls the scale of the dashboard text and cells.

Polynomial Regression Clustering [LuxAlgo]The Polynomial Regression Clustering indicator utilizes K-Means clustering to categorize historical price data into discrete levels and fits polynomial regression curves to each identified cluster.
This tool allows traders to visualize non-linear trends within specific price regimes, providing a unique perspective on support, resistance, and price momentum.
🔶 USAGE
The indicator identifies "K" number of clusters based on the vertical distribution of price over a user-defined lookback period. Each cluster represents a group of bars that share similar price levels, and a polynomial regression line is calculated to represent the localized trend for that specific group.
🔹 Cluster Identification
The script groups price action into color-coded dots. By default, it uses the HL2 (Average price) to determine which cluster a bar belongs to. This is particularly useful for identifying historical value areas where price has spent a significant amount of time.
🔹 Polynomial Fitting
Unlike standard linear regression, which produces a straight line, the polynomial regression curves can bend to fit the data more accurately.
A Polynomial Degree of 1 will result in a standard linear regression (straight lines). A Polynomial Degree of 2 or higher allows for curves that capture parabolic moves or cyclical swings within each cluster.
🔹 Future Projections
The current active cluster (the one containing the most recent price point) can be projected into the future. This allows you to see where the localized trend for the current price regime is heading based on the mathematical fit of historical data.
🔶 DETAILS
🔹 K-Means Algorithm
The script uses an iterative K-Means algorithm to find the optimal centroids (center points) for the price levels. It calculates the distance of each price point to the nearest centroid and refines the centroid position until the clusters are stable or the maximum iterations are reached.
🔹 Regression Logic
Once price points are assigned to a cluster, the script solves for the coefficients of a polynomial equation that minimizes the distance between the line and the cluster's data points. To ensure numerical stability with higher degrees, the horizontal (time) axis is normalized before performing matrix operations.
🔶 SETTINGS
🔹 K-Means
Number of Clusters (K): Defines how many price levels the indicator should look for. Higher values create more granular levels. Lookback Period: The number of recent bars used to perform the clustering and regression calculation. Max Iterations: The maximum number of refinement steps for the K-Means algorithm.
🔹 Regression
Polynomial Degree: Controls the "bend" of the regression lines. Higher degrees allow for more complex curves. Extend All Fits to Current Bar: When enabled, the regression lines for all historical clusters are extended to the rightmost edge of the chart. Project Current Cluster into Future: Extends the current regime's regression line into the future (empty space) using a dashed line.
🔹 Visual Style
Show Regression Lines: Toggles the visibility of the polynomial curves. Show Cluster Dots: Toggles the visibility of the colored dots on each price bar. Dot Size: Adjusts the size of the cluster dots. Cluster Colors: Customizable colors for each of the identified clusters.

Clusters Volume Profile [LuxAlgo]The Clusters Volume Profile indicator utilizes K-Means clustering to categorize historical price action into distinct groups and generates individual volume profiles for each detected cluster. This tool provides a unique perspective on volume distribution by isolating price behaviors based on proximity rather than strictly chronological order.
🔶 USAGE
The indicator identifies "clusters" of price activity within a user-defined lookback period. Each cluster is assigned a unique color and its own horizontal volume profile, allowing traders to see where liquidity is most concentrated within specific price regimes.
🔹 Identifying Institutional Zones
Traders can use the Point of Control (POC) of high-volume clusters to identify significant institutional interest. Because the K-Means algorithm groups price action by density rather than time, a cluster's POC often represents a "fair value" level where significant exchange occurred. These dashed POC lines frequently act as robust support or resistance levels when price returns to them in the future.
🔹 Market Regime Detection
By observing the vertical distribution and overlap of clusters, traders can identify market phases. Overlapping clusters with high volume often indicate accumulation or distribution phases (sideways markets), whereas distinct, vertically separated clusters with lower volume gaps between them suggest a trending environment. A shift from multiple overlapping clusters to a new, isolated cluster can signal a breakout or the start of a new trend.
🔹 Precision Entry & Exits
Cluster boundaries and POC lines provide concrete levels for trade management. An entry can be sought when price retests a high-volume cluster POC, while stops can be placed outside the total price range of that specific cluster (the area covered by its volume profile). Conversely, targets can be set at the POC of the next major cluster above or below current price action.
🔹 Volume Conviction
The tool provides specific volume metrics that allow traders to gauge conviction. By comparing the "Total" volume label of one cluster against another, a trader can determine which price regime had more participation. A breakout into a price zone with a high-volume cluster suggests stronger conviction and a higher probability of the level holding compared to a zone with low total volume.
🔶 DETAILS
The script employs a K-Means clustering algorithm. This process involves:
Initializing "centroids" across the price range of the lookback period.
Iteratively assigning each price bar to the nearest centroid based on the HLC2 (median) price.
Recalculating centroids based on the volume-weighted average price of the assigned bars.
Finalizing assignments after the specified number of iterations to ensure stable clusters.
By separating price action into these clusters, the tool helps identify high-interest zones that might be obscured by a single, traditional Volume Profile.
🔶 SETTINGS
🔹 Clustering Settings
Lookback Period: Determines the number of recent bars used for the clustering analysis.
Number of Clusters: Sets how many distinct price groups the algorithm should attempt to find (2 to 10).
K-Means Iterations: Controls the number of times the algorithm refines the cluster centers. Higher values can lead to more stable results.
🔹 Volume Profile Settings
Rows per Cluster VP: Defines the vertical resolution (number of bins) for each individual cluster's profile.
Max VP Width (Bars): Sets the maximum horizontal length of the volume profile histograms.
VP Offset: Adjusts the horizontal spacing between the current bar and the start of the volume profiles.
Highlight Price Dots: Toggles the visibility of the colored dots on the price action to identify cluster assignments.
Dot Size: Adjusts the size of the cluster assignment dots on the chart, ranging from tiny to huge.

Crypto PCA [LuxAlgo]The Crypto PCA indicator provides a sophisticated, multi-asset sentiment gauge by applying Principal Component Analysis (PCA) to a basket of the top 20 cryptocurrencies.
By extracting the primary driver of variance across these assets, the tool offers a "market-wide" oscillator that filters out individual coin noise to highlight the dominant trend and sentiment shifts in the crypto space.
In modern quantitative finance, PCA is used to reduce dimensionality and identify the underlying factors that move a group of assets. This indicator brings that institutional-grade approach to the retail trader, condensing the price action of Bitcoin, Ethereum, Solana, and 17 other majors into a single, actionable signal.
🔶 USAGE
The script serves as a macro-sentiment oscillator, allowing traders to see the "hidden" force driving the crypto market. It is designed to identify when the market is moving in unison and when that collective movement has reached an extreme.
🔹 Identifying Market Regimes
The primary use of the PCA line (PC1) is to determine the current market regime. When the oscillator is above the zero line and colored green, it indicates that the majority of the top 20 assets are experiencing positive variance, signaling a broad bullish regime. Conversely, when the line is below zero and colored red, the market is in a collective bearish state. Traders can use this to align their individual trades with the direction of the total market energy.
🔹 Using Snapshot Mode for Situational Analysis
While the continuous mode is ideal for long-term trend following, the Snapshot Mode provides a focused view of market dynamics over the most recent lookback window. This mode isolates the current sentiment cycle, allowing traders to see the specific trajectory and "shape" of the latest move without the influence of older historical data.
By enabling Snapshot Mode, you can analyze the immediate internal structure of the market. It is particularly useful for identifying whether a recent pump or dump is a coordinated market-wide event or a more fragmented move. This helps in distinguishing between a broad structural shift and a temporary volatility spike.
🔹 Spotting Overextended Sentiment
The indicator includes dashed horizontal lines at +2 and -2, representing standard deviation thresholds. Because the assets are standardized before calculation, these levels mark statistical extremes.
Overbought Extremes: When the PCA line exceeds +2, the broad market is significantly overextended to the upside. This often precedes a cooling-off period or a mean-reversion event across the entire sector.
Oversold Extremes: When the PCA line drops below -2, it suggests a "panic" or exhausted selling state across the basket. This can signal potential bottoming interest or a relief rally.
🔹 Gauging Relative Strength
The faint "ghost" lines in the background represent the individual standardized price paths of the 20 included assets. By comparing these to the main PCA line, traders can identify leaders and laggards. An asset line that stays consistently above the PCA line during a rally is exhibiting relative strength, while an asset trailing below the PCA line is underperforming the market average.
🔶 DETAILS
The indicator follows a rigorous mathematical pipeline to ensure the data is statistically significant and comparable across assets with different price scales.
🔹 Standardization (Z-Scores)
Before performing PCA, every asset must be on the same scale. The script converts the price of all 20 assets into Z-scores based on the user-defined Lookback Period. A Z-score tells us how many standard deviations a price is from its mean. This allows the movement of a high-priced asset like BTC to be mathematically compared to a lower-priced asset like PEPE.
🔹 The Basket & PCA Approximation
The indicator includes the following assets: BTC, ETH, BNB, XRP, SOL, TRX, DOGE, ADA, BCH, WBTC, XLM, LTC, HBAR, LINK, AVAX, PEPE, DOT, UNI, NEAR, and ICP.
The script uses a correlation-based approximation to find the First Principal Component. It calculates the correlation of each asset to the equally weighted basket and uses these correlations as "loadings" to compute the PC1. This ensures that assets moving in sync with the general market trend are given higher priority in the final oscillator value.
🔹 Why PCA?
Most "Crypto Indices" are simply weighted averages. PCA is superior because it identifies the commonality between assets. If 18 coins are moving up and 2 are moving down, PCA gives more weight to the 18 moving together, as they represent the "Principal Component" of the market's current energy.
🔶 SETTINGS
🔹 Main Settings
Lookback Period (N): Determines the window used for Z-score standardization and PCA calculation. A shorter period makes the indicator more reactive, while a longer period identifies macro-cycle shifts.
Z-Score Smoothing: Applies a Simple Moving Average (SMA) to the standardized asset values before the PCA calculation. This effectively filters out high-frequency noise and produces a smoother principal component line, which is useful for reducing false regime shifts in volatile markets.
Enable Snapshot Mode: Switches the visual output from a continuous rolling line to a static view of the PCA over the most recent lookback window.
🔹 Visual Settings
Standardized Assets Color: Controls the color and transparency of the 20 individual asset lines.
Bull/Bear Colors: Defines the colors used for positive and negative market sentiment.
Disclaimer: This indicator is a statistical tool for sentiment analysis and does not constitute financial advice. The PCA approach measures variance and correlation, not guaranteed future direction.

Precision Market Entropy Heatmap [LuxAlgo]The Precision Market Entropy Heatmap indicator provides a high-resolution visualization of volume distribution and market activity within specific anchor intervals using intrabar data.
By utilizing lower timeframe (LTF) precision, it maps out where the most significant trading activity occurred, allowing traders to identify institutional interest zones and "fair value" areas through a dynamic heat-mapped profile.
🔶 USAGE
The indicator segments the chart into blocks based on the selected Anchor Interval. Within each block, a vertical distribution of volume is calculated using the Intrabar Precision setting to ensure the heatmap accurately reflects market participation at specific price levels.
Heatmap Blocks : Brighter colors represent higher volume concentrations (high entropy). These areas often act as significant support or resistance zones where the market has previously found "fair value" or high liquidity.
Identifying Institutional Interest : High-volume "bright" nodes represent price levels where heavy institutional participation occurred. These nodes act as powerful magnets or barriers for future price action.
Navigating Liquidity Voids : Darker areas indicate low volume nodes (low entropy). Price often "slips" through these gaps quickly. Traders can use these zones to anticipate fast-moving price action or set targets beyond the void.
Trend Direction via POC : Observe the slope and shifts of the Developing POC polyline. An ascending POC confirms bullish value migration, while a descending one suggests bearish value migration.
Mean Reversion : Significant price deviations from the largest high-volume node, when the POC remains static, can signal that the market is overextended and likely to return to "fair value."
Breakout Validation : Use the blocks to identify compression zones. A breakout is more reliable when the POC shifts into the new range, confirming that the move is backed by volume and accepted by the market.
POC Extensions : Dashed lines extend the session's final POC. These are dynamically colored based on their relationship to the current price: Green if the POC is below the current price (potential support) and Red if above (potential resistance).
🔶 DETAILS
Unlike standard Volume Profiles that look at fixed ranges, this script focuses on "Entropy" by visualizing the density of distribution across a user-defined grid.
By requesting security data from lower timeframes, it provides a much more granular view of price action than what is visible on the current chart timeframe alone.
The indicator uses a gradient-based coloring system to distinguish between low-activity areas and high-volume nodes, making it easier to spot "Liquidity Voids" (darker areas) and "High Volume Nodes" (brighter areas).
🔶 SETTINGS
🔹 Heatmap Settings
Anchor Interval : Sets the timeframe that defines each heatmap block (e.g., "D" for Daily blocks).
Intrabar Precision : Determines the lower timeframe used to calculate the volume distribution. Lower values (like "1m") provide higher precision but are limited by available historical data.
Number of Rows : Controls the vertical price resolution of the heatmap grid. Higher values create a more detailed but computationally heavier profile.
🔹 Style Settings
Heatmap Intensity : A three-color gradient selector that defines the color transition from low to high volume areas.
Heatmap Transparency : Adjusts the visibility of the heatmap blocks on the chart.
POC Extension (Bull/Bear) : Sets the colors for the dashed POC lines based on whether they are currently below (Bull) or above (Bear) the market price.
Show Developing POC : Toggles the visibility of the real-time POC polyline.
Auto : When enabled, the developing POC color automatically syncs with your chart theme's foreground color.
🔹 Display Settings
Max Sessions to Show : Limits the number of historical heatmap blocks rendered on the chart to maintain performance.
Extend POCs to Current Bar : When enabled, historical POC lines will extend to the far right of the chart until they are replaced by newer sessions.

Midnight Open Retracement [LuxAlgo]The Midnight Open Retracement indicator highlights the 12:00 AM ET opening price and provides real-time probability statistics for price retracing to this level during the New York session.
Designed specifically with NQ (Nasdaq 100) futures data in mind, the tool helps traders identify high-probability "magnet" levels for New York open scalps based on historical performance.
🔶 USAGE
The Midnight Open is a cornerstone of ICT concepts, acting as a "true" daily open that often serves as a point of institutional re-accumulation or distribution. This script automates the identification of this level and provides a dashboard to help traders decide when to expect a retracement.
🔹 Identifying the Bias
The script compares the New York opening price (9:30 AM ET) to the Midnight opening price:
If NY opens above the Midnight Open, the indicator identifies a potential bearish retracement bias toward the level. If NY opens below the Midnight Open, the indicator identifies a potential bullish retracement bias toward the level.
🔹 Using as a Profit Target
Because the Midnight Open is retraced to frequently, it serves as an ideal Take Profit (TP) target for opening range scalps. The indicator marks the exact moment a retracement occurs with a visual marker, confirming the level has been tested.
🔶 DETAILS
The statistics integrated into this tool are based on extensive backtesting of NQ futures over 6-month periods. Understanding these probabilities allows traders to filter out low-conviction setups and focus on high-probability days.
🔹 The Core Probabilities
When price opens above the midnight level, it retraces to touch it 74% of the time. When price opens below the midnight level, it retraces to touch it 63% of the time.
🔹 Weekday Variance
Not all trading days are equal. The script accounts for "By Weekday" statistics:
High Probability (Wednesdays): On Wednesdays, retracement probabilities can jump as high as 89% for opens above the midnight level. Low Probability (Mondays): Mondays often exhibit "Avoid" criteria, with retracement probabilities frequently falling below 60%.
The dashboard dynamically updates the "Probability of Retracement" based on the current day of the week, helping you stay aligned with historical data.
🔶 SETTINGS
🔹 Session Settings
Timezone Mode: Choose between Exchange time or "America/New_York" (recommended for ICT concepts). Midnight Open Time: The specific time used to set the daily baseline. NY Open Time: The time used to determine the session opening bias. NY Session Range: Defines the boundary for the New York session box.
🔹 Visual Settings
Show Midnight Level: Toggles the horizontal line representing the midnight price. Show Retrace Circle: Displays markers on the chart when the retracement goal is met. Show NY Session Box: Draws a dynamic box for the NY session that changes color based on the current price relative to the open.
🔹 Dashboard Settings
Show Insights Report: Toggles the statistics dashboard on the chart. Position/Size: Controls the UI placement and scale of the data table.

Market Structure Oscillator [LuxAlgo]The Market Structure Oscillator indicator analyzes and synthesizes short-term, intermediate-term, and long-term market structure shifts and breaks, visualizing the output as oscillators and graphical representations of real-time market structures on the main price chart.
The oscillator presentation of the detected market structures helps traders visualize trend momentum and strength, identifying potential trend reversals, and providing different perspectives to enhance the analysis of classic market structures.
🔶 USAGE
A market structure shift signals a potential change in market sentiment or direction, while a break of structure indicates a continuation of the current trend. Detecting these events in real-time helps traders recognize both trend changes and continuations. The market structure oscillator translates these concepts visually, offering deeper insights into market momentum and strength. It aids traders in identifying overbought or oversold conditions, potential trend reversals, and confirming trend direction.
Oscillators often generate signals based on crossing certain thresholds or diverging from price movements, providing cues for traders to enter or exit positions.
The weights determine the influence of each period (short-term, intermediate-term, long-term) on the final oscillator value. By changing the weights, traders can emphasize or de-emphasize the importance of each period. Higher weights increase their respective market structure's influence on the oscillator value. For example, if the weight for the short-term period is set to 0, the final value of the oscillator will be calculated using only the intermediate-term and long-term market structures.
The indicator features a Cycle Oscillator component, which uses the market structure oscillator values to generate a histogram and provide further insights into market cycles and potential signals. The Cycle Oscillator aids in timing by allowing traders to more easily see the median length of an oscillation around the average point, helping them identify both favorable prices and favorable moments for trading.
Users can also display detected market structures on the price chart by enabling the corresponding market structure toggle from the "Market Structures on Chart" settings group.
🔶 DETAILS
The script initiates its analysis by detecting swing levels, which form the fundamental basis for its operations. It begins by identifying short-term swing points, automatically detected solely based on market movements without any reliance on user-defined input. Short-Term Swing Highs (STH) are peaks in price surrounded by lower highs on both sides, while Short-Term Swing Lows (STL) are troughs surrounded by higher lows.
To identify intermediate-term and long-term swing points, the script uses previously detected short-term swing points as reference points. It examines these points to determine intermediate-term swings and further analyzes intermediate-term swings to identify long-term swing points. This method ensures a thorough and unbiased evaluation of market dynamics, providing traders with reliable insights into market structures.
Once swing levels are detected, the process continues with the analysis of Market Structure Shifts (MSS) and Breaks of Structure (BoS). A Market Structure Shift, also known as a Change of Character (CHoCH), is a critical event in price action analysis that suggests a potential shift in market sentiment or direction. It occurs when the price reverses from an established trend, indicating that the current trend may be losing momentum and a reversal could be imminent.
On the other hand, a Break of Structure signifies the continuation of the existing market trend. This event occurs when the price decisively moves beyond a previous swing high or low, confirming the strength and persistence of the prevailing trend.
The indicator analyzes price patterns using a pure price action approach and identifies market structures for short-term, intermediate-term, and long-term periods. The collected data is then normalized and combined using specified weights to calculate the final Market Structure Oscillator value.
🔶 SETTINGS
The indicator incorporates user-defined settings, allowing users to tailor it according to their preferences and trading strategies.
🔹 Market Structure Oscillator
Market Structure Oscillator: Toggles the visibility of the market structures oscillator.
Short Term Weight: Defines the weight for the short-term market structure.
Intermediate Term Weight: Defines the weight for the intermediate-term market structure.
Long Term Weight: Defines the weight for the long-term market structure.
Oscillator Smoothing: Determines the smoothing factor for the oscillator.
Gradient Colors: Allows customization of bullish and bearish gradient colors.
Market Structure Oscillator Crosses: Provides signals based on market structure oscillator equilibrium level crosses.
🔹 Cycle Oscillator
Cycle Oscillator - Histogram: Toggles the visibility of the cycle oscillator.
Cycle Signal Length: Defines the length of the cycle signal.
Cycle Oscillator Crosses: Provides signals based on cycle oscillator crosses.
🔹 Market Structures on Chart
Market Structures: Allows plotting of market structures (short, intermediate, and long term) on the chart.
Line, Label, and Color: Options to display lines and labels for different market structures with customizable colors.
🔹 Oscillator Components
Oscillators: Separately plots short-term, intermediate-term, and long-term oscillators. Provides options to display these oscillators with customizable colors.
🔶 RELATED SCRIPTS
Market-Structures-(Intrabar)
