E9 MACD
The E9 MACD (Moving Average Convergence Divergence) indicator is a powerful tool used in technical analysis to help traders identify potential buy and sell signals based on price action. It is designed to provide clear visual cues and alerts for trading decisions. Here’s how it applies to price action and its key functionalities:
Key Features and Functionality
MACD Line and Signal Line:
MACD Line: Represents the difference between a fast and a slow moving average of the price. It helps in identifying the momentum of the price movement.
Signal Line: A smoothed average of the MACD Line, used to generate trading signals when the MACD Line crosses above or below it.
Histogram: The histogram shows the difference between the MACD Line and the Signal Line. It visually represents the strength of the trend, with positive values indicating bullish momentum and negative values indicating bearish momentum.
Trend Coloring:
Uptrend: When the MACD Line is above the Signal Line, the bars can be colored green to indicate a potential buying opportunity.
Downtrend: When the MACD Line is below the Signal Line, the bars can be colored red to signal a potential selling opportunity.
Timeframe Flexibility:
The E9 MACD can be adjusted to different timeframes, allowing traders to analyze short-term or long-term trends based on their trading strategy. This flexibility helps in tailoring the indicator’s analysis to different market conditions.
Visual Alerts and Highlights:
The indicator includes options to highlight price bars and background colors when significant crossovers occur, making it easier to spot key trading signals.
Circles can be plotted on the MACD Line to indicate cross events, enhancing visual clarity.
Customizable Appearance:
Traders can customize the appearance of the MACD Line, Signal Line, and Histogram, including color and line width, to suit their personal preferences and improve readability.
Alerts for Trading Signals:
The E9 MACD can generate alerts for crossovers of the MACD Line and Signal Line, helping traders stay informed of potential trading opportunities even when they are not actively monitoring the charts.
Application in Trading
The E9 MACD is particularly useful for:
Identifying potential entry and exit points based on the crossing of the MACD Line and Signal Line.
Gauging the strength of the current trend through the histogram.
Adjusting to different timeframes to align the indicator with various trading strategies, from day trading to long-term investing.
By providing clear visual indicators and alerts, the E9 MACD helps traders make more informed decisions and better understand the momentum and direction of price movements.
Cari dalam skrip untuk "macd"

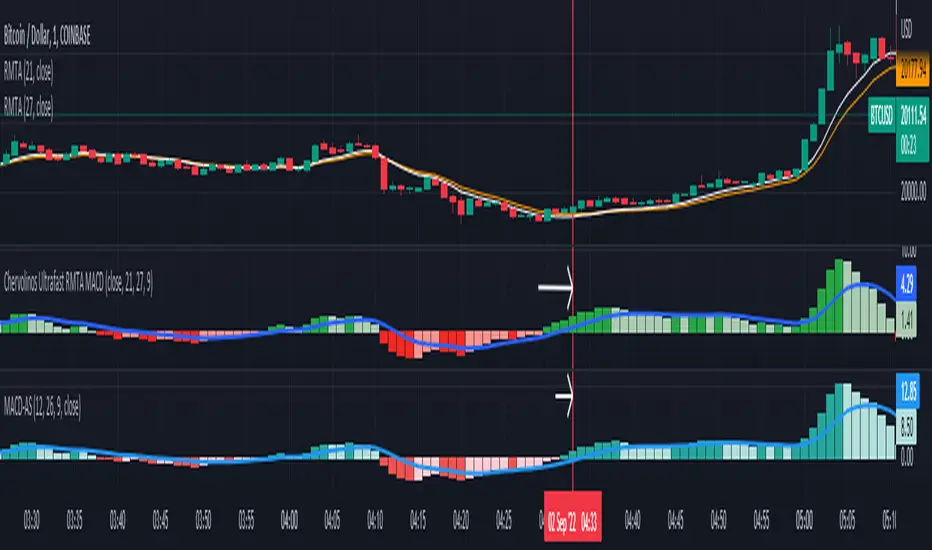
Chervolinos Ultrafast RMTA MACDDescription of a classic MACD:
MACD, short for moving average convergence/divergence, is a trading indicator used in technical analysis of stock prices, created by Gerald Appel in the late 1970s. It is designed to reveal changes in the strength, direction, momentum, and duration of a trend in a stock's price. The MACD indicator (or "oscillator") is a collection of three time series calculated from historical price data, most often the closing price. These three series are: the MACD series proper, the "signal" or "average" series, and the "divergence" series which is the difference between the two. The MACD series is the difference between a "fast" (short period) exponential moving average (EMA), and a "slow" (longer period) EMA of the price series. The average series is an EMA of the MACD series itself. The MACD indicator thus depends on three time parameters, namely the time constants of the three EMAs. The notation "MACD" usually denotes the indicator where the MACD series is the difference of EMAs with characteristic times a and b, and the average series is an EMA of the MACD series with characteristic time c. These parameters are usually measured in days. The most commonly used values are 12, 26, and 9 days, that is, MACD. As true with most of the technical indicators, MACD also finds its period settings from the old days when technical analysis used to be mainly based on the daily charts. The reason was the lack of the modern trading platforms which show the changing prices every moment. As the working week used to be 6-days, the period settings of represent 2 weeks, 1 month and one and a half week. Now when the trading weeks have only 5 days, possibilities of changing the period settings cannot be overruled. However, it is always better to stick to the period settings which are used by the majority of traders as the buying and selling decisions based on the standard settings further push the prices in that direction.
Description of the new Ultrafast RMTA MACD:
Ultrafast RMTA MACD, short for moving average convergence/divergence, is a trading indicator used in technical analysis of stock prices, created by Chervolino. It is designed to reveal changes in the strength,
direction, momentum, and duration of a trend in a stock's price. The RMTA MACD indicator (or "oscillator") is a collection of three time series calculated from historical price data, from the closing price.
The RMTA MACD based on the THE RECURSIVE MOVING TRENDLINE SYSTEM technical.traders.com
and is series is the difference between a "fast" (short period) Recursive Moving Trend Average, and a "slow" (longer period) Recursive Moving Trend Average of the price series. The average series is an EMA of the MACD series itself.
The result is a non laging indicator, depends on the settings.
special thanks to
everget
LonesomeTheBlue
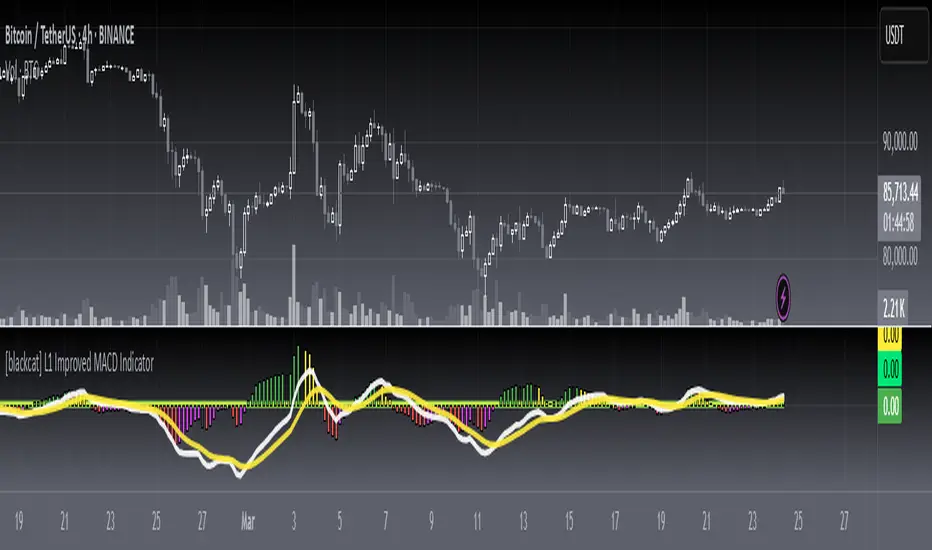
[blackcat] L1 Improved MACD IndicatorLevel: 1
Background
The MACD is a superior derivative of moving average crossovers and was developed by Gerald Appel in 1979 as a market timing tool. MACD uses two exponential moving averages with different bar periods, which are then subtracted to form what Mr. Appel calls the Fast Line. A 9-period moving average of the fast line creates the slow line.
Function
L1 Improved MACD Indicator mainly improves MACD histogram by customized an algorithm and add three levels of long entry alerts derived from ema().
Key Signal
buy1 --> the 1st level of buy alert in green
buy2 --> the 2nd level of buy alert in lime
buy3 --> the 3rd level of buy alert in yellow
diff --> classic MACD diff fast line in white
dea --> classic MACD dea slow line in yellow
macd --> classic difference histogram,but I did not use it directly in the plot.
Pros and Cons
Pros:
1. more clear sub level trend change with new histograms
2. three levels of buy alerts
Cons:
1. need sophisticated knowledge of MACD to use this well
2. this still requires a lot of MACD experience to obtain reliable trading signals
Remarks
I am a fan of MACD. Even the most classic MACD can have in-depth usage. I think MACD is the king of indicators.
Readme
In real life, I am a prolific inventor. I have successfully applied for more than 60 international and regional patents in the past 12 years. But in the past two years or so, I have tried to transfer my creativity to the development of trading strategies. Tradingview is the ideal platform for me. I am selecting and contributing some of the hundreds of scripts to publish in Tradingview community. Welcome everyone to interact with me to discuss these interesting pine scripts.
The scripts posted are categorized into 5 levels according to my efforts or manhours put into these works.
Level 1 : interesting script snippets or distinctive improvement from classic indicators or strategy. Level 1 scripts can usually appear in more complex indicators as a function module or element.
Level 2 : composite indicator/strategy. By selecting or combining several independent or dependent functions or sub indicators in proper way, the composite script exhibits a resonance phenomenon which can filter out noise or fake trading signal to enhance trading confidence level.
Level 3 : comprehensive indicator/strategy. They are simple trading systems based on my strategies. They are commonly containing several or all of entry signal, close signal, stop loss, take profit, re-entry, risk management, and position sizing techniques. Even some interesting fundamental and mass psychological aspects are incorporated.
Level 4 : script snippets or functions that do not disclose source code. Interesting element that can reveal market laws and work as raw material for indicators and strategies. If you find Level 1~2 scripts are helpful, Level 4 is a private version that took me far more efforts to develop.
Level 5 : indicator/strategy that do not disclose source code. private version of Level 3 script with my accumulated script processing skills or a large number of custom functions. I had a private function library built in past two years. Level 5 scripts use many of them to achieve private trading strategy.
MestreDoFOMO MACD VisualMasterDoFOMO MACD Visual
Description
MasterDoFOMO MACD Visual is a custom indicator that combines a unique approach to MACD with stochastic logic and simulated Renko-based direction signals. It is designed to help traders identify entry and exit opportunities based on market momentum and trend changes, with a clear and intuitive visualization.
How It Works
Stylized MACD with Stochastic: The indicator calculates the MACD using EMAs (exponential moving averages) normalized by stochastic logic. This is done by subtracting the lowest price (lowest low) from a defined period and dividing by the range between the highest and lowest price (highest high - lowest low). The result is a MACD that is more sensitive to market conditions, magnified by a factor of 10 for better visualization.
Signal Line: An EMA of the MACD is plotted as a signal line, allowing you to identify crossovers that indicate potential trend reversals or continuations.
Histogram: The difference between the MACD and the signal line is displayed as a histogram, with distinct colors (fuchsia for positive, purple for negative) to make momentum easier to read.
Simulated Renko Direction: Uses ATR (Average True Range) to calculate the size of Renko "bricks", generating signals of change in direction (bullish or bearish). These signals are displayed as arrows on the chart, helping to identify trend reversals.
Purpose
The indicator combines the sensitivity of the Stochastic MACD with the robustness of Renko signals to provide a versatile tool. It is ideal for traders looking to capture momentum-based market movements (using the MACD and histogram) while confirming trend changes with Renko signals. This combination reduces false signals and improves accuracy in volatile markets.
Settings
Stochastic Period (45): Sets the period for calculating the Stochastic range (highest high - lowest low).
Fast EMA Period (12): Period of the fast EMA used in the MACD.
Slow EMA Period (26): Period of the slow EMA used in the MACD.
Signal Line Period (9): Period of the EMA of the signal line.
Overbought/Oversold Levels (1.0/-1.0): Thresholds for identifying extreme conditions in the MACD.
ATR Period (14): Period for calculating the Renko brick size.
ATR Multiplier (1.0): Adjusts the Renko brick size.
Show Histogram: Enables/disables the histogram.
Show Renko Markers: Enables/disables the Renko direction arrows.
How to Use
MACD Crossovers: A MACD crossover above the signal line indicates potential bullishness, while below suggests bearishness.
Histogram: Fuchsia bars indicate bullish momentum; purple bars indicate bearish momentum.
Renko Arrows: Green arrows (upward triangle) signal a change to an uptrend; red arrows (downward triangle) signal a downtrend.
Overbought/Oversold Levels: Use the levels to identify potential reversals when the MACD reaches extreme values.
Notes
The chart should be set up with this indicator in isolation for better clarity.
Adjust the periods and ATR multiplier according to the asset and timeframe used.
Use the built-in alerts ("Renko Up Signal" and "Renko Down Signal") to set up notifications of direction changes.
This indicator is ideal for day traders and swing traders who want a visually clear and functional tool for trading based on momentum and trends.

Jurik MacD & Leader NCMhey everyone,
While there are some Invite-Only Jurik MacDs, there are no free/open ones, so I thought I'd create one and publish it. It has most of the bells and whistles you'd want (I hope!).
You can see one with the bells and whistles all turned on in the first, and a 'quieter' one in the second.
//-----------------////-----------------////-----------------//
Why Jurik?
The Jurik MA is a quicker and smoother Exponential MA, and the best of all MAs, according to Jurik Research (lol). To be fair. I have found it to be excellent, and that is why I'm publishing this.
Power can be changed, recommended from 1-4: increasing it pulls it closer to the current price (almost like reducing the period), and decreasing: vice versa.
Phase increases the inertia of the line, how quickly it will respect price changes. It is usual to have less inertia on the fast JMA, and more on the slower (but remember the MACD line is the FastJMA minus the SlowJMA, so you may find adjusting power and phase on Signal line more effective). Search online for JurikRes (or Jurik Research) for more detailed information about the Jurik.
In the coding I have included a list of four different ways to set up the JMAs: however, you should probably tune this to your preferred asset (as with almost all indicators). If you find a good setup, please let me know!
You could trade with a MacD a number of ways. Entries could be:
- MacD crossing the zero line
- MacD crossing over the Signal line
- Histogram crossing above zero line.
Vice versa for exits. If this isn't enough, please google 'trading with a MacD'.
No indicator is perfect for trading, and that includes this one! Don't trade unless you know what you're doing.
//-----------------////-----------------////-----------------//
Please let me know if I can improve this script, or you have any other feedback. I can post code for colour palette as well if that is something anyone is keen on.
//-----------------////-----------------////-----------------//
Thanks to the many excellent coders that publish freely their code. I have learned so much from this community, and this code is based on the work of others (Chris Moody and everget).
Shout out to StevieMagg as well, who has helped me develop (and didn't want to charge me!). The Pine Script Community on Discord has been brilliant - lots of knowledge, ideas, support - thanks guys.
If you are new and interested in pine coding, I suggest you check out some of the masters (in no order):
ChrisMoody
Everget
RedKTrader
LonesomeDove
LazyBear
KivancOzbilgic
and more that I am missing. It is not necessarily the popular scripts that are the best.
//-----------------////-----------------////-----------------//
Kind regards,
Nelson

MB-MACD## Description
**MB-MACD** is a custom Pine Script indicator designed to enhance momentum analysis by combining a volume-based "Main Buy Ratio" (MB) calculation with a traditional MACD oscillator. The MB Ratio estimates institutional buying pressure by apportioning volume based on the candle's range and close position, providing a unique proxy for "smart money" flow. This smoothed MB value is then used as the source for MACD computation, allowing for divergence detection between price action, the MB line, and the MACD Histogram.
Key features include:
- **MB Line**: A histogram-style plot showing smoothed buy/sell ratio, colored bullishly (teal) or bearishly (pink) based on direction.
- **MACD Histogram**: Standard MACD applied to the MB source, with optional smoothing.
- **Divergence Detection**: Identifies bullish and bearish divergences on both the MB line and MACD Histogram, with configurable filters for momentum decay and zero-line alignment.
- **Visualization Options**: Display divergence lines and labels in the indicator pane or synced as an overlay on the main chart for better context.
- **Alerts**: Triggers for bullish or bearish divergences to notify users of potential reversal setups.
This indicator is particularly useful for swing traders and momentum followers looking to spot hidden divergences that may signal trend reversals or continuations. It emphasizes risk management by highlighting where price and momentum decouple, but remember: divergences are probabilistic signals and should be confirmed with other tools.
As this is a community-shared script, I encourage users to test it thoroughly and provide feedback. If you spot any bugs, calculation errors, or improvements (e.g., edge cases with low-volume symbols or performance issues on certain timeframes), please comment below or reach out—your input helps refine it for everyone!
## User Manual
### Introduction
The **MB-MACD** indicator integrates volume analysis with MACD to detect divergences in price and momentum. The core innovation is the "Main Buy Ratio" (MB), which approximates buying vs. selling volume within each bar based on its range and close position. This MB value is smoothed and fed into a MACD calculation, enabling divergence scans on both the MB line and the resulting MACD Histogram.
Divergences occur when price makes higher highs/lower lows, but the oscillator (MB or Histogram) fails to confirm—often signaling potential reversals. The script offers flexible display options, filters to reduce false positives, and alerts for real-time notifications.
**Important Notes:**
- This is not financial advice; use it for educational purposes and backtest on your symbols/timeframes.
- Works best on liquid stocks or indices with reliable volume data (e.g., daily or higher timeframes).
- Performance may vary on low-volume assets or during after-hours trading.
- If you encounter issues (e.g., no divergences detected or rendering errors), check your chart settings and report them in the comments for community debugging.
### Inputs Explanation
The inputs are grouped for ease of configuration. Adjust them via the indicator's settings panel in TradingView.
#### Core Parameters
- **Show MB Line** (Default: True): Enables/disables the MB Ratio histogram plot.
- **Show MACD Histogram** (Default: True): Enables/disables the MACD line and histogram plots.
- **MB Smoothing (SMA)** (Default: 10, Min: 1): Length for smoothing the raw MB Ratio using a Simple Moving Average (SMA). Higher values reduce noise but may lag.
- **Pivot Lookback Length** (Default: 5, Min: 2): Bars to look back/forward for detecting price pivots (highs/lows) used in divergence logic.
- **Max Lines Kept** (Default: 100, Min: 10): Limits the number of divergence lines/labels to prevent chart clutter.
#### Display Settings
- **Show Lines (Indicator Pane)** (Default: True): Draws divergence lines on the MB line in the indicator pane.
- **Show Labels (Indicator Pane)** (Default: True): Adds labels (e.g., "L" for line divergence) at divergence points in the pane.
- **Show Hist Divergence Lines** (Default: True): Draws dashed lines for MACD Histogram divergences in the pane.
- **Show Hist Divergence Labels** (Default: True): Adds labels (e.g., "H" for histogram divergence) in the pane.
- **Sync Lines to Main Chart (Overlay)** (Default: True): Mirrors divergence lines and labels onto the main price chart for context (slightly offset for visibility).
#### Filters & Tolerance
- **Peak Alignment Tolerance (Bars)** (Default: 5, Min: 0): Allows flexibility in matching oscillator peaks/valleys to price pivots (e.g., within ±5 bars).
- **Max Divergence Distance (Bars)** (Default: 20, Min: 5): Maximum bars between two pivots for a valid divergence; prevents detecting overly distant signals.
- **Enable Momentum Decay Filter** (Default: True): For Histogram divergences, requires the current peak/valley to have a smaller absolute value than the previous (indicating convergence/decay).
- **Enable Zero-Side Filter** (Default: False): Ensures both peaks/valleys in a divergence are on the same side of the zero line (e.g., both positive or both negative).
#### MACD Settings
- **MACD Fast Length** (Default: 12): Fast EMA length for MACD.
- **MACD Slow Length** (Default: 26): Slow EMA length for MACD.
- **MACD Signal Length** (Default: 9): Smoothing length for the MACD signal line.
- **MACD Source Smoothing** (Default: 3, Min: 1): Additional SMA smoothing applied to the MB Ratio before MACD calculation.
### How It Works
1. **MB Ratio Calculation**: For each bar, the script computes the position of the close within the high-low range (0-1). This scales the volume into "buy" and "sell" portions, then derives a net ratio (-100% to +100%). It's smoothed via SMA for the final MB line.
2. **MACD Application**: The (optionally smoothed) raw MB is used as the MACD source, producing a MACD line, signal line, and histogram.
3. **Pivot Detection**: Uses Pine's `ta.pivothigh`/`ta.pivotlow` to find price highs/lows over the lookback period.
4. **Divergence Scanning**:
- **Bearish (on Highs)**: Price makes a higher high, but MB/Hist makes a lower high.
- **Bullish (on Lows)**: Price makes a lower low, but MB/Hist makes a higher low (closer to zero).
- Scans nearby bars for oscillator matches and applies filters.
5. **Rendering**: Lines/labels are drawn in the indicator pane or overlaid on the chart. Colors: Teal for bullish, Pink/Maroon for bearish.
6. **Cleanup**: Automatically removes old lines/labels to stay under the max limit.
### Interpreting the Outputs
- **MB Line (Columns)**: Positive (teal) indicates net buying pressure; negative (pink) shows selling. Watch for crossovers above/below zero as momentum shifts.
- **MACD Histogram (Area)**: Green/teal for positive momentum; red/maroon for negative. Widening bars suggest strengthening trends; narrowing indicates weakening.
- **Divergence Lines/Labels**:
- Solid lines: MB line divergences (thicker, labeled "L").
- Dashed lines: Histogram divergences (thinner, labeled "H").
- Bullish: Teal lines sloping up (potential bottom reversal).
- Bearish: Pink lines sloping down (potential top reversal).
- **Overlay on Chart**: Lines connect price pivots (or offset slightly for Histogram). Use this to visualize how divergences align with candlesticks.
- **Zero Line**: Gray horizontal line; divergences filtered by side if enabled.
**Example Usage**:
- On a daily stock chart, enable overlays and watch for a bullish "L" or "H" label near a price low—could signal a buy if confirmed by volume breakout.
- In a downtrend, bearish divergences on highs might warn of further downside.
### Alerts
- **Bullish Divergence (L or H)**: Triggers on any detected bullish divergence (MB or Histogram).
- **Bearish Divergence (L or H)**: Triggers on bearish divergences.
- Set up via TradingView's alert menu: Select the indicator, choose the condition, and customize the message (e.g., includes ticker).
### Troubleshooting / Known Issues
- **No Divergences Shown**: Increase "Peak Alignment Tolerance" or reduce filters. Ensure pivot length suits your timeframe (shorter for intraday).
- **Too Many Lines/Labels**: Lower "Max Lines Kept" or increase "Max Divergence Distance" to filter distant signals.
- **Performance on Low-Volume Symbols**: MB Ratio may be unreliable; test on high-volume assets first.
- **Rendering Errors**: If lines don't appear, check chart zoom or ensure "force_overlay=true" isn't conflicting with other indicators.
- **NaN/Undefined Values**: Rare on live data but possible in historical backtests; report with symbol/timeframe for fixes.
### Feedback and Contributions
This script is open for community improvement! If you find bugs (e.g., false positives in divergences, calculation edge cases, or UI glitches), or have suggestions (like additional filters or visualizations), please share in the comments. Your feedback helps make it better—let's debug and enhance it together!

ChronoPulse MS-MACD Resonance StrategyChronoPulse MS-MACD Resonance Strategy
A systematic trading strategy that combines higher-timeframe market structure analysis with dual MACD momentum confirmation, ATR-based risk management, and real-time quality assurance monitoring.
Core Principles
The strategy operates on the principle of multi-timeframe confluence, requiring agreement between:
Market structure breaks (CHOCH/BOS) on a higher timeframe
Dual MACD momentum confirmation (classic and crypto-tuned profiles)
Trend alignment via directional EMAs
Volatility and volume filters
Quality score composite threshold
Strategy Components
Market Structure Engine : Detects Break of Structure (BOS) and Change of Character (CHOCH) events using confirmed pivots on a configurable higher timeframe. Default structure timeframe is 240 minutes (4H).
Dual MACD Fusion : Requires agreement between two MACD configurations:
Classic MACD: 12/26/9 (default)
Fusion MACD: 8/21/5 (default, optimized for crypto volatility)
Both must agree on direction before trade execution. This can be disabled to use single MACD confirmation.
Trend Alignment : Uses two EMAs for directional bias:
Directional EMA: 55 periods (default)
Execution Trend Guide: 34 periods (default)
Both must align with trade direction.
ATR Risk Management : All risk parameters are expressed in ATR multiples:
Stop Loss: 1.5 × ATR (default)
Take Profit: 3.0 × ATR (default)
Trail Activation: 1.0 × ATR profit required (default)
Trail Distance: 1.5 × ATR behind price (default)
Volume Surge Filter : Optional gate requiring current volume to exceed a multiple of the volume SMA. Default threshold is 1.4× the 20-period volume SMA.
Quality Score Gate : Composite score (0-1) combining:
Structure alignment (0.0-1.0)
Momentum strength (0.0-1.0)
Trend alignment (0.0-1.0)
ATR volatility score (0.0-1.0)
Volume intensity (0.0-1.0)
Default threshold: 0.62. Trades only execute when quality score exceeds this threshold.
Execution Discipline : Trade budgeting system:
Maximum trades per session: 6 (default)
Cooldown bars between entries: 5 (default)
Quality Assurance Console : Real-time monitoring panel displaying:
Structure status (pass/fail)
Momentum confirmation (pass/fail)
Volatility readiness (pass/fail)
Quality score (pass/fail)
Discipline compliance (pass/fail)
Performance metrics (win rate, profit factor)
Net PnL
Certification requires: Win Rate ≥ 40%, Profit Factor ≥ 1.4, Minimum 25 closed trades, and positive net profit.
Integrity Suite : Optional validation panel that audits:
Configuration sanity checks
ATR data readiness
EMA hierarchy validity
Performance realism checks
Strategy Settings
strategy(
title="ChronoPulse MS-MACD Resonance Strategy",
shorttitle="ChronPulse",
overlay=true,
max_labels_count=500,
max_lines_count=500,
initial_capital=100000,
currency=currency.USD,
pyramiding=0,
commission_type=strategy.commission.percent,
commission_value=0.015,
slippage=2,
default_qty_type=strategy.percent_of_equity,
default_qty_value=2.0,
calc_on_order_fills=true,
calc_on_every_tick=true,
process_orders_on_close=true
)
Key Input Parameters
Structure Timeframe : 240 (4H) - Higher timeframe for structure analysis
Structure Pivot Left/Right : 3/3 - Pivot confirmation periods
Structure Break Buffer : 0.15% - Buffer for structure break confirmation
MACD Fast/Slow/Signal : 12/26/9 - Classic MACD parameters
Fusion MACD Fast/Slow/Signal : 8/21/5 - Crypto-tuned MACD parameters
Directional EMA Length : 55 - Primary trend filter
Execution Trend Guide : 34 - Secondary trend filter
ATR Length : 14 - ATR calculation period
ATR Stop Multiplier : 1.5 - Stop loss in ATR units
ATR Target Multiplier : 3.0 - Take profit in ATR units
Trail Activation : 1.0 ATR - Profit required before trailing
Trail Distance : 1.5 ATR - Distance behind price
Volume Threshold : 1.4× - Volume surge multiplier
Quality Threshold : 0.62 - Minimum quality score (0-1)
Max Trades Per Session : 6 - Daily trade limit
Cooldown Bars : 5 - Bars between entries
Win-Rate Target : 40% - Minimum for QA certification
Profit Factor Target : 1.4 - Minimum for QA certification
Minimum Trades for QA : 25 - Required closed trades
Signal Generation Logic
A trade signal is generated when ALL of the following conditions are met:
Higher timeframe structure shows bullish (CHOCH/BOS) or bearish structure break
Both MACD profiles agree on direction (if fusion enabled)
Price is above both EMAs for longs (below for shorts)
ATR data is ready and above minimum threshold
Volume exceeds threshold × SMA (if volume gate enabled)
Quality score ≥ quality threshold
Trade budget available (under max trades per day)
Cooldown period satisfied
Risk Management
Stop loss and take profit are set immediately on entry
Trailing stop activates after 1.0 ATR of profit
Trailing stop maintains 1.5 ATR distance behind highest profit point
Position sizing uses 2% of equity per trade (default)
No pyramiding (single position per direction)
Limitations and Considerations
The strategy requires sufficient historical data for higher timeframe structure analysis
Quality gate may filter out many potential trades, reducing trade frequency
Performance metrics are based on historical backtesting and do not guarantee future results
Commission and slippage assumptions (0.015% + 2 ticks) may vary by broker
The strategy is optimized for trending markets with clear structure breaks
Choppy or ranging markets may produce false signals
Crypto markets may require different parameter tuning than traditional assets
Optimization Notes
The strategy includes several parameters that can be tuned for different market conditions:
Quality Threshold : Lower values (0.50-0.60) allow more trades but may reduce average quality. Higher values (0.70+) are more selective but may miss opportunities.
Structure Timeframe : Use 240 (4H) for intraday trading, Daily for swing trading, Weekly for position trading
Volume Gate : Disable for low-liquidity pairs or when volume data is unreliable
Dual MACD Fusion : Disable for mean-reverting markets where single MACD may be more responsive
Trade Discipline : Adjust max trades and cooldown based on your risk tolerance and market volatility
Non-Repainting Guarantee
All higher timeframe data requests use lookahead=barmerge.lookahead_off to prevent repainting. Pivot detection waits for full confirmation before registering structure breaks. All visual elements (tables, labels) update only on closed bars.
Alerts
Three alert conditions are available:
ChronoPulse Long Setup : Fires when all long entry conditions are met
ChronoPulse Short Setup : Fires when all short entry conditions are met
ChronoPulse QA Certification : Fires when Quality Assurance console reaches CERTIFIED status
Configure alerts with "Once Per Bar Close" delivery to match the non-repainting design.
Visual Elements
Structure Labels : CHOCH↑, CHOCH↓, BOS↑, BOS↓ markers on structure breaks
Directional EMA : Orange line showing trend bias
Trailing Stop Lines : Green (long) and red (short) trailing stop levels
Dashboard Panel : Real-time status display (structure, MACD, ATR, quality, PnL)
QA Console : Quality assurance monitoring panel
Integrity Suite Panel : Optional validation status display
Recommended Usage
Forward test with paper trading before live deployment
Monitor the QA console until it reaches CERTIFIED status
Adjust parameters based on your specific market and timeframe
Respect the trade discipline limits to avoid over-trading
Review quality scores and adjust threshold if needed
Use appropriate commission and slippage settings for your broker
Technical Implementation
The strategy uses Pine Script v6 with the following key features:
Multi-timeframe data requests with lookahead protection
Confirmed pivot detection for structure analysis
Dynamic trailing stop management
Real-time quality score calculation
Trade budgeting and cooldown enforcement
Comprehensive dashboard and monitoring panels
All source code is open and available for review and modification.
Disclaimer
This script is for educational and informational purposes only. It is not intended as financial, investment, or trading advice. Past performance does not guarantee future results. Trading involves substantial risk of loss and is not suitable for all investors. Always conduct your own research and consult with a qualified financial advisor before making any trading decisions. The author and TradingView are not responsible for any losses incurred from using this strategy.

Confirmed Pivots + MACD Signals (with BOS Lines)Confirmed Pivots + MACD Signals
This indicator combines confirmed swing highs/lows (pivots) with MACD-based momentum signals to highlight key reversal and continuation points on the chart.
Core Logic
Confirmed Pivots:
The script identifies swing highs and lows using the user-defined pivot confirmation length.
Once a structure is broken beyond the last pivot, that level becomes a confirmed support (CL) or resistance (CH) line.
These levels are plotted as dashed horizontal rays and labeled directly on the chart.
MACD Integration:
The classic MACD crossover/under logic is used:
Bullish Crossover: MACD line crosses above the Signal line.
Bearish Crossunder: MACD line crosses below the Signal line.
Signal Filtering by Proximity:
A Proximity Zone (%) defines how close price must be to an active support or resistance to trigger a signal.
Buy Signal: When price is within the support zone and a bullish MACD crossover occurs.
Sell Signal: When price is within the resistance zone and a bearish MACD crossunder occurs.
Inputs
Pivot Confirmation Length: Bars used to confirm swing points.
MACD Fast/Slow/Signal Lengths: Standard MACD settings.
Proximity Zone (%): Defines zone width (e.g., 1% around active level).
Output
Labels: "CH" (Confirmed High) and "CL" (Confirmed Low) with color-coded dashed lines.
Signals: "BUY" and "SELL" markers appear when both pivot and MACD conditions align.
Tips
Works best on higher timeframes (H1 and above).
Combine with price action or trend filters for confirmation.
Use proximity percentage according to volatility (e.g., smaller % for low-vol assets).
⚠️ Disclaimer:
This script is provided for educational and informational purposes only.
It does not constitute financial or investment advice, and the author is not responsible for any financial losses that may occur from its use.
Always perform your own analysis and use this indicator together with other technical and risk management tools before making trading decisions.
---------------------------------------------------------------------------------------------
سقف و کف تاییدشده + سیگنالهای MACD
این اندیکاتور ترکیبی از شناسایی سقفها و کفهای تاییدشده (Pivot High/Low) به همراه سیگنالهای مومنتوم MACD است که نقاط برگشت یا ادامهی روند را روی چارت مشخص میکند.
🔹 منطق عملکرد
تایید سقف و کفها:
ابتدا سقف و کفهای محلی بر اساس تعداد کندلهای تنظیمشده شناسایی میشوند.
وقتی ساختار قیمتی از آخرین سقف یا کف عبور کند، آن سطح به عنوان حمایت یا مقاومت تاییدشده در نظر گرفته شده و با برچسبهای “CL” (کف تاییدشده) و “CH” (سقف تاییدشده) و خطوط نقطهچین رسم میشود.
ادغام با MACD:
از منطق کلاسیک کراساور/کراسآندر MACD استفاده شده است:
کراس صعودی: عبور خط MACD از بالای خط سیگنال.
کراس نزولی: عبور خط MACD از زیر خط سیگنال.
فیلتر سیگنال با ناحیه مجاور:
با استفاده از درصد ناحیه مجاور (Proximity Zone %)، فقط زمانی سیگنال صادر میشود که قیمت نزدیک حمایت یا مقاومت فعال باشد.
سیگنال خرید: وقتی قیمت در ناحیهی حمایت و همزمان MACD صعودی شود.
سیگنال فروش: وقتی قیمت در ناحیهی مقاومت و همزمان MACD نزولی شود.
تنظیمات ورودی
طول تأیید پیوتها
تنظیمات MACD (Fast, Slow, Signal)
درصد ناحیه مجاور برای فعال شدن سیگنالها
خروجیها
برچسبهای “CL” و “CH” برای سطوح تاییدشده
نشانگرهای “BUY” و “SELL” در محل صدور سیگنال
نکات کاربردی
بهترین عملکرد در تایمفریمهای بالاتر (۱ ساعته به بالا)
برای دقت بیشتر، آن را با فیلتر روند یا پرایساکشن ترکیب کنید
درصد ناحیه مجاور را با توجه به نوسانات دارایی تنظیم کنید

Multi-Timeframe MACD Strategy ver 1.0Multi-Timeframe MACD Strategy: Enhanced Trend Trading with Customizable Entry and Trailing Stop
This strategy utilizes the Moving Average Convergence Divergence (MACD) indicator across multiple timeframes to identify strong trends, generate precise entry and exit signals, and manage risk with an optional trailing stop loss. By combining the insights of both the current chart's timeframe and a user-defined higher timeframe, this strategy aims to improve trade accuracy, reduce exposure to false signals, and capture larger market moves.
Key Features:
Dual Timeframe Analysis: Calculates and analyzes the MACD on both the current chart's timeframe and a user-selected higher timeframe (e.g., Daily MACD on a 1-hour chart). This provides a broader market context, helping to confirm trends and filter out short-term noise.
Configurable MACD: Fine-tune the MACD calculation with adjustable Fast Length, Slow Length, and Signal Length parameters. Optimize the indicator's sensitivity to match your trading style and the volatility of the asset.
Flexible Entry Options: Choose between three distinct entry types:
Crossover: Enters trades when the MACD line crosses above (long) or below (short) the Signal line.
Zero Cross: Enters trades when the MACD line crosses above (long) or below (short) the zero line.
Both: Combines both Crossover and Zero Cross signals, providing more potential entry opportunities.
Independent Timeframe Control: Display and trade based on the current timeframe MACD, the higher timeframe MACD, or both. This allows you to focus on the information most relevant to your analysis.
Optional Trailing Stop Loss: Implements a configurable trailing stop loss to protect profits and limit potential losses. The trailing stop is adjusted dynamically as the price moves in your favor, based on a user-defined percentage.
No Repainting: Employs lookahead=barmerge.lookahead_off in the request.security() function to prevent data leakage and ensure accurate backtesting and real-time signals.
Clear Visual Signals (Optional): Includes optional plotting of the MACD and Signal lines for both timeframes, with distinct colors for easy visual identification. These plots are for visual confirmation and are not required for the strategy's logic.
Suitable for Various Trading Styles: Adaptable to swing trading, day trading, and trend-following strategies across diverse markets (stocks, forex, cryptocurrencies, etc.).
Fully Customizable: All parameters are adjustable, including timeframes, MACD Settings, Entry signal type and trailing stop settings.
How it Works:
MACD Calculation: The strategy calculates the MACD (using the standard formula) for both the current chart's timeframe and the specified higher timeframe.
Trend Identification: The relationship between the MACD line, Signal line, and zero line is used to determine the current trend for each timeframe.
Entry Signals: Buy/sell signals are generated based on the selected "Entry Type":
Crossover: A long signal is generated when the MACD line crosses above the Signal line, and both timeframes are in agreement (if both are enabled). A short signal is generated when the MACD line crosses below the Signal line, and both timeframes are in agreement.
Zero Cross: A long signal is generated when the MACD line crosses above the zero line, and both timeframes agree. A short signal is generated when the MACD line crosses below the zero line and both timeframes agree.
Both: Combines Crossover and Zero Cross signals.
Trailing Stop Loss (Optional): If enabled, a trailing stop loss is set at a specified percentage below (for long positions) or above (for short positions) the entry price. The stop-loss is automatically adjusted as the price moves favorably.
Exit Signals:
Without Trailing Stop: Positions are closed when the MACD signals reverse according to the selected "Entry Type" (e.g., a long position is closed when the MACD line crosses below the Signal line if using "Crossover" entries).
With Trailing Stop: Positions are closed if the price hits the trailing stop loss.
Backtesting and Optimization: The strategy automatically backtests on the chart's historical data, allowing you to assess its performance and optimize parameters for different assets and timeframes.
Example Use Cases:
Confirming Trend Strength: A trader on a 1-hour chart sees a bullish MACD crossover on the current timeframe. They check the MTF MACD strategy and see that the Daily MACD is also bullish, confirming the strength of the uptrend.
Filtering Noise: A trader using a 15-minute chart wants to avoid false signals from short-term volatility. They use the strategy with a 4-hour higher timeframe to filter out noise and only trade in the direction of the dominant trend.
Dynamic Risk Management: A trader enters a long position and enables the trailing stop loss. As the price rises, the trailing stop is automatically adjusted upwards, protecting profits. The trade is exited either when the MACD reverses or when the price hits the trailing stop.
Disclaimer:
The MACD is a lagging indicator and can produce false signals, especially in ranging markets. This strategy is for educational and informational purposes only and should not be considered financial advice. Backtest and optimize the strategy thoroughly, combine it with other technical analysis tools, and always implement sound risk management practices before using it with real capital. Past performance is not indicative of future results. Conduct your own due diligence and consider your risk tolerance before making any trading decisions.

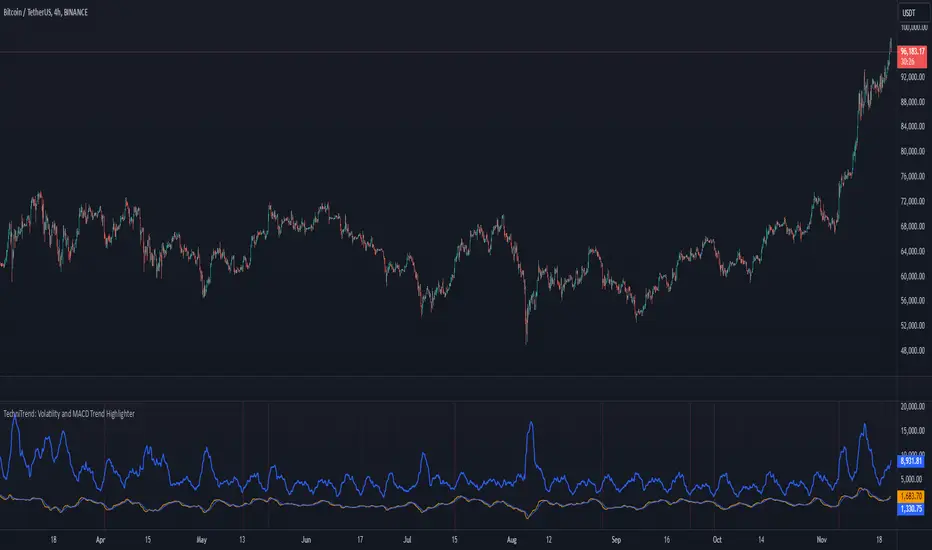
TechniTrend: Volatility and MACD Trend Highlighter🟦 Overview
The "Candle Volatility with Trend Prediction" indicator is a powerful tool designed to identify market volatility based on candle movement relative to average volume while also incorporating trend predictions using the MACD. This indicator is ideal for traders who want to detect volatile market conditions and anticipate potential price movements, leveraging both price changes and volume dynamics.
It not only highlights candles with significant price movements but also integrates a trend analysis based on the MACD (Moving Average Convergence Divergence), allowing traders to gauge whether the market momentum aligns with or diverges from the detected volatility.
🟦 Key Features
🔸Volatility Detection: Identifies candles that exceed normal price fluctuations based on average volume and recent price volatility.
🔸Trend Prediction: Uses the MACD indicator to overlay trend analysis, signaling potential market direction shifts.
🔸Volume-Based Analysis: Integrates customizable moving averages (SMA, EMA, WMA, etc.) of volume, providing a clear visualization of volume trends.
🔸Alert System: Automatically notifies traders of high-volatility situations, aiding in timely decision-making.
🔸Customizability: Includes multiple settings to tailor the indicator to different market conditions and timeframes.
🟦 How It Works
The indicator operates by evaluating the price volatility in relation to average volume and identifying when a candle's volatility surpasses a threshold defined by the user. The key calculations include:
🔸Average Volume Calculation: The user selects the type of moving average (SMA, EMA, etc.) to calculate the average volume over a set period.
🔸Volatility Measurement: The indicator measures the body change (difference between open and close) and the high-low range of each candle. It then calculates recent price volatility using a standard deviation over a user-defined length.
🔸Weighted Index: A unique index is created by dividing price change by average volume and recent volatility.
🔸Highlighting Volatility: If the weighted index exceeds a customizable threshold, the candle is highlighted, indicating potential trading opportunities.
🔸Trend Analysis with MACD: The MACD line and signal line are plotted and adjusted with a user-defined multiplier to visualize trends alongside the volatility signals.
🟦 Recommended Settings
🔸Volume MA Length: A default of 14 periods for the average volume calculation is recommended. Adjust to higher periods for long-term trends and shorter periods for quick trades.
🔸Volatility Threshold Multiplier: Set at 1.2 by default to capture moderately significant movements. Increase for fewer but stronger signals or decrease for more frequent signals.
🔸MACD Settings: Default MACD parameters (12, 26, 9) are suggested. Tweak based on your trading strategy and asset volatility.
🔸MACD Multiplier: Adjust based on how the MACD should visually compare to the average volume. A multiplier of 1 works well for most cases.
🟦 How to Use
🔸Volatile Market Detection:
Look for highlighted candles that suggest a deviation from typical price behavior. These candles often signify an entry point for short-term trades.
🔸Trend Confirmation:
Use the MACD trend analysis to verify if the highlighted volatile candles align with a bullish or bearish trend.
For example, a bullish MACD crossover combined with a highlighted candle suggests a potential uptrend, while a bearish crossover with volatility signals may indicate a downtrend.
🔸Volume-Driven Strategy:
Observe how volume changes impact candle volatility. When volume rises significantly and candles are highlighted, it can suggest strong market moves influenced by big players.
🟦 Best Use Cases
🔸Trend Reversals: Detect potential trend reversals early by spotting divergences between price and MACD within volatile conditions.
🔸Breakout Strategies: Use the indicator to confirm price breakouts with significant volume changes.
🔸Scalping or Day Trading: Customize the indicator for shorter timeframes to capture rapid market movements based on volatility spikes.
🔸Swing Trading: Combine volatility and trend insights to optimize entry and exit points over longer periods.
🟦 Customization Options
🔸Volume-Based Inputs: Choose from SMA, EMA, WMA, and more to define how average volume is calculated.
🔸Threshold Adjustments: Modify the volatility threshold multiplier to increase or decrease sensitivity based on your trading style.
🔸MACD Tuning: Adjust MACD settings and the multiplier for trend visualization tailored to different asset classes and market conditions.
🟦 Indicator Alerts
🔸High Volatility Alerts: Automatically triggered when candles exceed user-defined volatility levels.
🔸Bullish/Bearish Trend Alerts: Alerts are activated when highlighted volatile candles align with bullish or bearish MACD crossovers, making it easier to spot opportunities without constantly monitoring the chart.
🟦 Examples of Use
To better understand how this indicator works, consider the following scenarios:
🔸Example 1: In a strong uptrend, observe how volume surges and volatility highlight candles right before price consolidations, indicating optimal exit points.
🔸Example 2: During a downtrend, see how the MACD aligns with volume-driven volatility, signaling potential short-selling opportunities.
Divergence Signal [TradingFinder] RSI & MACD Reversal On Swing🔵 Introduction
Sometimes in analyzing price charts using indicators, you may observe a discrepancy. For instance, while the price of stocks, currencies, or commodities is increasing, the indicator shows a decrease. Such a phenomenon in technical analysis is termed "divergence." Divergences are categorized into three types based on their formation and the prediction they make about the continuation of the price trend: "Regular Divergence," "Hidden Divergence," and "Time Divergence."
🟣 Important :
• This indicator exclusively identifies regular divergences since its primary function is to detect reversal points.
• This indicator identifies divergences using three indicators: "Moving Average Convergence Divergence" (MACD), "Relative Strength Index" (RSI), and "Awesome Oscillator" (AO). The user can choose each of these indicators in the settings using the "Divergence Detection Method" dropdown menu for identifying divergences. These settings are by default set to the MACD mode.
🔵Types of Divergence
Divergences, as mentioned, offer different predictions about the continuation of price trends. Hence, they have various types. We will focus on explaining regular divergences based on this indicator.
🟣 Regular Divergence(RD) :
Regular divergence is a situation arising from contradictory behavior between the indicator and the price chart at the end of a trend. By identifying regular divergences, we anticipate a change in trend direction resembling a reversal pattern.
Regular divergence has two types based on the trend and prediction:
Negative Regular Divergence (RD-) :
This type occurs between two price peaks at the end of an uptrend. Despite forming a new high, the indicator fails to recognize it, indicating a negative regular divergence. The likelihood of a subsequent downtrend is high. Negative divergence suggests strong selling pressure and weak buying power, portraying an unfavorable future for the stock.
Positive Regular Divergence (RD+) :
In contrast, positive regular divergence happens at the end of a downtrend and between two price troughs. As depicted in the chart, although the price forms a new low, the indicator doesn't acknowledge it. Positive regular divergence indicates robust buying pressure and weak selling power. Upon identifying positive divergence in the chart, we expect a price increase for the stock under review
🔵 How to Use
Information from the indicator is displayed in two ways: Table and Label.
🟣 Table : The table displays information about the latest divergence. This includes the type of divergence, existence or absence of divergence, consecutive divergences, divergence quality, and change in indicator phase.
Type Divergence : Indicates the type of divergence, which can be either "Bullish Divergence" or "Bearish Divergence."
Exist : Indicates the presence of divergence with a "+" sign and absence with a "-" sign. A green color is used for bullish divergence and red for bearish divergence.
Consecutive : Shows the number of consecutive divergences. For example, if there are 3 consecutive divergences, the number 3 is displayed.
Divergence Quality : Displays the quality of the divergence based on the number of consecutive divergences. If there is 1 divergence, the quality is "Normal"; for 2 divergences, it's "Good"; and for 3 or more divergences, it's "Strong."
Change Phase Indicator : Indicates whether a phase change in the indicator has occurred with "+" for yes and "-" for no.
🟣 Label : Unlike the table, which only shows information about the latest divergence, labels display information about each divergence at the point where it occurs. The information includes the type of divergence, detection method, divergence quality, consecutive divergences, and change in phase indicator. The selected method of detection is also displayed. For example, if the chosen method is the "AO" indicator, the label will show "Method: AO."
🔵 Settings
Fractal Period : Determines the period of swings. The minimum and default value is 2.
Divergence Detect Method : Selects the indicator (MACD, RSI, or AO) used for detecting divergences. The default indicator is MACD.
Show Fractal : Chooses whether to display fractals or not. The default is "No."
Show Table : Determines whether to display the table or not. The default is "Yes."
Show Label : Chooses whether to display labels or not. The default is "Yes."
Label Size : Adjusts the size of the labels from "Tiny" to "Large."

MA + MACD alert TrendsThis is a strategy/combination of warning indicators using 6MA+MACD.
The strategy details are as follows: This is a simple warning strategy created so that we don't have to monitor the candlestick chart too often.
Note: This isn't an entry strategy; it's a signaling strategy for upcoming trends. For maximum efficiency, we should incorporate more formulas into the command. In the case below, I use Fibonacci to enter the command.
This strategy setting works for a 15-minute time frame, but it can still work for different time frames.
It has been working well with Gold and USOIL for the last two years, as well as with currency pairs like EURUSD and many others.
Components:
EMA100 + EMA200 + MA400 + MA800
MACD (timeframe greater than 1 timeframe)
Fibonacci retreat.
Uptrend alert:
Candles on both EMAs (100-200) + 2 SMAs (400-800)
In the previous 80 candles:
EMA100 cross up to EMA200
At the same time, the MACD cross up 0.
The uptrend warning will trigger when EMA6 cuts down to MA10. That's when the price creates the top and we'll wait for the market to go back to the Fibonacci threshold of 0.618 and start buying (or wait for markets to break up the trendline to buy).
Downtrend alert:
Candles are below both EMAs ( 100-200 ) + 2 SMAs ( 400-800 )
In the previous 80 candles:
EMA100 cross down to EMA200
At the same time, the MACD cross down zero.
The downtrend warning will trigger when EMA6 cuts to MA10. That's when the price creates a bottom and we'll wait for the market to go back to the Fibonacci threshold of 0.618 and start selling (or wait for the market to break down the trendline to sell).
Recommended RR: 1:1
If you have any questions please let me know!

[blackcat] L3 Faster MACDLevel 3
Background
I am seeking a way to make MACD faster
Function
By using stoch, but with MACD method, a faster MACD is made. short term faster kd is used for macd lines. long term kd is used for histogram, which can counteract the histogram grade gap caused by tradtional MACD.
Remarks
This is a Level 1 free and open source indicator.
Feedbacks are appreciated.

RSI + MACD Long-Only StrategyRSI + MACD Long-Only Strategy
Overview: Momentum-based, long-only strategy combining RSI and MACD. Entries favor upside momentum; exits trigger on momentum fades or risk targets. Signals are state-gated so you get one exit per entry (no multiple exits without a prior entry).
Entry conditions:
RSI crosses above the midline (default 50) while MACD is bullish (MACD > Signal, optionally MACD > 0), OR
MACD crosses above its Signal while RSI is at/above the midline.
Optional filters:
EMA trend filter: only enter if price > EMA(n).
Oversold context: only enter within N bars after RSI dipped below the oversold threshold.
Exit conditions:
RSI crosses below the midline, OR
MACD crosses below its Signal with MACD histogram ≤ 0.
Optional risk exit: Take Profit / Stop Loss based on percentage from average entry price.
Risk management:
Inputs: Use TP/SL (on/off), TP% (default 3.0), SL% (default 1.5).
Implements protective strategy.exit (limit/stop) while in position.
Signal-based exit uses strategy.close to flatten.
Position management:
Long-only, no pyramiding (single position at a time).
Internal state ensures entries occur only when flat and exits only when in a position.
Inputs you can tune:
RSI: length, overbought, oversold, midline.
MACD: fast length, slow length, signal length; toggle “Require MACD > 0”.
Signals: oversold lookback window; EMA trend on/off and EMA length.
Risk: TP% and SL%.
Visuals: show entry/exit markers, bar coloring; optional debug background on raw triggers.
Visuals and alerts:
Plots EMA (optional), draws entry/exit markers, optional bar coloring, and a faint background on raw long triggers to aid tuning.
Alert conditions provided for entries and exits.
Notes:
Designed for bar-close evaluation; performance varies by symbol/timeframe—tune inputs accordingly.
Long-only; intended for trend-following momentum with basic risk control.
Not financial advice.

LA - MACD EMA BandsOverview of the "LA - MACD EMA Bands" Indicator
For Better view, use this indicator along with "LA - EMA Bands with MTF Dashboard"
The "LA - MACD EMA Bands" is a custom technical indicator written in Pine Script v6 for TradingView. It builds on the traditional Moving Average Convergence Divergence (MACD) oscillator by incorporating additional smoothing via Exponential Moving Averages (EMAs) and Bollinger Bands (BB) applied directly to the MACD line. This creates a multi-layered momentum and volatility tool displayed in a separate pane below the price chart (not overlaid on the price itself).
The indicator allows for customization, such as selecting a different timeframe (for multi-timeframe analysis) and adjusting period lengths. It fetches data from the specified timeframe using request.security with lookahead enabled to avoid repainting issues. The core idea is to provide insights into momentum trends, crossovers, and volatility expansions/contractions in the MACD's behavior, making it suitable for identifying potential trend reversals, continuations, or ranging markets.
Unlike a standard MACD, which focuses primarily on momentum via a single line, signal line, and histogram, this version emphasizes longer-term smoothing and volatility boundaries. It uses visual fills between lines to highlight bullish/bearish conditions, aiding quick interpretation. Below, I'll break down each component, its calculation, visual representation, and practical uses.
Detailed Breakdown of Each Component and Its Uses
MACD Line (Blue Line, Labeled 'MACD Line')
Calculation: This is the core MACD value, computed as the difference between a fast EMA (default length 12) and a slow EMA (default length 144) of the input source (default: close price). The EMAs are calculated on data from the selected timeframe.
Visuals: Plotted as a solid blue line.
Uses:
Measures momentum: When above zero, it indicates bullish momentum (prices rising faster in the short term); below zero, bearish momentum.
Trend identification: Rising MACD suggests strengthening uptrends; falling suggests downtrends.
Divergence spotting: Compare with price action—e.g., if price makes higher highs but MACD makes lower highs, it signals potential bearish reversal (and vice versa for bullish divergence).
In trading: Often used for entry/exit signals when crossing the zero line or other lines in the indicator.
MACD EMA (Red Line, Labeled 'MACD EMA')
Calculation: A 12-period EMA applied to the MACD Line itself.
Visuals: Plotted as a solid red line.
Uses:
Acts as a signal line for the MACD, smoothing out short-term noise.
Crossover signals: When the MACD Line crosses above the MACD EMA, it can signal a bullish buy opportunity; crossing below suggests a bearish sell.
Trend confirmation: Helps filter false signals in choppy markets by requiring confirmation from this slower-moving average.
In trading: Useful for momentum-based strategies, like entering trades on crossovers in alignment with the overall trend.
Fill Between MACD Line and MACD EMA (Green/Red Shaded Area, Titled 'MACD Fill')
Calculation: The area between the MACD Line and MACD EMA is filled with color based on their relative positions.
Color Logic: Green (with 57% transparency) if MACD Line > MACD EMA (bullish); red if MACD Line < MACD EMA (bearish).
Visuals: Semi-transparent fill for easy visibility without overwhelming the lines.
Uses:
Quick visual cue for momentum shifts: Green areas highlight bullish phases; red for bearish.
Enhances readability: Makes crossovers more apparent at a glance, especially in fast-moving markets.
In trading: Can be used to time entries/exits or as a filter (e.g., only take long trades in green zones).
Bollinger Bands on MACD (BB Upper: Black Dotted, BB Basis: Maroon Dotted, BB Lower: Black Dotted)
Calculation: Bollinger Bands applied to the MACD Line.
BB Basis: 144-period EMA of the MACD Line.
BB Standard Deviation: 144-period stdev of the MACD Line.
BB Upper: BB Basis + (2.0 * BB Stdev)
BB Lower: BB Basis - (2.0 * BB Stdev)
Visuals: Upper and lower bands as black dotted lines; basis as maroon dotted
Uses:
Volatility measurement: Bands expand during high momentum volatility (strong trends) and contract during low volatility (ranging or consolidation).
Mean reversion: When MACD Line touches or exceeds the upper band, it may signal overbought conditions (potential sell); lower band for oversold (potential buy).
Squeeze detection: Narrow bands (squeeze) often precede big moves—watch for breakouts.
In trading: Combines momentum with volatility; e.g., a MACD Line breakout above the upper band could confirm a strong uptrend.
BB Basis EMA (Green Line, Labeled 'BB Basis EMA')
Calculation: A 72-period EMA applied to the BB Basis (which is already a 144-period EMA of the MACD Line).
Visuals: Solid green line.
Uses:
Further smoothing: Provides a longer-term view of the MACD's average behavior, reducing noise from the BB Basis.
Trend direction: Acts as a baseline for the BB system—above it suggests bullish bias in momentum volatility; below, bearish.
Crossover with BB Basis: Can signal shifts in volatility trends (e.g., BB Basis crossing above BB Basis EMA indicates increasing bullish volatility).
In trading: Useful for confirming longer-term trends or as a filter for BB-based signals.
Fill Between BB Basis and BB Basis EMA (Gray Shaded Area, Titled 'BB Basis Fill')
Calculation: The area between BB Basis and BB Basis EMA is filled.
Color Logic: Currently set to a constant semi-transparent gray regardless of position.
Visuals: Semi-transparent gray fill.
Uses:
Highlights divergence: Shows when the shorter-term BB Basis deviates from its longer-term EMA, indicating potential volatility shifts.
Visual aid for crossovers: Makes it easier to spot when BB Basis crosses its EMA.
In trading: Could be used to identify overextensions in volatility (e.g., wide gray areas might signal impending mean reversion).
Zero Line (Black Horizontal Line)
Calculation: A simple horizontal line at y=0.
Visuals: Solid black line.
Uses:
Reference point: Divides bullish (above) from bearish (below) territory for all MACD-related lines.
In trading: Crossovers of the zero line by the MACD Line or BB Basis can signal major trend changes.
How It Differs from a Normal MACD
A standard MACD (e.g., the built-in TradingView MACD with defaults 12/26/9) consists of:
MACD Line: EMA(12) - EMA(26).
Signal Line: EMA(MACD Line, 9).
Histogram: MACD Line - Signal Line (bars showing convergence/divergence).
Key differences in "LA - MACD EMA Bands":
Periods: Uses a much longer slow EMA (144 vs. 26), making it more sensitive to long-term trends but less reactive to short-term price action. The MACD EMA is 12 periods (vs. 9), further emphasizing smoothing.
No Histogram: Replaces the histogram with fills and bands for visual emphasis on crossovers and volatility.
Added Bollinger Bands: Applies BB directly to the MACD Line (with a long 144-period basis), introducing volatility analysis absent in standard MACD. This helps detect "squeezes" or expansions in momentum.
Additional EMA Layer: The BB Basis EMA (72-period) adds a secondary smoothing level to the BB system, providing a hierarchical view of momentum (short-term MACD → mid-term BB → long-term EMA).
Multi-Timeframe Support: Built-in option for higher timeframes, unlike basic MACD.
Focus: Standard MACD is purely momentum-focused; this version integrates volatility (via BB) and multi-layer smoothing, making it better for trend-following in volatile markets but potentially overwhelming for beginners.
Overall, this indicator transforms the MACD from a simple oscillator into a comprehensive momentum-volatility hybrid, reducing false signals in trending markets but introducing lag.
Overall Pros and Cons
Pros:
Enhanced Visualization: Fills and bands make trends, crossovers, and volatility easier to spot without needing multiple indicators.
Reduced Noise: Longer periods (144, 72) smooth out whipsaws, ideal for swing or position trading in trending assets like stocks or forex.
Volatility Integration: BB adds a dimension not in standard MACD, helping identify breakouts or consolidations.
Customizable: Inputs for timeframes and lengths allow adaptation to different assets/timeframes.
Multi-Layered Insights: Combines short-term signals (MACD crossovers) with long-term confirmation (BB EMA), improving signal reliability.
Cons:
Lagging Nature: Long periods (e.g., 144) delay signals, missing early entries in fast markets or leading to late exits.
Complexity: Multiple lines and fills can clutter the pane, requiring experience to interpret; beginners might misread it.
Potential Overfitting: Custom periods (12/144/12/144/72) may work well on historical data but underperform in live trading without backtesting.
No Built-in Alerts/Signals: Relies on visual interpretation; users must manually set alerts for crossovers.
Resource Intensive: On lower timeframes or with lookahead, it might slow chart loading on Trading View.
This indicator shines in strategies combining momentum and volatility, like trend-following with BB squeezes, but test it on your assets (e.g., via backtesting) to ensure it fits your style.
For Better view, use this indicator along with "LA - EMA Bands with MTF Dashboard"

RSI & BB Oversold Scalper with MACD Confirmation [DotGain]RSI & BB Oversold Scalper with MACD Confirmation
The RSI & BB Oversold Scalper is a mean reversion / dip-buying indicator designed for traders who want to combine oversold conditions with momentum confirmation .
It uses a multi-step logic: first detect an oversold setup, then wait for a MACD confirmation within a defined time window before issuing a buy signal.
---
Core Concept
1. Detect an oversold setup using Bollinger Bands %b, RSI and an optional DSS filter
2. Keep the setup active for a limited number of candles
3. Trigger the entry using a MACD bullish crossover
4. Reset after entry to avoid multiple signals from the same setup
---
Buy Signal Logic
A buy signal is generated when the following conditions are met:
1. Oversold Setup (filters can be enabled/disabled individually)
• Bollinger Bands %b Oversold (Lookback-based)
The price has traded below the lower Bollinger Band at least once within the last `lookbackBB` candles.
• RSI Oversold (Lookback-based)
The RSI has dropped below 30 at least once within the last `lookbackRSI` candles.
• DSS (Double Smoothed Stochastic) Reversal Filter
A bullish crossover of the DSS line above its signal line while the DSS value is below 20 , indicating a potential momentum reversal from oversold conditions.
Note:
BB %b and RSI are lookback filters , while the DSS condition is a single-bar crossover event .
---
2. MACD Confirmation (Entry Timing)
After the setup becomes active, the indicator waits for a bullish MACD crossover (`MACD line crosses above Signal line`) within a user-defined time window (`validWindow` candles).
If the MACD confirmation occurs within this window, a buy signal is printed.
If the window expires without confirmation, the setup is discarded automatically.
---
Reset Logic
• After a buy signal, the setup is reset immediately
• Only one signal is allowed per setup
• No late entries after the time window expires
---
Inputs & Customization
• Enable or disable BB, RSI and DSS filters individually
• Adjust lookback periods to control how recent oversold conditions must be
• Tune the MACD confirmation window to balance early vs. conservative entries
Smaller windows = faster, more aggressive entries
Larger windows = fewer but more confirmed signals
Recommended Markets & Timeframes
• Cryptocurrencies, Forex, Indices, liquid stocks
• Best suited for 1m – 15m scalping
• Also usable on 15m – 1h for slower mean-reversion trades
Visuals
• Buy signals are displayed as labels below the price candles
Important Notes
• This indicator is a signal and timing tool , not a complete trading system
• Always combine with higher-timeframe trend, support/resistance or volume analysis
• Backtesting and paper trading are strongly recommended
Disclaimer:
This "RSI & BB Oversold Scalper with MACD Confirmation" (Oversold Scalper) indicator is provided for informational and educational purposes only. It does not, and should not be construed as, financial, investment, or trading advice.
The signal generated by this tool (Green) is the result of a specific set of algorithmic conditions. They are not a direct recommendation to buy or sell any asset. The indicator's purpose is to highlight possible weakness in the markets, not to provide infallible trade signals.
All trading and investing in financial markets involves a substantial risk of loss. You can lose all of your invested capital.
Past performance is not indicative of future results. Even an indicator designed to filter out "chop" may produce false, lagging, or losing signals. Markets can remain unpredictable longer than you can remain solvent.
The creator DotGain assumes no liability for any financial losses or damages you may incur, directly or indirectly, as a result of using this indicator or the information it provides.
You are solely responsible for your own trading and investment decisions. Always conduct your own research (DYOR), validate signals with other methods, and consider your personal risk tolerance before entering any trade.

Linear Volume MACD | Lyro RS📊 Linear Volume MACD | Lyro RS is an advanced momentum and trend detection tool that fuses price action with volume-weighted MACD logic and linear regression analysis . Designed for traders seeking deeper insights into market strength and directional conviction, this indicator highlights trend shifts, volume anomalies, and potential reversal zones with precision.
✨ Key Features :
🔁 Multi-Mode Analysis: Switch between Linear Regression , Strong/Weak Trend , or Volume MACD logic.
📐 Volume-Adjusted MACD: Incorporates volume for a more realistic momentum view.
📊 Linear Regression Signal: Smoother and more reactive trend analysis.
🎯 Dynamic Stdev Bands: Visualize ±1 and ±2 standard deviation thresholds for anomaly detection.
🌈 Custom Color Themes: Choose from built-in palettes or define your own bullish/bearish signal colors.
⚠️ Alert Conditions: Built-in alerts notify you of potential trend shifts across all signal modes.
📈 How It Works :
🧮 MACD Core: Uses volume-weighted price to generate fast and slow EMAs, forming the MACD and signal lines.
📉 Histogram Logic: Histogram is either the traditional MACD histogram or its linear regression version.
📊 Signal Modes:
• Linear Regression: Detect trend based on smoothed MACD behavior.
• Strong/Weak Trend: Identifies accelerating/decelerating trend strength.
• Volume MACD: Classic volume MACD behavior for divergence spotting.
📏 Stdev Bands: Calculated over a long period (default 200) to highlight statistically significant moves.
🎨 Color-coded Feedback: Bar and background colors adjust dynamically with market condition.
⚙️ Customization Options :
🔄 Choose your Signal Type from three unique analysis modes.
📏 Modify Fast/Slow/Signal lengths and Regression parameters to suit your strategy.
📈 Enable or disable Stdev Bands and adjust multiplier.
🎨 Select from Classic, Mystic, Accented, or Royal color palettes — or create your own.
📌 Use Cases :
🟢 Identify trend continuation or reversal zones with volume-adjusted signals.
🔴 Detect volatility breakouts using standard deviation bands.
🧭 Use in confluence with price structure, RSI, or market sentiment.
⚠️ Disclaimer :
This indicator is for educational purposes only. It is not financial advice. Always use in conjunction with your own research and risk management strategy.

Multifactor Buy/Sell Strategy V2 | RSI, MACD, ATR, EMA, Boll.BITGET:1INCHUSDT
This Pine Script code for TradingView is a multifactor Buy/Sell indicator that combines several technical factors to generate trading signals based on trend, volatility, and volume conditions. Here’s a breakdown of the main components and functionality:
Indicator Name
- Multifactor Buy/Sell Strategy V2 — an overlay indicator applied directly on the price chart.
### Input Parameters
The script includes multiple customizable parameters:
- RSI, EMA, MACD parameters — for setting periods and signals of MACD and RSI.
- ATR and Bollinger Bands — used for volatility analysis and level determination.
- Minimum Volatility Threshold — sets a minimum Bollinger Band width threshold for determining high volatility.
Core Indicators
1. RSI — calculated to identify oversold (below 30) and overbought (above 70) conditions.
2. EMA and MACD — calculates exponential moving averages and MACD histogram to determine trend direction.
3. ATR and Bollinger Bands — used to assess current volatility and establish dynamic upper and lower bands.
Volatility and Volume Analysis
- Determines the current ATR level and Bollinger Band width to evaluate high volatility.
- Calculates the volume moving average to track periods of increased volume during high volatility.
Trend Analysis
The script uses the difference between fast and slow EMAs to define strong trends:
- Uptrend — when the fast EMA is above the slow EMA, the price is above the fast EMA, and the trend is strong.
- Downtrend — when the fast EMA is below the slow EMA, the price is below the fast EMA, and the trend is strong.
Momentum Filter
- Based on the price change over the last three bars and compared against the minimum volatility threshold to identify strong momentum.
Buy and Sell Signal Generation
- Buy Signal: Uptrend with RSI oversold, positive MACD histogram, high volatility and volume, strong momentum, and sufficient Bollinger Band width.
- Sell Signal: Downtrend with RSI overbought, negative MACD histogram, high volatility and volume, strong momentum, and sufficient Bollinger Band width.
Visualization
- Buy and sell signals are displayed as green and red triangles on the chart.
- Plots for fast and slow EMAs, upper and lower bands, and Bollinger Bands.
Alerts
The script includes alert conditions for buy and sell signals, allowing notifications to be sent via email or mobile app.
Information Panel
A small table on the chart displays current volatility dataThis Pine Script code for TradingView is a multifactor Buy/Sell indicator that combines several technical factors to generate trading signals based on trend, volatility, and volume conditions. Here’s a breakdown of the main components and functionality:
Indicator Name
- Multifactor Buy/Sell Strategy V2 — an overlay indicator applied directly on the price chart.
Input Parameters
The script includes multiple customizable parameters:
- **RSI, EMA, MACD parameters** — for setting periods and signals of MACD and RSI.
- **ATR and Bollinger Bands** — used for volatility analysis and level determination.
- **Minimum Volatility Threshold** — sets a minimum Bollinger Band width threshold for determining high volatility.
Core Indicators
1. RSI — calculated to identify oversold (below 30) and overbought (above 70) conditions.
2. EMA and MACD — calculates exponential moving averages and MACD histogram to determine trend direction.
3. ATR and Bollinger Bands — used to assess current volatility and establish dynamic upper and lower bands.
Volatility and Volume Analysis
- Determines the current ATR level and Bollinger Band width to evaluate high volatility.
- Calculates the volume moving average to track periods of increased volume during high volatility.
Trend Analysis
The script uses the difference between fast and slow EMAs to define strong trends:
- Uptrend — when the fast EMA is above the slow EMA, the price is above the fast EMA, and the trend is strong.
- Downtrend — when the fast EMA is below the slow EMA, the price is below the fast EMA, and the trend is strong.
Momentum Filter
- Based on the price change over the last three bars and compared against the minimum volatility threshold to identify strong momentum.
Buy and Sell Signal Generation
- Buy Signal: Uptrend with RSI oversold, positive MACD histogram, high volatility and volume, strong momentum, and sufficient Bollinger Band width.
- Sell Signal: Downtrend with RSI overbought, negative MACD histogram, high volatility and volume, strong momentum, and sufficient Bollinger Band width.
Visualization
- Buy and sell signals are displayed as green and red triangles on the chart.
- Plots for fast and slow EMAs, upper and lower bands, and Bollinger Bands.
Alerts
The script includes alert conditions for buy and sell signals, allowing notifications to be sent via email or mobile app.
Information Panel
A small table on the chart displays current volatility
- Volatility Status — indicates high or low volatility.
- Bollinger Band Width — current width as a percentage.
- ATR Ratio — ratio of current ATR to long-term average ATR.
This script is suitable for trading in high-volatility conditions, combining multiple filters and factors to generate precise buy and sell signals.

CT Reverse MACD CrossIntroducing the Reverse MACD Cross
MACD.... short for moving average convergence/divergence, is a trading indicator used in technical analysis of stock prices, created by Gerald Appel in the late 1970s.
It is designed to reveal changes in the strength, direction, momentum, and duration of a trend in a stock's price.
Prior work by Johny Dough showed how we can compute the price level required to make the MACD stay at its current level,
and also how to compute the price level required for the MACD to cross the zero line.
I have brought that idea to it logical conclusion for the MACD by creating a new function which also computes the price level required to cross the MACD with its signal line.
This allows the user to quickly see all of the most relevant information from the MACD and the actual price levels where the indicator will change its posture.
The MACD indicator (or "oscillator") is a collection of three time series calculated from historical price data, most often the closing price.
These three series are:
the MACD series proper shown here in blue
the "Signal Line" or "average" series shown here in red
the "Divergence" series which is the difference between the two shown here as a histogram.
There is also usually a baseline set at zero.
The MACD series is the difference between a "fast" (short period) exponential moving average (EMA), and a "slow" (longer period) EMA of the price series.
The average series (signal line) is an EMA of the MACD series itself.
The MACD indicator thus depends on three parameters, namely the time periods of the three EMAs.
The notation "MACD ( a, b, c )" usually denotes the standard indicator where the MACD series is the difference of EMAs with characteristic times a and b, and the average series is an EMA of the MACD series with characteristic time c.
There is an infobox which displays...
Whether the MACD is falling or rising
the price level which will make the MACD to change from rising to falling or vice versa
the price level which will cause the MACD to cross the signal line
the price level which will cause the MACD to cross the zero line
The most commonly used values are 12 for the fast, 26 for the slow, and 9 for the signal line, that is, MACD ( 12, 26, 9 ) .
The MACD and average series are customarily displayed as continuous lines in a plot whose horizontal axis is time oscillating above and below a zero line, whereas the divergence is commonly shown as a bar graph / histogram.
A fast EMA responds more quickly than a slow EMA to recent changes in a stock's price.
By comparing EMAs of different periods, the MACD series can indicate changes in the trend of a stock.
It is claimed that the divergence series can reveal subtle shifts in the stock's trend.
Since the MACD is based on moving averages, it is a lagging indicator. As a future metric of price trends, the MACD is less useful for stocks that are not trending (trading in a range) or are trading with unpredictable price action.
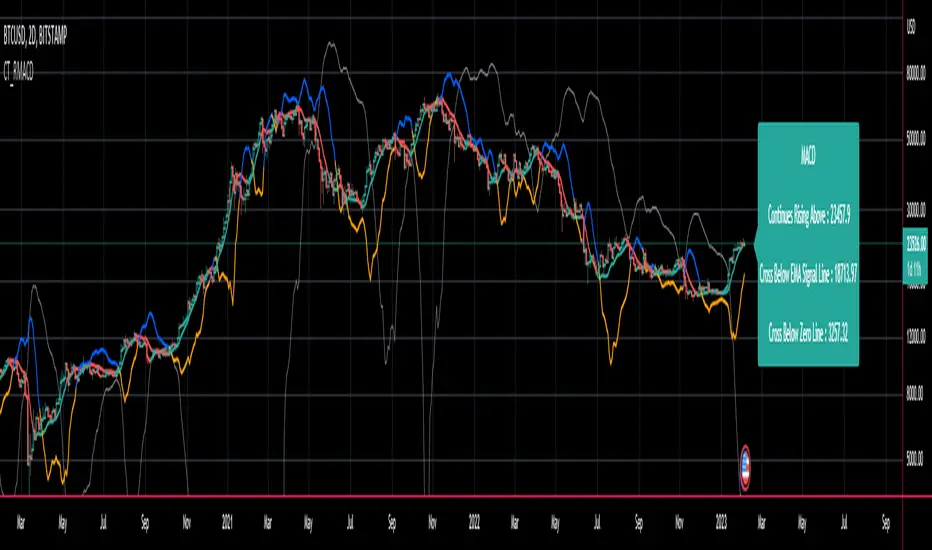
CVD-MACD### CVD-MACD (Research)
The CVD-MACD is a research-oriented indicator that combines Cumulative Volume Delta (CVD) with the classic MACD framework to provide insights into market momentum and potential reversals. Unlike a standard MACD based on price, this version uses CVD (the running total of buy vs. sell volume delta) as its input source, offering a volume-driven perspective on trend strength and divergences.
Key Features:
- **CVD-Based MACD Calculation**: Computes MACD using CVD instead of price, highlighting volume imbalances that may precede price moves.
- **Dual Divergence Detection**: Identifies bullish/bearish divergences on both the MACD line and histogram, with configurable pivot lookbacks and filters (e.g., momentum decay and zero-side consistency).
- **Visual Flexibility**: Toggle divergences in the indicator pane or overlaid on the main chart, with optional raw CVD line for reference.
- **Alerts**: Built-in conditions for bullish and bearish divergences to notify users of potential setups.
###This indicator is designed for research and experimentation—it's not financial advice. It performs best on liquid assets with reliable volume data (e.g., stocks, futures). I've shared this to gather community feedback: please test it thoroughly and point out any bugs, inefficiencies, or improvements! For example, if you spot issues with divergence detection on certain timeframes or symbols, let me know in the comments. Your input will help refine it.
Inspired by volume analysis techniques; open to collaborations or forks.
## User Manual for CVD-MACD (Research)
### Overview
The CVD-MACD indicator transforms traditional MACD by using Cumulative Volume Delta (CVD) as the base input. CVD accumulates the net delta between estimated buy and sell volume per bar, providing a volume-centric view of momentum. The indicator plots a MACD line, signal line, and histogram, while also detecting divergences on both the MACD line and histogram for potential reversal signals.
This manual covers setup, interpretation, and troubleshooting.
Note: This is a research tool—backtest and validate on your own data before using in live trading.
### Installation and Setup
1. **Add to Chart**: Search for "CVD-MACD (Research)" in TradingView's indicator library or paste the script into the Pine Editor and add it to your chart.
2. **Compatibility**: Works on any timeframe and symbol with volume data. Best on daily/intraday charts for stocks, forex, or futures. Avoid illiquid symbols where volume may be unreliable.
3. **Customization**: All inputs are configurable via the indicator's settings panel. Defaults are optimized for general use but can be tuned based on asset volatility.
### Input Parameters
The inputs are grouped for ease of use:
#### MACD Settings
- **Fast EMA (CVD)** (default: 12): Length of the fast EMA applied to CVD. Shorter values make it more responsive to recent volume changes.
- **Slow EMA (CVD)** (default: 26): Length of the slow EMA on CVD. Longer values smooth out noise for trend identification.
- **Signal EMA** (default: 9): Smoothing period for the signal line (EMA of the MACD line).
#### Divergence Logic (MACD Line)
- **Pivot Lookback (MACD Line)** (default: 5): Bars to look left/right for detecting pivots on the MACD line. Higher values detect larger swings but may miss smaller divergences.
- **Max Lookback Range (MACD Line)** (default: 50): Maximum bars between two pivots to consider a divergence valid. Prevents detecting outdated signals.
- **Enable Momentum Decay Filter (Histogram)** (default: false): When enabled, requires the histogram to show decaying momentum (absolute value decreasing) for MACD-line divergences to trigger.
#### Histogram Divergence
- **Pivot Lookback (Histogram)** (default: 5): Similar to above, but for histogram pivots.
- **Max Lookback Range (Histogram)** (default: 50): Max bars for histogram divergence detection.
- **Show Histogram Divergences in Indicator Pane** (default: true): Displays dashed lines and "H" labels for histogram divergences in the sub-window.
- **Show Histogram Divergences on Main Chart** (default: true): Overlays histogram divergences on the price chart with semi-transparent lines and labels.
- **Require Histogram to Stay on Same Side of Zero** (default: true): Filters divergences to only those where the histogram doesn't cross zero between pivots, ensuring consistent momentum direction.
#### Visuals (Dual View)
- **Show MACD-Line Divergences (Indicator Pane)** (default: true): Draws solid lines and "L" labels for MACD-line divergences in the sub-window.
- **Show MACD-Line Divergences (Main Chart)** (default: true): Overlays MACD-line divergences on the price chart.
- **Show Raw CVD Line** (default: false): Plots the underlying CVD as a faint gray line for reference.
### How to Interpret the Indicator
1. **Core Plots**:
- **MACD Line** (blue): Difference between fast and slow CVD EMAs. Above zero indicates building buy volume momentum; below zero shows sell dominance.
- **Signal Line** (orange): EMA of the MACD line. Crossovers can signal potential entries/exits (e.g., MACD above signal = bullish).
- **Histogram** (columns): MACD minus signal. Green shades for positive/expanding bars (bullish momentum); red for negative/contracting (bearish). Fading colors indicate weakening momentum.
- **Zero Line** (gray horizontal): Reference for bullish (above) vs. bearish (below) territory.
- **Raw CVD** (optional gray line): The cumulative buy-sell delta. Rising = net buying; falling = net selling.
2. **Divergences**:
- **Bullish (Green Lines/Labels)**: Occur when price makes lower lows, but MACD line or histogram makes higher lows. Suggests weakening downside momentum and potential reversal up. Look for "L" (MACD line) or "H" (histogram) labels.
- **Bearish (Red Lines/Labels)**: Price higher highs vs. MACD/histogram lower highs. Indicates fading upside and possible downturn.
- **Dual View**: Divergences appear in the indicator pane (sub-window) for clean analysis and overlaid on the main chart for price context. Histogram divergences use dashed lines to distinguish from MACD-line (solid).
- **Filters**: Momentum decay ensures only "hidden" or weakening divergences trigger. Zero-side filter prevents false signals from oscillating histograms.
3. **Alerts**:
- **Bullish Divergence (L or H)**: Triggers on either MACD-line or histogram bullish divergence. Message: "CVD-MACD Bullish Divergence detected on {{ticker}}".
- **Bearish Divergence (L or H)**: Similar for bearish. Use TradingView's alert setup to notify via email/SMS/webhook.
- Tip: Combine with price action (e.g., support/resistance) for confirmation.
### Usage Tips and Strategies
- **Trend Confirmation**: Use in uptrends for bullish divergences (pullback buys) or downtrends for bearish (short entries).
- **Timeframe Selection**: Higher timeframes (e.g., daily) for swing trading; lower (e.g., 15-min) for intraday. Adjust pivot lookbacks accordingly (shorter for faster charts).
- **Combination Ideas**: Pair with RSI for overbought/oversold confirmation or VWAP for intraday volume context.
- **Risk Management**: Divergences are probabilistic—not guarantees. Always use stop-losses based on recent swings.
- **Performance Notes**: Backtest on historical data via TradingView's Strategy Tester. CVD relies on accurate volume; test on exchanges like NYSE/NASDAQ.
### Known Limitations and Troubleshooting
- **Volume Dependency**: CVD estimation assumes linear buy/sell distribution based on bar position—may be less accurate on thin markets or during gaps.
- **Repainting**: Pivots and divergences can repaint as new data arrives (common in pivot-based indicators). Use on closed bars for reliability.
- **Resource Usage**: High max_bars_back (5000) ensures deep history; reduce if chart loads slowly.
- **No Signals on Low-Volume Bars**: If CVD flatlines, check symbol volume—some crypto/forex pairs have inconsistent data.
- **Community Feedback**: If you encounter bugs (e.g., false divergences on specific symbols/timeframes), missing alerts, or calculation errors, please comment below with details like symbol, timeframe, and screenshots. Suggestions for enhancements (e.g., more filters or visuals) are welcome!
If you have questions or find issues, drop a comment—let's improve this together!

RSI + MACD Multi-Timeframe StrategyThis strategy combines the Relative Strength Index (RSI) from the daily timeframe with the Moving Average Convergence Divergence (MACD) from the 4-hour timeframe to generate precise long entry and exit signals.
The system uses a multi-timeframe approach to align longer-term trend conditions with shorter-term momentum shifts — allowing traders to catch dips with confirmation and exit before reversals.
🧠 Strategy Logic
✅ Long Entry Condition:
- RSI on the daily (1D) timeframe is oversold (below your defined threshold)
- MACD on the 4H timeframe crosses above the signal line
→ A long trade is opened when these two align
✅ Long Exit Condition:
- RSI on the daily timeframe is overbought
- MACD on the 4H timeframe crosses below the signal line
→ The long trade is closed when these two conditions are met
💡 This strategy currently supports long entries only. Short logic can be added if needed.
📊 Indicator Components
🔹 RSI (Relative Strength Index):
- A momentum oscillator that measures the speed and magnitude of price changes.
- Helps identify overbought (potential sell) and oversold (potential buy) conditions.
- Applied on the 1D timeframe (by default) to reflect broader market trend or exhaustion levels.
🔹 MACD (Moving Average Convergence Divergence):
- A trend-following momentum indicator based on moving averages.
- The MACD Line (fast EMA - slow EMA) crossing above the Signal Line indicates bullish momentum.
- Used here on the 4-hour timeframe (by default) for shorter-term momentum confirmation.
🔹 Multi-Timeframe (MTF) Logic:
- Uses request.security() to pull higher timeframe data (1D for RSI, 4H for MACD).
- Ensures no repainting, as it only uses closed candles from the higher timeframe.
- Aligns longer-term signals with shorter-term entries, reducing false signals.
📈 Plotting Options
The script includes a plot selector input allowing you to toggle between:
- RSI Plot (with overbought/oversold lines)
- MACD Plot (MACD line and signal line)
- This helps visualize signal conditions clearly on your chart.
🛠 Customization
- RSI & MACD settings are fully configurable
- RSI and MACD timeframes can be adjusted independently
⚠️ Disclaimer
This strategy is provided for educational and informational purposes only.
It is not financial advice or a recommendation to buy or sell any asset.
Past performance does not guarantee future results. Always test strategies in a simulated environment before live use, and consult with a licensed financial advisor for investment decisions.

WHANG EMA-MACD🔥 Smart EMA14 x EMA70 + MACD Trend Alert System
Description:
Tired of chasing false signals?
This simple but powerful indicator helps you catch real trend moves — not the noise.
When EMA14 crosses EMA70 with MACD confirmation, and both EMAs point the same way, you’ll get a clean Buy or Sell alert right on your chart.
No messy settings, no guessing — just clear signals in strong trends.
✨ Features:
🔔 Real-time alerts via “Any alert() function call”
🟢 Buy when EMA14 crosses above EMA70 + MACD > 0
🔴 Sell when EMA14 crosses below EMA70 + MACD < 0
📈 Trades only when both EMAs slope in the same direction
⚙️ Customizable inputs for any market or timeframe
How to use:
Add the indicator to your chart
Create an alert → choose Any alert() function call
Relax and wait for your signals — no need to watch every candle!
Perfect for traders who want to follow the trend, avoid sideways traps, and get early alerts when momentum kicks in 🚀